
|
|||||
|
 | |
| |
| |
| |
| |
| |
|
Gene: PPA2 |
Gene summary for PPA2 |
| Gene information | Species | Human | Gene symbol | PPA2 | Gene ID | 27068 |
| Gene name | inorganic pyrophosphatase 2 | |
| Gene Alias | HSPC124 | |
| Cytomap | 4q24 | |
| Gene Type | protein-coding | GO ID | GO:0006082 | UniProtAcc | Q9H2U2 |
Top |
Malignant transformation analysis |
| Identification of the aberrant gene expression in precancerous and cancerous lesions by comparing the gene expression of stem-like cells in diseased tissues with normal stem cells |
| Entrez ID | Symbol | Replicates | Species | Organ | Tissue | Adj P-value | Log2FC | Malignancy |
| 27068 | PPA2 | HTA11_3410_2000001011 | Human | Colorectum | AD | 7.33e-13 | -4.81e-01 | 0.0155 |
| 27068 | PPA2 | HTA11_347_2000001011 | Human | Colorectum | AD | 2.59e-02 | 3.50e-01 | -0.1954 |
| 27068 | PPA2 | HTA11_866_2000001011 | Human | Colorectum | AD | 1.04e-07 | -3.55e-01 | -0.1001 |
| 27068 | PPA2 | HTA11_7696_3000711011 | Human | Colorectum | AD | 2.33e-04 | -2.56e-01 | 0.0674 |
| 27068 | PPA2 | HTA11_99999973899_84307 | Human | Colorectum | MSS | 5.39e-05 | -5.32e-01 | 0.2585 |
| 27068 | PPA2 | HTA11_99999974143_84620 | Human | Colorectum | MSS | 2.33e-15 | -4.98e-01 | 0.3005 |
| 27068 | PPA2 | F007 | Human | Colorectum | FAP | 5.15e-03 | -2.84e-01 | 0.1176 |
| 27068 | PPA2 | A001-C-207 | Human | Colorectum | FAP | 3.02e-06 | -3.94e-01 | 0.1278 |
| 27068 | PPA2 | A015-C-203 | Human | Colorectum | FAP | 2.34e-39 | -6.48e-01 | -0.1294 |
| 27068 | PPA2 | A015-C-204 | Human | Colorectum | FAP | 7.29e-10 | -3.97e-01 | -0.0228 |
| 27068 | PPA2 | A014-C-040 | Human | Colorectum | FAP | 3.98e-05 | -4.24e-01 | -0.1184 |
| 27068 | PPA2 | A002-C-201 | Human | Colorectum | FAP | 5.51e-19 | -4.75e-01 | 0.0324 |
| 27068 | PPA2 | A002-C-203 | Human | Colorectum | FAP | 2.05e-05 | -1.25e-01 | 0.2786 |
| 27068 | PPA2 | A001-C-119 | Human | Colorectum | FAP | 8.21e-23 | -7.87e-01 | -0.1557 |
| 27068 | PPA2 | A001-C-108 | Human | Colorectum | FAP | 2.08e-29 | -5.54e-01 | -0.0272 |
| 27068 | PPA2 | A002-C-205 | Human | Colorectum | FAP | 4.57e-29 | -6.04e-01 | -0.1236 |
| 27068 | PPA2 | A001-C-104 | Human | Colorectum | FAP | 2.17e-10 | -4.14e-01 | 0.0184 |
| 27068 | PPA2 | A015-C-005 | Human | Colorectum | FAP | 1.34e-07 | -4.10e-01 | -0.0336 |
| 27068 | PPA2 | A015-C-006 | Human | Colorectum | FAP | 1.19e-23 | -6.94e-01 | -0.0994 |
| 27068 | PPA2 | A015-C-106 | Human | Colorectum | FAP | 7.54e-24 | -4.65e-01 | -0.0511 |
| Page: 1 2 3 4 5 6 7 8 |
| Tissue | Expression Dynamics | Abbreviation |
| Colorectum (GSE201348) |  | FAP: Familial adenomatous polyposis |
| CRC: Colorectal cancer | ||
| Colorectum (HTA11) |  | AD: Adenomas |
| SER: Sessile serrated lesions | ||
| MSI-H: Microsatellite-high colorectal cancer | ||
| MSS: Microsatellite stable colorectal cancer | ||
| Esophagus | 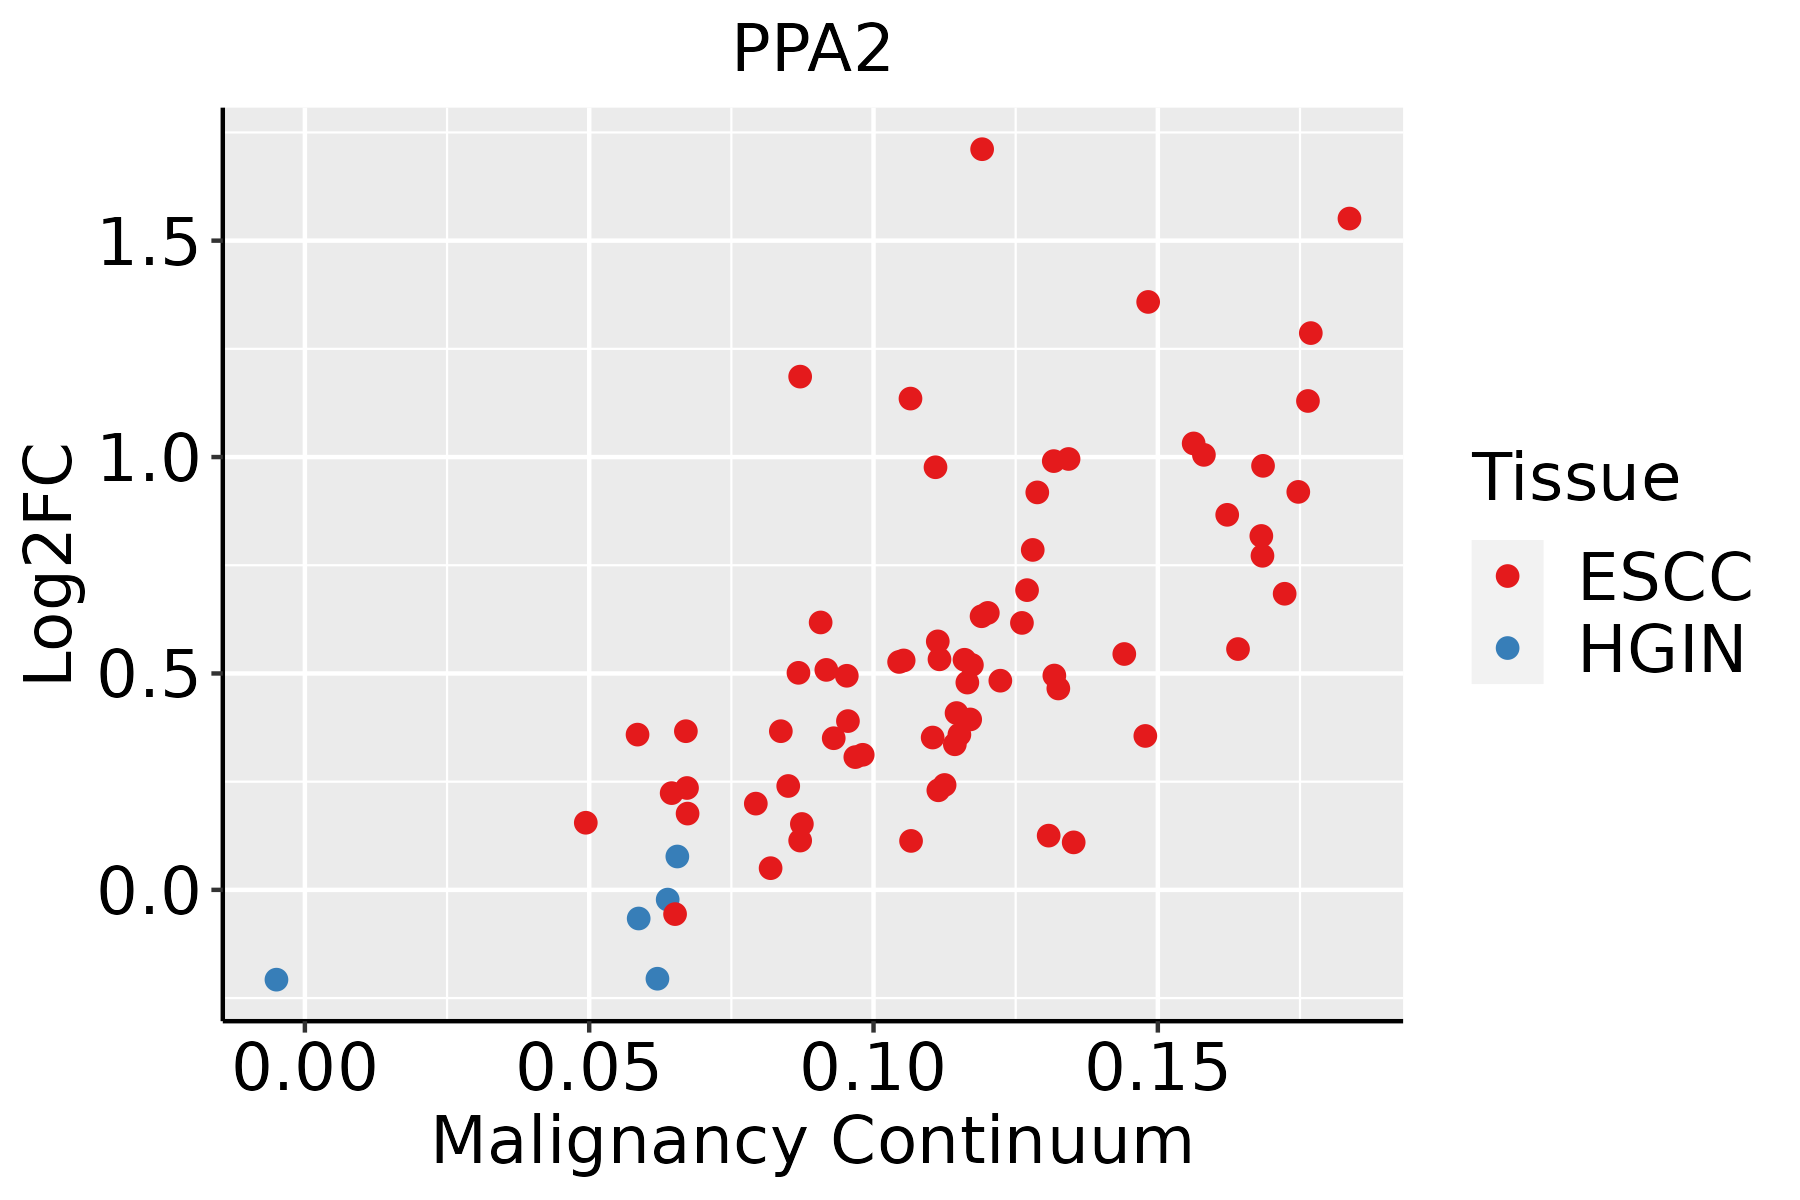 | ESCC: Esophageal squamous cell carcinoma |
| HGIN: High-grade intraepithelial neoplasias | ||
| LGIN: Low-grade intraepithelial neoplasias | ||
| Liver |  | HCC: Hepatocellular carcinoma |
| NAFLD: Non-alcoholic fatty liver disease | ||
| Lung | 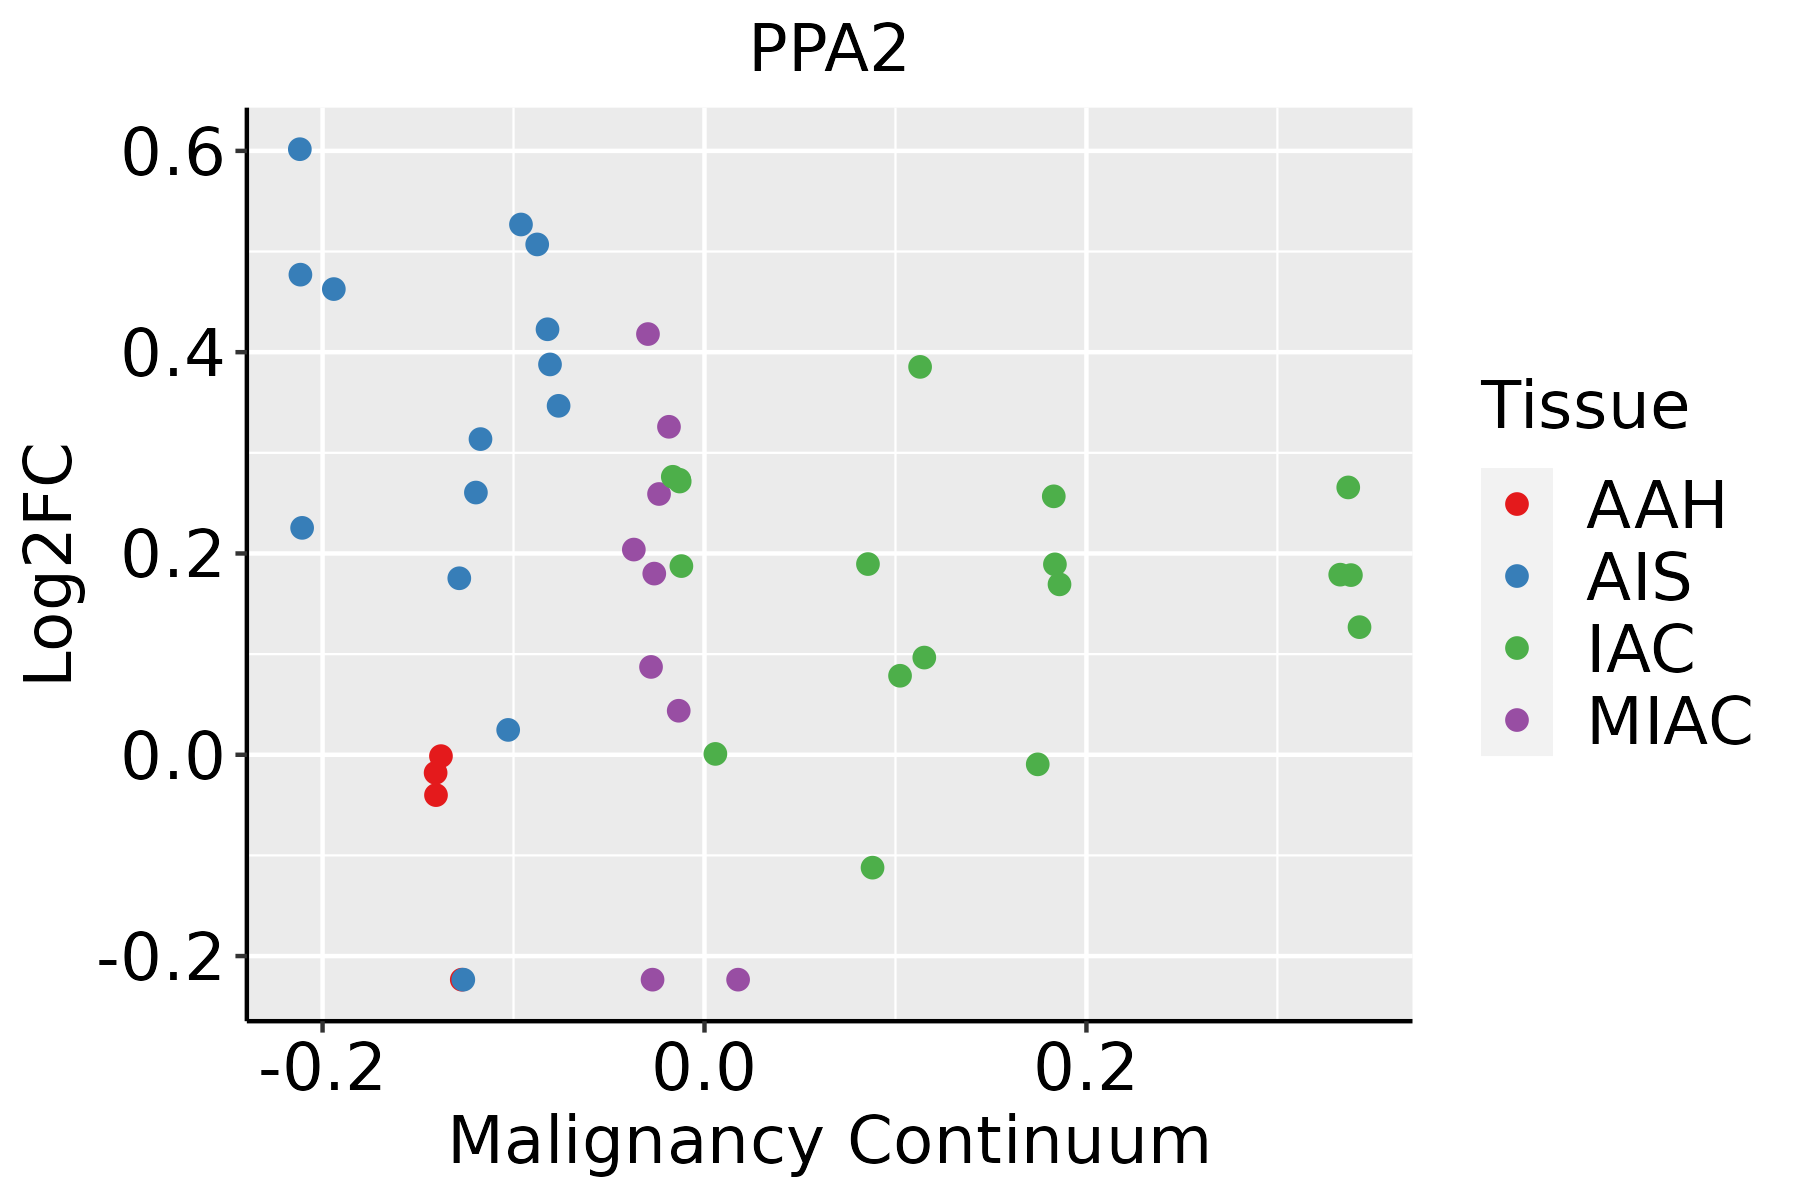 | AAH: Atypical adenomatous hyperplasia |
| AIS: Adenocarcinoma in situ | ||
| IAC: Invasive lung adenocarcinoma | ||
| MIA: Minimally invasive adenocarcinoma | ||
| Oral Cavity | 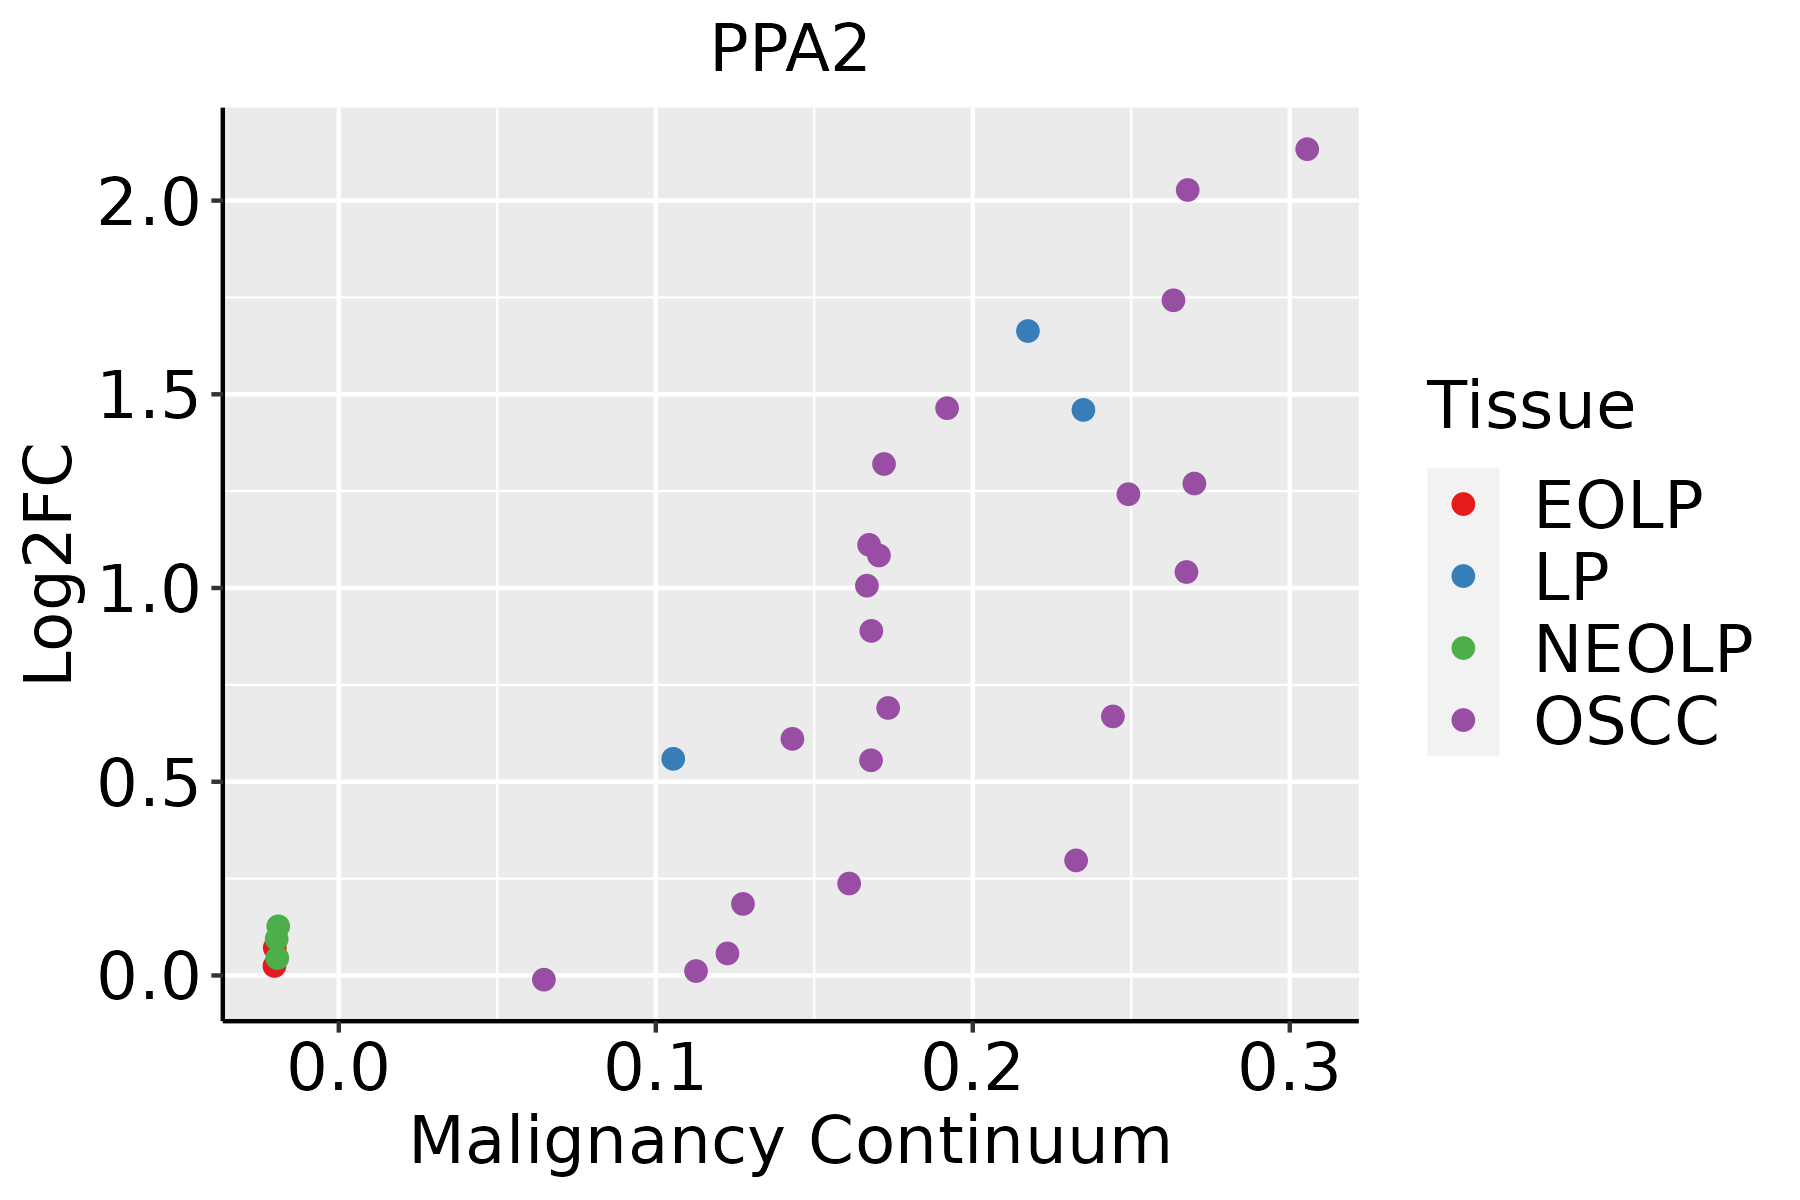 | EOLP: Erosive Oral lichen planus |
| LP: leukoplakia | ||
| NEOLP: Non-erosive oral lichen planus | ||
| OSCC: Oral squamous cell carcinoma | ||
| Skin |  | AK: Actinic keratosis |
| cSCC: Cutaneous squamous cell carcinoma | ||
| SCCIS:squamous cell carcinoma in situ |
| ∗log2FC in expression of this searched gene in stem-like cells from each diseased tissue sample relative to stem-like cells in normal samples in each tissue plotted against the malignancy continuum. Samples are colored based on if they are from different disease stage. |
Top |
Malignant transformation related pathway analysis |
| Find out the enriched GO biological processes and KEGG pathways involved in transition from healthy to precancer to cancer |
| Tissue | Disease Stage | Enriched GO biological Processes |
| Colorectum | AD |  |
| Colorectum | SER |  |
| Colorectum | MSS |  |
| Colorectum | MSI-H |  |
| Colorectum | FAP |  |
| ∗Top 15 enriched GO BP terms are showed in the bar plot of each disease state in each tissue. Each row represents a significant GO biological process which is colored according to the -log10(p.adjust). |
| Page: 1 2 3 4 5 6 7 8 9 |
| GO ID | Tissue | Disease Stage | Description | Gene Ratio | Bg Ratio | pvalue | p.adjust | Count |
| GO:0016311 | Colorectum | AD | dephosphorylation | 123/3918 | 417/18723 | 1.84e-05 | 3.82e-04 | 123 |
| GO:0006470 | Colorectum | AD | protein dephosphorylation | 88/3918 | 281/18723 | 2.56e-05 | 4.89e-04 | 88 |
| GO:0051881 | Colorectum | AD | regulation of mitochondrial membrane potential | 29/3918 | 74/18723 | 2.54e-04 | 3.20e-03 | 29 |
| GO:00064702 | Colorectum | MSS | protein dephosphorylation | 73/3467 | 281/18723 | 1.15e-03 | 1.12e-02 | 73 |
| GO:00518812 | Colorectum | MSS | regulation of mitochondrial membrane potential | 25/3467 | 74/18723 | 1.25e-03 | 1.20e-02 | 25 |
| GO:00163112 | Colorectum | MSS | dephosphorylation | 101/3467 | 417/18723 | 1.98e-03 | 1.70e-02 | 101 |
| GO:00163113 | Colorectum | FAP | dephosphorylation | 95/2622 | 417/18723 | 7.07e-07 | 3.32e-05 | 95 |
| GO:00064704 | Colorectum | FAP | protein dephosphorylation | 69/2622 | 281/18723 | 1.47e-06 | 6.39e-05 | 69 |
| GO:00163114 | Colorectum | CRC | dephosphorylation | 79/2078 | 417/18723 | 1.27e-06 | 7.21e-05 | 79 |
| GO:00064705 | Colorectum | CRC | protein dephosphorylation | 57/2078 | 281/18723 | 4.49e-06 | 1.87e-04 | 57 |
| GO:0042391 | Colorectum | CRC | regulation of membrane potential | 67/2078 | 434/18723 | 3.27e-03 | 2.81e-02 | 67 |
| GO:001631110 | Esophagus | ESCC | dephosphorylation | 251/8552 | 417/18723 | 1.26e-09 | 2.99e-08 | 251 |
| GO:000647018 | Esophagus | ESCC | protein dephosphorylation | 177/8552 | 281/18723 | 3.13e-09 | 6.72e-08 | 177 |
| GO:005188110 | Esophagus | ESCC | regulation of mitochondrial membrane potential | 51/8552 | 74/18723 | 4.42e-05 | 3.51e-04 | 51 |
| GO:00163115 | Liver | NAFLD | dephosphorylation | 69/1882 | 417/18723 | 2.27e-05 | 6.23e-04 | 69 |
| GO:00064706 | Liver | NAFLD | protein dephosphorylation | 50/1882 | 281/18723 | 4.53e-05 | 1.09e-03 | 50 |
| GO:000647011 | Liver | Cirrhotic | protein dephosphorylation | 96/4634 | 281/18723 | 2.32e-04 | 2.11e-03 | 96 |
| GO:001631111 | Liver | Cirrhotic | dephosphorylation | 130/4634 | 417/18723 | 1.58e-03 | 1.03e-02 | 130 |
| GO:00518815 | Liver | Cirrhotic | regulation of mitochondrial membrane potential | 30/4634 | 74/18723 | 1.97e-03 | 1.23e-02 | 30 |
| GO:001631121 | Liver | HCC | dephosphorylation | 230/7958 | 417/18723 | 1.00e-07 | 1.96e-06 | 230 |
| Page: 1 2 3 |
| Pathway ID | Tissue | Disease Stage | Description | Gene Ratio | Bg Ratio | pvalue | p.adjust | qvalue | Count |
| hsa00190 | Colorectum | AD | Oxidative phosphorylation | 86/2092 | 134/8465 | 2.47e-22 | 2.76e-20 | 1.76e-20 | 86 |
| hsa001901 | Colorectum | AD | Oxidative phosphorylation | 86/2092 | 134/8465 | 2.47e-22 | 2.76e-20 | 1.76e-20 | 86 |
| hsa001904 | Colorectum | MSS | Oxidative phosphorylation | 79/1875 | 134/8465 | 1.89e-20 | 7.90e-19 | 4.84e-19 | 79 |
| hsa001905 | Colorectum | MSS | Oxidative phosphorylation | 79/1875 | 134/8465 | 1.89e-20 | 7.90e-19 | 4.84e-19 | 79 |
| hsa001908 | Colorectum | FAP | Oxidative phosphorylation | 44/1404 | 134/8465 | 2.56e-06 | 4.28e-05 | 2.60e-05 | 44 |
| hsa001909 | Colorectum | FAP | Oxidative phosphorylation | 44/1404 | 134/8465 | 2.56e-06 | 4.28e-05 | 2.60e-05 | 44 |
| hsa00190210 | Esophagus | ESCC | Oxidative phosphorylation | 104/4205 | 134/8465 | 2.04e-11 | 2.98e-10 | 1.53e-10 | 104 |
| hsa0019038 | Esophagus | ESCC | Oxidative phosphorylation | 104/4205 | 134/8465 | 2.04e-11 | 2.98e-10 | 1.53e-10 | 104 |
| hsa0019014 | Liver | Cirrhotic | Oxidative phosphorylation | 83/2530 | 134/8465 | 1.03e-14 | 3.44e-13 | 2.12e-13 | 83 |
| hsa0019015 | Liver | Cirrhotic | Oxidative phosphorylation | 83/2530 | 134/8465 | 1.03e-14 | 3.44e-13 | 2.12e-13 | 83 |
| hsa0019022 | Liver | HCC | Oxidative phosphorylation | 103/4020 | 134/8465 | 2.39e-12 | 5.01e-11 | 2.79e-11 | 103 |
| hsa0019032 | Liver | HCC | Oxidative phosphorylation | 103/4020 | 134/8465 | 2.39e-12 | 5.01e-11 | 2.79e-11 | 103 |
| hsa0019028 | Oral cavity | OSCC | Oxidative phosphorylation | 88/3704 | 134/8465 | 2.15e-07 | 1.44e-06 | 7.32e-07 | 88 |
| hsa00190112 | Oral cavity | OSCC | Oxidative phosphorylation | 88/3704 | 134/8465 | 2.15e-07 | 1.44e-06 | 7.32e-07 | 88 |
| hsa0019029 | Oral cavity | LP | Oxidative phosphorylation | 81/2418 | 134/8465 | 9.58e-15 | 2.45e-13 | 1.58e-13 | 81 |
| hsa0019037 | Oral cavity | LP | Oxidative phosphorylation | 81/2418 | 134/8465 | 9.58e-15 | 2.45e-13 | 1.58e-13 | 81 |
| hsa0019045 | Oral cavity | EOLP | Oxidative phosphorylation | 36/1218 | 134/8465 | 1.05e-04 | 4.57e-04 | 2.69e-04 | 36 |
| hsa0019055 | Oral cavity | EOLP | Oxidative phosphorylation | 36/1218 | 134/8465 | 1.05e-04 | 4.57e-04 | 2.69e-04 | 36 |
| Page: 1 |
Top |
Cell-cell communication analysis |
| Identification of potential cell-cell interactions between two cell types and their ligand-receptor pairs for different disease states |
| Ligand | Receptor | LRpair | Pathway | Tissue | Disease Stage |
| Page: 1 |
Top |
Single-cell gene regulatory network inference analysis |
| Find out the significant the regulons (TFs) and the target genes of each regulon across cell types for different disease states |
| TF | Cell Type | Tissue | Disease Stage | Target Gene | RSS | Regulon Activity |
| ∗The dot plots of a searched regulon are shown for all cell subpopulations in each disease state of each tissue based on the regulon specific score inferred using pySCENIC and by calculating the average expression. |
| Page: 1 |
Top |
Somatic mutation of malignant transformation related genes |
| Annotation of somatic variants for genes involved in malignant transformation |
| Hugo Symbol | Variant Class | Variant Classification | dbSNP RS | HGVSc | HGVSp | HGVSp Short | SWISSPROT | BIOTYPE | SIFT | PolyPhen | Tumor Sample Barcode | Tissue | Histology | Sex | Age | Stage | Therapy Types | Drugs | Outcome |
| PPA2 | SNV | Missense_Mutation | rs772083375 | c.182N>T | p.Ser61Phe | p.S61F | Q9H2U2 | protein_coding | deleterious(0) | possibly_damaging(0.832) | TCGA-A8-A0A7-01 | Breast | breast invasive carcinoma | Female | <65 | I/II | Unknown | Unknown | SD |
| PPA2 | SNV | Missense_Mutation | novel | c.817C>G | p.Gln273Glu | p.Q273E | Q9H2U2 | protein_coding | tolerated(1) | benign(0.001) | TCGA-BH-A2L8-01 | Breast | breast invasive carcinoma | Female | <65 | I/II | Chemotherapy | cytoxan | CR |
| PPA2 | insertion | Frame_Shift_Ins | novel | c.779dupA | p.Asn260LysfsTer7 | p.N260Kfs*7 | Q9H2U2 | protein_coding | TCGA-MA-AA42-01 | Cervix | cervical & endocervical cancer | Female | >=65 | I/II | Unknown | Unknown | SD | ||
| PPA2 | SNV | Missense_Mutation | rs765643758 | c.482G>A | p.Cys161Tyr | p.C161Y | Q9H2U2 | protein_coding | deleterious(0.02) | benign(0.335) | TCGA-AA-3821-01 | Colorectum | colon adenocarcinoma | Female | >=65 | I/II | Unknown | Unknown | SD |
| PPA2 | SNV | Missense_Mutation | c.315A>C | p.Lys105Asn | p.K105N | Q9H2U2 | protein_coding | deleterious(0) | probably_damaging(1) | TCGA-CA-6718-01 | Colorectum | colon adenocarcinoma | Male | <65 | I/II | Unknown | Unknown | PD | |
| PPA2 | SNV | Missense_Mutation | c.92C>T | p.Ala31Val | p.A31V | Q9H2U2 | protein_coding | tolerated(0.12) | benign(0.003) | TCGA-CK-6746-01 | Colorectum | colon adenocarcinoma | Female | >=65 | I/II | Unknown | Unknown | SD | |
| PPA2 | SNV | Missense_Mutation | rs146599366 | c.902G>A | p.Arg301His | p.R301H | Q9H2U2 | protein_coding | tolerated(0.58) | benign(0) | TCGA-T9-A92H-01 | Colorectum | colon adenocarcinoma | Male | >=65 | I/II | Unknown | Unknown | PD |
| PPA2 | SNV | Missense_Mutation | c.532C>A | p.Leu178Ile | p.L178I | Q9H2U2 | protein_coding | tolerated(0.36) | benign(0.062) | TCGA-AG-3892-01 | Colorectum | rectum adenocarcinoma | Female | <65 | I/II | Unknown | Unknown | SD | |
| PPA2 | SNV | Missense_Mutation | novel | c.415A>C | p.Ile139Leu | p.I139L | Q9H2U2 | protein_coding | tolerated(0.08) | probably_damaging(0.987) | TCGA-A5-A0GP-01 | Endometrium | uterine corpus endometrioid carcinoma | Female | <65 | I/II | Unknown | Unknown | SD |
| PPA2 | SNV | Missense_Mutation | novel | c.389N>T | p.Ala130Val | p.A130V | Q9H2U2 | protein_coding | tolerated(0.06) | possibly_damaging(0.473) | TCGA-A5-A1OF-01 | Endometrium | uterine corpus endometrioid carcinoma | Female | <65 | I/II | Unknown | Unknown | SD |
| Page: 1 2 3 |
Top |
Related drugs of malignant transformation related genes |
| Identification of chemicals and drugs interact with genes involved in malignant transfromation |
| (DGIdb 4.0) |
| Entrez ID | Symbol | Category | Interaction Types | Drug Claim Name | Drug Name | PMIDs |
| 27068 | PPA2 | ENZYME | risperidone | RISPERIDONE |
| Page: 1 |

Copyright 2023-Present -The University of Texas Health Science Center at Houston |