
|
|||||
|
 | |
| |
| |
| |
| |
| |
|
Gene: POU5F1 |
Gene summary for POU5F1 |
| Gene information | Species | Human | Gene symbol | POU5F1 | Gene ID | 5460 |
| Gene name | POU class 5 homeobox 1 | |
| Gene Alias | OCT3 | |
| Cytomap | 6p21.33 | |
| Gene Type | protein-coding | GO ID | GO:0000122 | UniProtAcc | M1S623 |
Top |
Malignant transformation analysis |
| Identification of the aberrant gene expression in precancerous and cancerous lesions by comparing the gene expression of stem-like cells in diseased tissues with normal stem cells |
| Entrez ID | Symbol | Replicates | Species | Organ | Tissue | Adj P-value | Log2FC | Malignancy |
| 5460 | POU5F1 | AEH-subject5 | Human | Endometrium | AEH | 3.48e-20 | 5.85e-01 | -0.2953 |
| 5460 | POU5F1 | EEC-subject2 | Human | Endometrium | EEC | 9.60e-04 | 3.33e-01 | -0.2607 |
| 5460 | POU5F1 | EEC-subject4 | Human | Endometrium | EEC | 2.00e-16 | 6.47e-01 | -0.2571 |
| 5460 | POU5F1 | EEC-subject5 | Human | Endometrium | EEC | 5.67e-04 | 2.90e-01 | -0.249 |
| Page: 1 |
| Tissue | Expression Dynamics | Abbreviation |
| Endometrium | 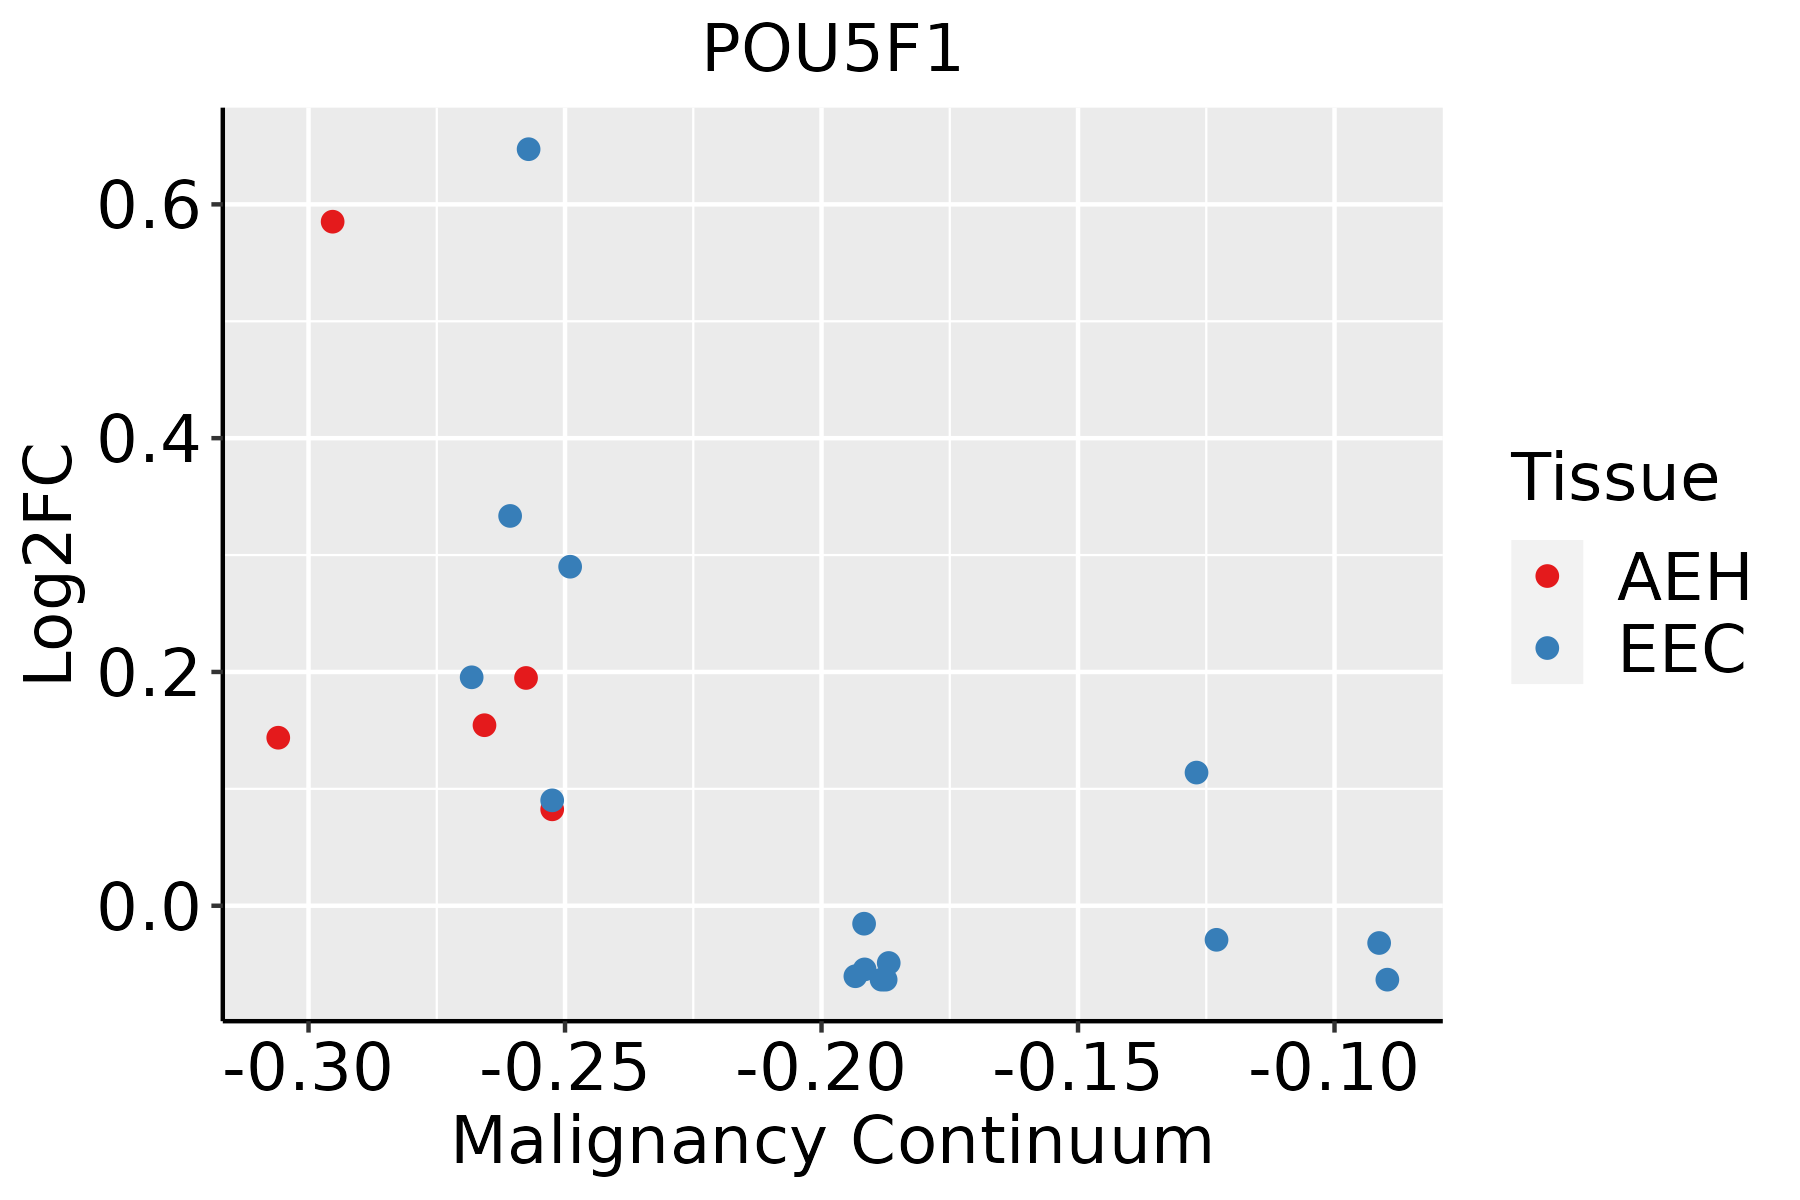 | AEH: Atypical endometrial hyperplasia |
| EEC: Endometrioid Cancer |
| ∗log2FC in expression of this searched gene in stem-like cells from each diseased tissue sample relative to stem-like cells in normal samples in each tissue plotted against the malignancy continuum. Samples are colored based on if they are from different disease stage. |
Top |
Malignant transformation related pathway analysis |
| Find out the enriched GO biological processes and KEGG pathways involved in transition from healthy to precancer to cancer |
| Tissue | Disease Stage | Enriched GO biological Processes |
| Colorectum | AD |  |
| Colorectum | SER |  |
| Colorectum | MSS |  |
| Colorectum | MSI-H |  |
| Colorectum | FAP |  |
| ∗Top 15 enriched GO BP terms are showed in the bar plot of each disease state in each tissue. Each row represents a significant GO biological process which is colored according to the -log10(p.adjust). |
| Page: 1 2 3 4 5 6 7 8 9 |
| GO ID | Tissue | Disease Stage | Description | Gene Ratio | Bg Ratio | pvalue | p.adjust | Count |
| GO:00017019 | Endometrium | AEH | in utero embryonic development | 73/2100 | 367/18723 | 7.18e-07 | 2.63e-05 | 73 |
| GO:00616149 | Endometrium | AEH | pri-miRNA transcription by RNA polymerase II | 20/2100 | 55/18723 | 9.36e-07 | 3.24e-05 | 20 |
| GO:19028939 | Endometrium | AEH | regulation of pri-miRNA transcription by RNA polymerase II | 19/2100 | 54/18723 | 3.09e-06 | 8.55e-05 | 19 |
| GO:00513022 | Endometrium | AEH | regulation of cell division | 32/2100 | 177/18723 | 4.33e-03 | 2.86e-02 | 32 |
| GO:0001824 | Endometrium | AEH | blastocyst development | 21/2100 | 106/18723 | 6.61e-03 | 3.90e-02 | 21 |
| GO:006161415 | Endometrium | EEC | pri-miRNA transcription by RNA polymerase II | 21/2168 | 55/18723 | 3.30e-07 | 1.33e-05 | 21 |
| GO:000170114 | Endometrium | EEC | in utero embryonic development | 75/2168 | 367/18723 | 5.86e-07 | 2.16e-05 | 75 |
| GO:190289315 | Endometrium | EEC | regulation of pri-miRNA transcription by RNA polymerase II | 20/2168 | 54/18723 | 1.11e-06 | 3.69e-05 | 20 |
| GO:00018241 | Endometrium | EEC | blastocyst development | 22/2168 | 106/18723 | 4.53e-03 | 2.92e-02 | 22 |
| GO:005130211 | Endometrium | EEC | regulation of cell division | 32/2168 | 177/18723 | 6.93e-03 | 3.98e-02 | 32 |
| Page: 1 |
| Pathway ID | Tissue | Disease Stage | Description | Gene Ratio | Bg Ratio | pvalue | p.adjust | qvalue | Count |
| Page: 1 |
Top |
Cell-cell communication analysis |
| Identification of potential cell-cell interactions between two cell types and their ligand-receptor pairs for different disease states |
| Ligand | Receptor | LRpair | Pathway | Tissue | Disease Stage |
| Page: 1 |
Top |
Single-cell gene regulatory network inference analysis |
| Find out the significant the regulons (TFs) and the target genes of each regulon across cell types for different disease states |
| TF | Cell Type | Tissue | Disease Stage | Target Gene | RSS | Regulon Activity |
| POU5F1 | STML | Cervix | CC | SORD,SEMA3B,GCNT2, etc. | 1.78e-01 |  |
| POU5F1 | TUF | Colorectum | ADJ | FKBP5,CYP3A5,PDE9A, etc. | 4.73e-02 |  |
| POU5F1 | SSC | Colorectum | ADJ | FKBP5,CYP3A5,PDE9A, etc. | 2.03e-02 | |
| POU5F1 | IMENT | Colorectum | CRC | FKBP5,CYP3A5,PDE9A, etc. | 7.59e-02 |  |
| POU5F1 | ABS | Colorectum | CRC | FKBP5,CYP3A5,PDE9A, etc. | 6.48e-02 | |
| POU5F1 | IMENT | Colorectum | FAP | FKBP5,CYP3A5,PDE9A, etc. | 1.50e-01 |  |
| POU5F1 | SURF | Endometrium | Healthy | SAA1,CRY2,SPP1, etc. | 4.58e-01 |  |
| POU5F1 | DIFF | Esophagus | ESCC | BASP1,PCCA,HIC1, etc. | 0.00e+00 |  |
| POU5F1 | GOB | Esophagus | ESCC | BASP1,PCCA,HIC1, etc. | 0.00e+00 | |
| POU5F1 | DIFF | Esophagus | HGIN | BASP1,PCCA,HIC1, etc. | 0.00e+00 |  |
| ∗The dot plots of a searched regulon are shown for all cell subpopulations in each disease state of each tissue based on the regulon specific score inferred using pySCENIC and by calculating the average expression. |
| Page: 1 2 |
Top |
Somatic mutation of malignant transformation related genes |
| Annotation of somatic variants for genes involved in malignant transformation |
| Hugo Symbol | Variant Class | Variant Classification | dbSNP RS | HGVSc | HGVSp | HGVSp Short | SWISSPROT | BIOTYPE | SIFT | PolyPhen | Tumor Sample Barcode | Tissue | Histology | Sex | Age | Stage | Therapy Types | Drugs | Outcome |
| POU5F1 | SNV | Missense_Mutation | c.428N>T | p.Gln143Leu | p.Q143L | Q01860 | protein_coding | deleterious(0.03) | benign(0.298) | TCGA-D8-A27G-01 | Breast | breast invasive carcinoma | Female | >=65 | I/II | Unknown | Unknown | SD | |
| POU5F1 | SNV | Missense_Mutation | novel | c.562G>C | p.Glu188Gln | p.E188Q | Q01860 | protein_coding | deleterious(0) | probably_damaging(0.999) | TCGA-E2-A574-01 | Breast | breast invasive carcinoma | Female | <65 | I/II | Chemotherapy | adriamycin | SD |
| POU5F1 | deletion | Frame_Shift_Del | c.330delN | p.Ser111ProfsTer12 | p.S111Pfs*12 | Q01860 | protein_coding | TCGA-AN-A0AK-01 | Breast | breast invasive carcinoma | Female | >=65 | I/II | Unknown | Unknown | SD | |||
| POU5F1 | SNV | Missense_Mutation | novel | c.381N>C | p.Glu127Asp | p.E127D | Q01860 | protein_coding | tolerated(0.06) | benign(0.222) | TCGA-C5-A8YQ-01 | Cervix | cervical & endocervical cancer | Female | >=65 | I/II | Chemotherapy | cisplatin | PD |
| POU5F1 | SNV | Missense_Mutation | c.468G>C | p.Lys156Asn | p.K156N | Q01860 | protein_coding | deleterious(0.01) | probably_damaging(0.997) | TCGA-C5-A902-01 | Cervix | cervical & endocervical cancer | Female | <65 | I/II | Chemotherapy | cisplatin | SD | |
| POU5F1 | SNV | Missense_Mutation | novel | c.286N>A | p.Glu96Lys | p.E96K | Q01860 | protein_coding | deleterious(0.02) | benign(0) | TCGA-JW-A5VL-01 | Cervix | cervical & endocervical cancer | Female | <65 | I/II | Unknown | Unknown | SD |
| POU5F1 | SNV | Missense_Mutation | novel | c.890N>G | p.Asp297Gly | p.D297G | Q01860 | protein_coding | tolerated(0.09) | benign(0.174) | TCGA-CA-6717-01 | Colorectum | colon adenocarcinoma | Male | <65 | I/II | Chemotherapy | oxaliplatin | CR |
| POU5F1 | SNV | Missense_Mutation | novel | c.738N>T | p.Glu246Asp | p.E246D | Q01860 | protein_coding | deleterious(0.04) | possibly_damaging(0.802) | TCGA-CA-6717-01 | Colorectum | colon adenocarcinoma | Male | <65 | I/II | Chemotherapy | oxaliplatin | CR |
| POU5F1 | SNV | Missense_Mutation | c.809A>G | p.Glu270Gly | p.E270G | Q01860 | protein_coding | deleterious(0) | benign(0.221) | TCGA-G4-6628-01 | Colorectum | colon adenocarcinoma | Male | >=65 | I/II | Unknown | Unknown | SD | |
| POU5F1 | insertion | Frame_Shift_Ins | novel | c.307dupG | p.Val103GlyfsTer86 | p.V103Gfs*86 | Q01860 | protein_coding | TCGA-AY-4070-01 | Colorectum | colon adenocarcinoma | Female | <65 | III/IV | Chemotherapy | 5-fu | PD |
| Page: 1 2 3 |
Top |
Related drugs of malignant transformation related genes |
| Identification of chemicals and drugs interact with genes involved in malignant transfromation |
| (DGIdb 4.0) |
| Entrez ID | Symbol | Category | Interaction Types | Drug Claim Name | Drug Name | PMIDs |
| 5460 | POU5F1 | TRANSCRIPTION FACTOR, CLINICALLY ACTIONABLE | phenytoin | PHENYTOIN | ||
| 5460 | POU5F1 | TRANSCRIPTION FACTOR, CLINICALLY ACTIONABLE | ETHANOL | ALCOHOL | 16112835 | |
| 5460 | POU5F1 | TRANSCRIPTION FACTOR, CLINICALLY ACTIONABLE | allopurinol | ALLOPURINOL | 21801394 | |
| 5460 | POU5F1 | TRANSCRIPTION FACTOR, CLINICALLY ACTIONABLE | carbamazepine | CARBAMAZEPINE |
| Page: 1 |

Copyright 2023-Present -The University of Texas Health Science Center at Houston |