
|
|||||
|
 | |
| |
| |
| |
| |
| |
|
Gene: POU3F1 |
Gene summary for POU3F1 |
| Gene information | Species | Human | Gene symbol | POU3F1 | Gene ID | 5453 |
| Gene name | POU class 3 homeobox 1 | |
| Gene Alias | OCT6 | |
| Cytomap | 1p34.3 | |
| Gene Type | protein-coding | GO ID | GO:0006139 | UniProtAcc | Q03052 |
Top |
Malignant transformation analysis |
| Identification of the aberrant gene expression in precancerous and cancerous lesions by comparing the gene expression of stem-like cells in diseased tissues with normal stem cells |
| Entrez ID | Symbol | Replicates | Species | Organ | Tissue | Adj P-value | Log2FC | Malignancy |
| 5453 | POU3F1 | P4T-E | Human | Esophagus | ESCC | 1.53e-02 | 1.34e-01 | 0.1323 |
| 5453 | POU3F1 | P5T-E | Human | Esophagus | ESCC | 1.37e-03 | 1.01e-01 | 0.1327 |
| 5453 | POU3F1 | P10T-E | Human | Esophagus | ESCC | 5.43e-34 | 6.87e-01 | 0.116 |
| 5453 | POU3F1 | P11T-E | Human | Esophagus | ESCC | 6.55e-07 | 5.56e-01 | 0.1426 |
| 5453 | POU3F1 | P20T-E | Human | Esophagus | ESCC | 6.32e-06 | 7.91e-02 | 0.1124 |
| 5453 | POU3F1 | P21T-E | Human | Esophagus | ESCC | 4.62e-19 | 4.97e-01 | 0.1617 |
| 5453 | POU3F1 | P22T-E | Human | Esophagus | ESCC | 6.68e-07 | 6.06e-02 | 0.1236 |
| 5453 | POU3F1 | P26T-E | Human | Esophagus | ESCC | 2.11e-02 | 4.61e-02 | 0.1276 |
| 5453 | POU3F1 | P27T-E | Human | Esophagus | ESCC | 1.02e-06 | 2.15e-01 | 0.1055 |
| 5453 | POU3F1 | P37T-E | Human | Esophagus | ESCC | 2.87e-13 | 3.36e-01 | 0.1371 |
| 5453 | POU3F1 | P42T-E | Human | Esophagus | ESCC | 5.14e-03 | 1.40e-01 | 0.1175 |
| 5453 | POU3F1 | P48T-E | Human | Esophagus | ESCC | 1.72e-05 | 1.47e-01 | 0.0959 |
| 5453 | POU3F1 | P52T-E | Human | Esophagus | ESCC | 8.91e-11 | 1.56e-01 | 0.1555 |
| 5453 | POU3F1 | P54T-E | Human | Esophagus | ESCC | 2.85e-11 | 4.76e-01 | 0.0975 |
| 5453 | POU3F1 | P57T-E | Human | Esophagus | ESCC | 1.09e-03 | 9.02e-02 | 0.0926 |
| 5453 | POU3F1 | P61T-E | Human | Esophagus | ESCC | 1.18e-06 | 1.94e-01 | 0.099 |
| 5453 | POU3F1 | P65T-E | Human | Esophagus | ESCC | 3.07e-19 | 5.49e-01 | 0.0978 |
| 5453 | POU3F1 | P75T-E | Human | Esophagus | ESCC | 9.20e-04 | 3.56e-02 | 0.1125 |
| 5453 | POU3F1 | P91T-E | Human | Esophagus | ESCC | 1.84e-07 | 7.49e-01 | 0.1828 |
| 5453 | POU3F1 | P107T-E | Human | Esophagus | ESCC | 3.79e-08 | 3.04e-01 | 0.171 |
| Page: 1 2 3 |
| Tissue | Expression Dynamics | Abbreviation |
| Esophagus |  | ESCC: Esophageal squamous cell carcinoma |
| HGIN: High-grade intraepithelial neoplasias | ||
| LGIN: Low-grade intraepithelial neoplasias | ||
| Oral Cavity |  | EOLP: Erosive Oral lichen planus |
| LP: leukoplakia | ||
| NEOLP: Non-erosive oral lichen planus | ||
| OSCC: Oral squamous cell carcinoma | ||
| Skin | 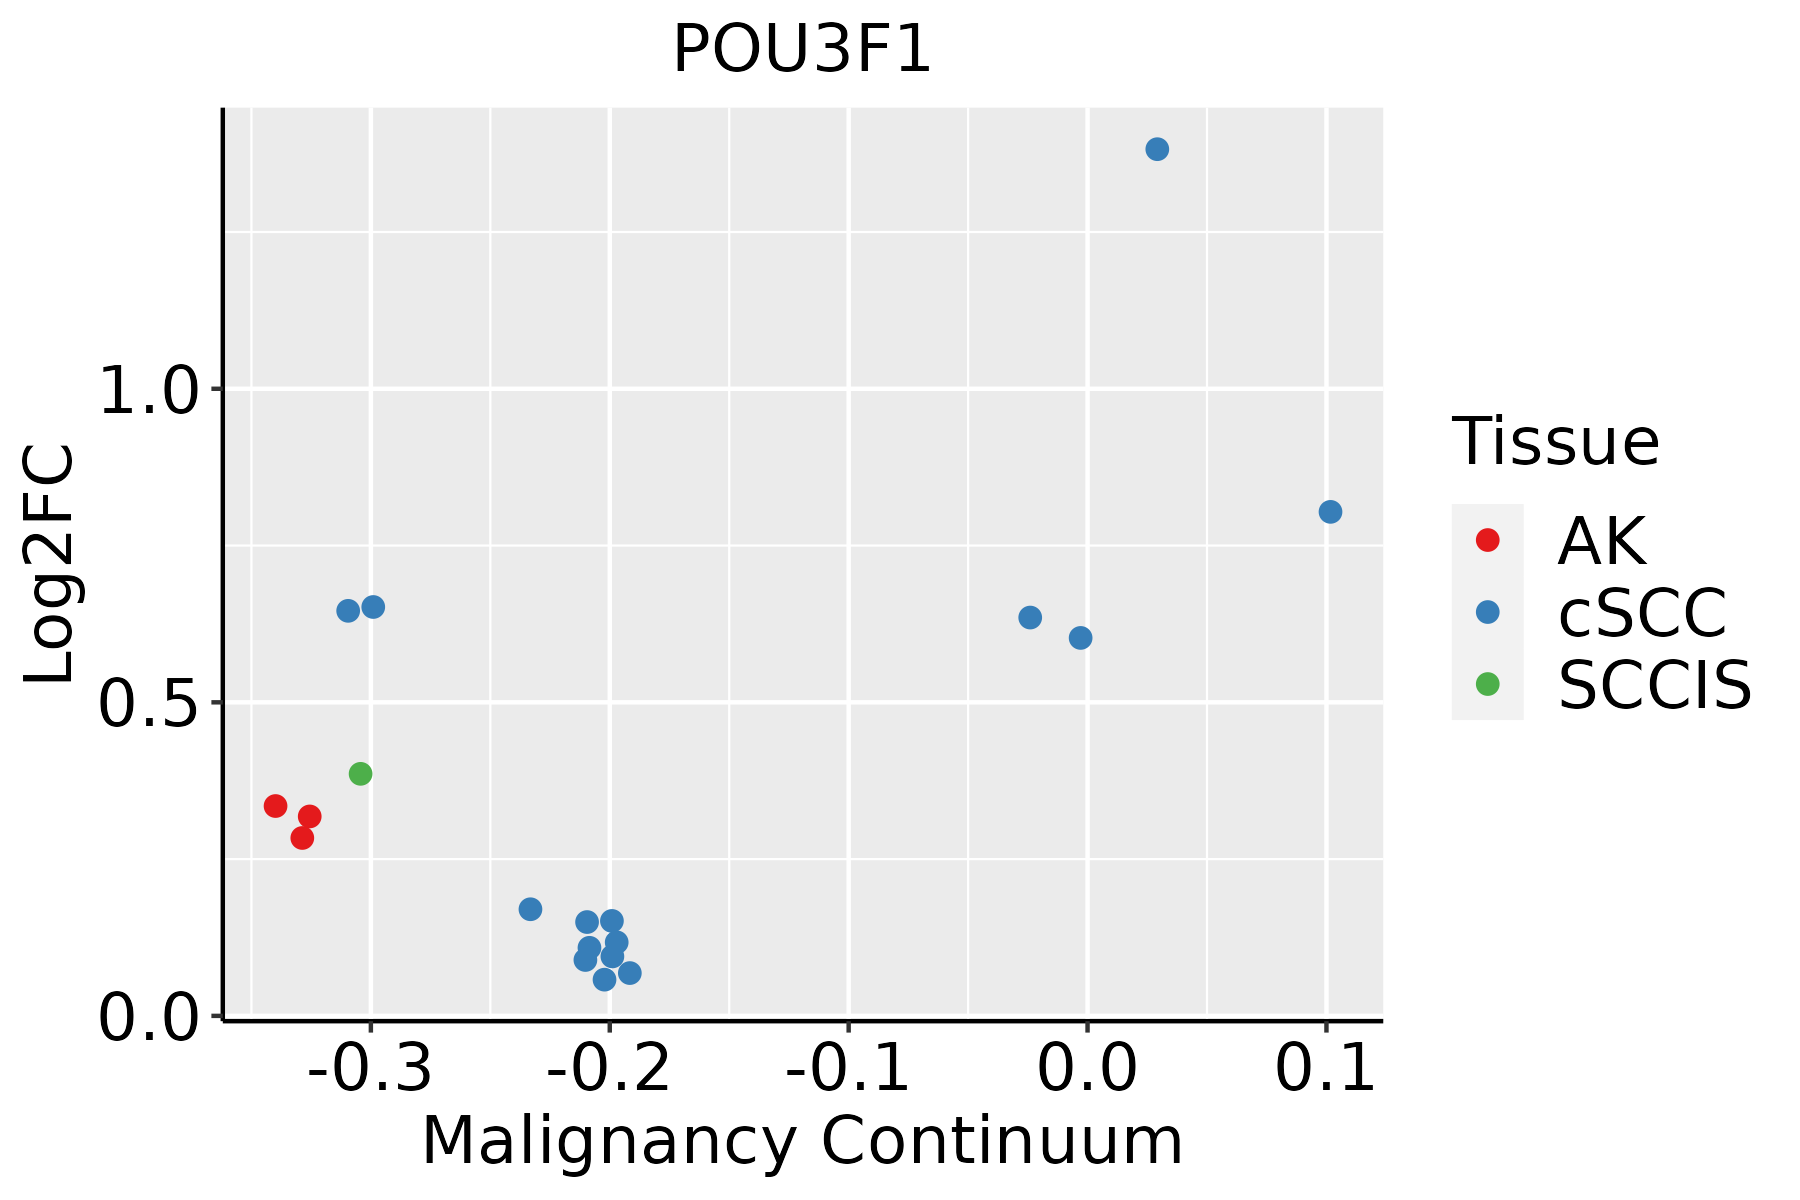 | AK: Actinic keratosis |
| cSCC: Cutaneous squamous cell carcinoma | ||
| SCCIS:squamous cell carcinoma in situ |
| ∗log2FC in expression of this searched gene in stem-like cells from each diseased tissue sample relative to stem-like cells in normal samples in each tissue plotted against the malignancy continuum. Samples are colored based on if they are from different disease stage. |
Top |
Malignant transformation related pathway analysis |
| Find out the enriched GO biological processes and KEGG pathways involved in transition from healthy to precancer to cancer |
| Tissue | Disease Stage | Enriched GO biological Processes |
| Colorectum | AD |  |
| Colorectum | SER |  |
| Colorectum | MSS |  |
| Colorectum | MSI-H |  |
| Colorectum | FAP |  |
| ∗Top 15 enriched GO BP terms are showed in the bar plot of each disease state in each tissue. Each row represents a significant GO biological process which is colored according to the -log10(p.adjust). |
| Page: 1 2 3 4 5 6 7 8 9 |
| GO ID | Tissue | Disease Stage | Description | Gene Ratio | Bg Ratio | pvalue | p.adjust | Count |
| GO:00435888 | Esophagus | ESCC | skin development | 163/8552 | 263/18723 | 6.48e-08 | 1.14e-06 | 163 |
| GO:000854410 | Esophagus | ESCC | epidermis development | 193/8552 | 324/18723 | 2.87e-07 | 4.19e-06 | 193 |
| GO:000991310 | Esophagus | ESCC | epidermal cell differentiation | 122/8552 | 202/18723 | 1.69e-05 | 1.51e-04 | 122 |
| GO:00425524 | Esophagus | ESCC | myelination | 85/8552 | 134/18723 | 2.51e-05 | 2.13e-04 | 85 |
| GO:00072724 | Esophagus | ESCC | ensheathment of neurons | 86/8552 | 136/18723 | 2.68e-05 | 2.24e-04 | 86 |
| GO:00083664 | Esophagus | ESCC | axon ensheathment | 86/8552 | 136/18723 | 2.68e-05 | 2.24e-04 | 86 |
| GO:00420636 | Esophagus | ESCC | gliogenesis | 172/8552 | 301/18723 | 3.75e-05 | 3.04e-04 | 172 |
| GO:00302167 | Esophagus | ESCC | keratinocyte differentiation | 86/8552 | 139/18723 | 8.53e-05 | 6.19e-04 | 86 |
| GO:00100016 | Esophagus | ESCC | glial cell differentiation | 129/8552 | 225/18723 | 2.73e-04 | 1.65e-03 | 129 |
| GO:00140373 | Esophagus | ESCC | Schwann cell differentiation | 28/8552 | 40/18723 | 1.61e-03 | 7.50e-03 | 28 |
| GO:00435887 | Oral cavity | OSCC | skin development | 143/7305 | 263/18723 | 2.77e-07 | 4.27e-06 | 143 |
| GO:00085449 | Oral cavity | OSCC | epidermis development | 171/7305 | 324/18723 | 2.89e-07 | 4.43e-06 | 171 |
| GO:00302166 | Oral cavity | OSCC | keratinocyte differentiation | 81/7305 | 139/18723 | 3.16e-06 | 3.81e-05 | 81 |
| GO:00099139 | Oral cavity | OSCC | epidermal cell differentiation | 109/7305 | 202/18723 | 1.08e-05 | 1.14e-04 | 109 |
| GO:00420635 | Oral cavity | OSCC | gliogenesis | 154/7305 | 301/18723 | 1.10e-05 | 1.14e-04 | 154 |
| GO:00072723 | Oral cavity | OSCC | ensheathment of neurons | 72/7305 | 136/18723 | 6.59e-04 | 3.70e-03 | 72 |
| GO:00083663 | Oral cavity | OSCC | axon ensheathment | 72/7305 | 136/18723 | 6.59e-04 | 3.70e-03 | 72 |
| GO:00425523 | Oral cavity | OSCC | myelination | 71/7305 | 134/18723 | 6.93e-04 | 3.86e-03 | 71 |
| GO:00100015 | Oral cavity | OSCC | glial cell differentiation | 110/7305 | 225/18723 | 1.56e-03 | 7.45e-03 | 110 |
| GO:00140372 | Oral cavity | OSCC | Schwann cell differentiation | 25/7305 | 40/18723 | 2.22e-03 | 1.00e-02 | 25 |
| Page: 1 2 3 4 |
| Pathway ID | Tissue | Disease Stage | Description | Gene Ratio | Bg Ratio | pvalue | p.adjust | qvalue | Count |
| Page: 1 |
Top |
Cell-cell communication analysis |
| Identification of potential cell-cell interactions between two cell types and their ligand-receptor pairs for different disease states |
| Ligand | Receptor | LRpair | Pathway | Tissue | Disease Stage |
| Page: 1 |
Top |
Single-cell gene regulatory network inference analysis |
| Find out the significant the regulons (TFs) and the target genes of each regulon across cell types for different disease states |
| TF | Cell Type | Tissue | Disease Stage | Target Gene | RSS | Regulon Activity |
| POU3F1 | CD8TRM | Breast | Healthy | MTRNR2L8,IER5L,MAF, etc. | 3.97e-01 |  |
| POU3F1 | CD8TRM | Breast | Precancer | MTRNR2L8,IER5L,MAF, etc. | 5.16e-02 |  |
| POU3F1 | MYOFIB | Prostate | BPH | PNMT,C1QL1,RNF112, etc. | 4.40e-01 |  |
| POU3F1 | ICAF | Prostate | Healthy | PNMT,C1QL1,RNF112, etc. | 3.81e-01 |  |
| ∗The dot plots of a searched regulon are shown for all cell subpopulations in each disease state of each tissue based on the regulon specific score inferred using pySCENIC and by calculating the average expression. |
| Page: 1 |
Top |
Somatic mutation of malignant transformation related genes |
| Annotation of somatic variants for genes involved in malignant transformation |
| Hugo Symbol | Variant Class | Variant Classification | dbSNP RS | HGVSc | HGVSp | HGVSp Short | SWISSPROT | BIOTYPE | SIFT | PolyPhen | Tumor Sample Barcode | Tissue | Histology | Sex | Age | Stage | Therapy Types | Drugs | Outcome |
| POU3F1 | SNV | Missense_Mutation | novel | c.1057N>T | p.Ala353Ser | p.A353S | Q03052 | protein_coding | deleterious(0.02) | possibly_damaging(0.868) | TCGA-BH-A0HP-01 | Breast | breast invasive carcinoma | Female | >=65 | III/IV | Chemotherapy | doxorubicin | SD |
| POU3F1 | SNV | Missense_Mutation | c.760N>A | p.Asp254Asn | p.D254N | Q03052 | protein_coding | deleterious(0.01) | probably_damaging(0.968) | TCGA-DS-A0VM-01 | Cervix | cervical & endocervical cancer | Female | <65 | I/II | Chemotherapy | cisplatin | PD | |
| POU3F1 | SNV | Missense_Mutation | c.1012N>T | p.Arg338Cys | p.R338C | Q03052 | protein_coding | deleterious(0) | probably_damaging(0.981) | TCGA-A6-6653-01 | Colorectum | colon adenocarcinoma | Male | >=65 | I/II | Unknown | Unknown | SD | |
| POU3F1 | SNV | Missense_Mutation | c.796C>T | p.Arg266Cys | p.R266C | Q03052 | protein_coding | deleterious(0) | probably_damaging(1) | TCGA-AD-5900-01 | Colorectum | colon adenocarcinoma | Male | >=65 | I/II | Unknown | Unknown | SD | |
| POU3F1 | SNV | Missense_Mutation | rs762115043 | c.953A>G | p.Glu318Gly | p.E318G | Q03052 | protein_coding | deleterious(0) | possibly_damaging(0.886) | TCGA-D5-5539-01 | Colorectum | colon adenocarcinoma | Male | <65 | III/IV | Chemotherapy | 5-fu | PD |
| POU3F1 | SNV | Missense_Mutation | novel | c.1235N>G | p.Tyr412Cys | p.Y412C | Q03052 | protein_coding | deleterious(0.01) | probably_damaging(0.987) | TCGA-BG-A222-01 | Endometrium | uterine corpus endometrioid carcinoma | Female | <65 | I/II | Unknown | Unknown | SD |
| POU3F1 | SNV | Missense_Mutation | rs750586749 | c.941N>G | p.Asn314Ser | p.N314S | Q03052 | protein_coding | deleterious(0.02) | benign(0.127) | TCGA-D1-A103-01 | Endometrium | uterine corpus endometrioid carcinoma | Female | >=65 | I/II | Unknown | Unknown | SD |
| POU3F1 | SNV | Missense_Mutation | novel | c.1135N>A | p.Glu379Lys | p.E379K | Q03052 | protein_coding | deleterious(0.01) | probably_damaging(0.922) | TCGA-EY-A1GX-01 | Endometrium | uterine corpus endometrioid carcinoma | Female | >=65 | III/IV | Unknown | Unknown | PD |
| POU3F1 | SNV | Missense_Mutation | novel | c.1122C>A | p.Asp374Glu | p.D374E | Q03052 | protein_coding | tolerated(0.24) | benign(0.019) | TCGA-78-8662-01 | Lung | lung adenocarcinoma | Female | <65 | I/II | Unknown | Unknown | PD |
| POU3F1 | SNV | Missense_Mutation | novel | c.1052N>C | p.Lys351Thr | p.K351T | Q03052 | protein_coding | deleterious(0) | probably_damaging(0.987) | TCGA-98-A538-01 | Lung | lung squamous cell carcinoma | Male | >=65 | I/II | Unknown | Unknown | SD |
| Page: 1 2 |
Top |
Related drugs of malignant transformation related genes |
| Identification of chemicals and drugs interact with genes involved in malignant transfromation |
| (DGIdb 4.0) |
| Entrez ID | Symbol | Category | Interaction Types | Drug Claim Name | Drug Name | PMIDs |
| Page: 1 |

Copyright 2023-Present -The University of Texas Health Science Center at Houston |