
|
|||||
|
 | |
| |
| |
| |
| |
| |
|
Gene: POSTN |
Gene summary for POSTN |
| Gene information | Species | Human | Gene symbol | POSTN | Gene ID | 10631 |
| Gene name | periostin | |
| Gene Alias | OSF-2 | |
| Cytomap | 13q13.3 | |
| Gene Type | protein-coding | GO ID | GO:0000902 | UniProtAcc | A0A024RDT5 |
Top |
Malignant transformation analysis |
| Identification of the aberrant gene expression in precancerous and cancerous lesions by comparing the gene expression of stem-like cells in diseased tissues with normal stem cells |
| Entrez ID | Symbol | Replicates | Species | Organ | Tissue | Adj P-value | Log2FC | Malignancy |
| 10631 | POSTN | CA_HPV_3 | Human | Cervix | CC | 3.60e-12 | 2.02e-01 | 0.0414 |
| 10631 | POSTN | P4T-E | Human | Esophagus | ESCC | 3.23e-12 | 2.22e+00 | 0.1323 |
| 10631 | POSTN | P5T-E | Human | Esophagus | ESCC | 3.09e-03 | 1.97e+00 | 0.1327 |
| 10631 | POSTN | P10T-E | Human | Esophagus | ESCC | 7.31e-05 | 1.41e+00 | 0.116 |
| 10631 | POSTN | P42T-E | Human | Esophagus | ESCC | 3.67e-04 | 1.61e+00 | 0.1175 |
| 10631 | POSTN | P44T-E | Human | Esophagus | ESCC | 1.60e-09 | 2.56e+00 | 0.1096 |
| 10631 | POSTN | P47T-E | Human | Esophagus | ESCC | 6.86e-06 | 1.90e+00 | 0.1067 |
| 10631 | POSTN | C21 | Human | Oral cavity | OSCC | 2.95e-08 | 1.57e-01 | 0.2678 |
| 10631 | POSTN | C30 | Human | Oral cavity | OSCC | 2.28e-08 | 3.54e-01 | 0.3055 |
| 10631 | POSTN | C51 | Human | Oral cavity | OSCC | 1.87e-18 | 9.19e-01 | 0.2674 |
| 10631 | POSTN | LN38 | Human | Oral cavity | OSCC | 1.95e-02 | 7.03e-01 | 0.168 |
| 10631 | POSTN | P4_S8_cSCC | Human | Skin | cSCC | 3.80e-10 | 4.61e-01 | -0.3095 |
| 10631 | POSTN | P5_S10_cSCC | Human | Skin | cSCC | 3.45e-12 | -4.67e-01 | -0.299 |
| 10631 | POSTN | P1_cSCC | Human | Skin | cSCC | 2.83e-02 | -3.99e-01 | 0.0292 |
| 10631 | POSTN | P4_cSCC | Human | Skin | cSCC | 5.92e-03 | -3.44e-01 | -0.00290000000000005 |
| 10631 | POSTN | P10_cSCC | Human | Skin | cSCC | 1.22e-04 | -4.00e-01 | 0.1017 |
| 10631 | POSTN | cSCC_p1 | Human | Skin | cSCC | 1.61e-29 | 8.34e-01 | -0.1916 |
| 10631 | POSTN | cSCC_p11 | Human | Skin | cSCC | 9.18e-40 | 8.17e-01 | -0.2102 |
| 10631 | POSTN | cSCC_p3 | Human | Skin | cSCC | 8.52e-05 | -4.08e-01 | -0.2085 |
| 10631 | POSTN | cSCC_p4 | Human | Skin | cSCC | 3.45e-07 | 1.95e-01 | -0.2022 |
| Page: 1 2 |
| Tissue | Expression Dynamics | Abbreviation |
| Cervix |  | CC: Cervix cancer |
| HSIL_HPV: HPV-infected high-grade squamous intraepithelial lesions | ||
| N_HPV: HPV-infected normal cervix | ||
| Esophagus |  | ESCC: Esophageal squamous cell carcinoma |
| HGIN: High-grade intraepithelial neoplasias | ||
| LGIN: Low-grade intraepithelial neoplasias | ||
| Oral Cavity | 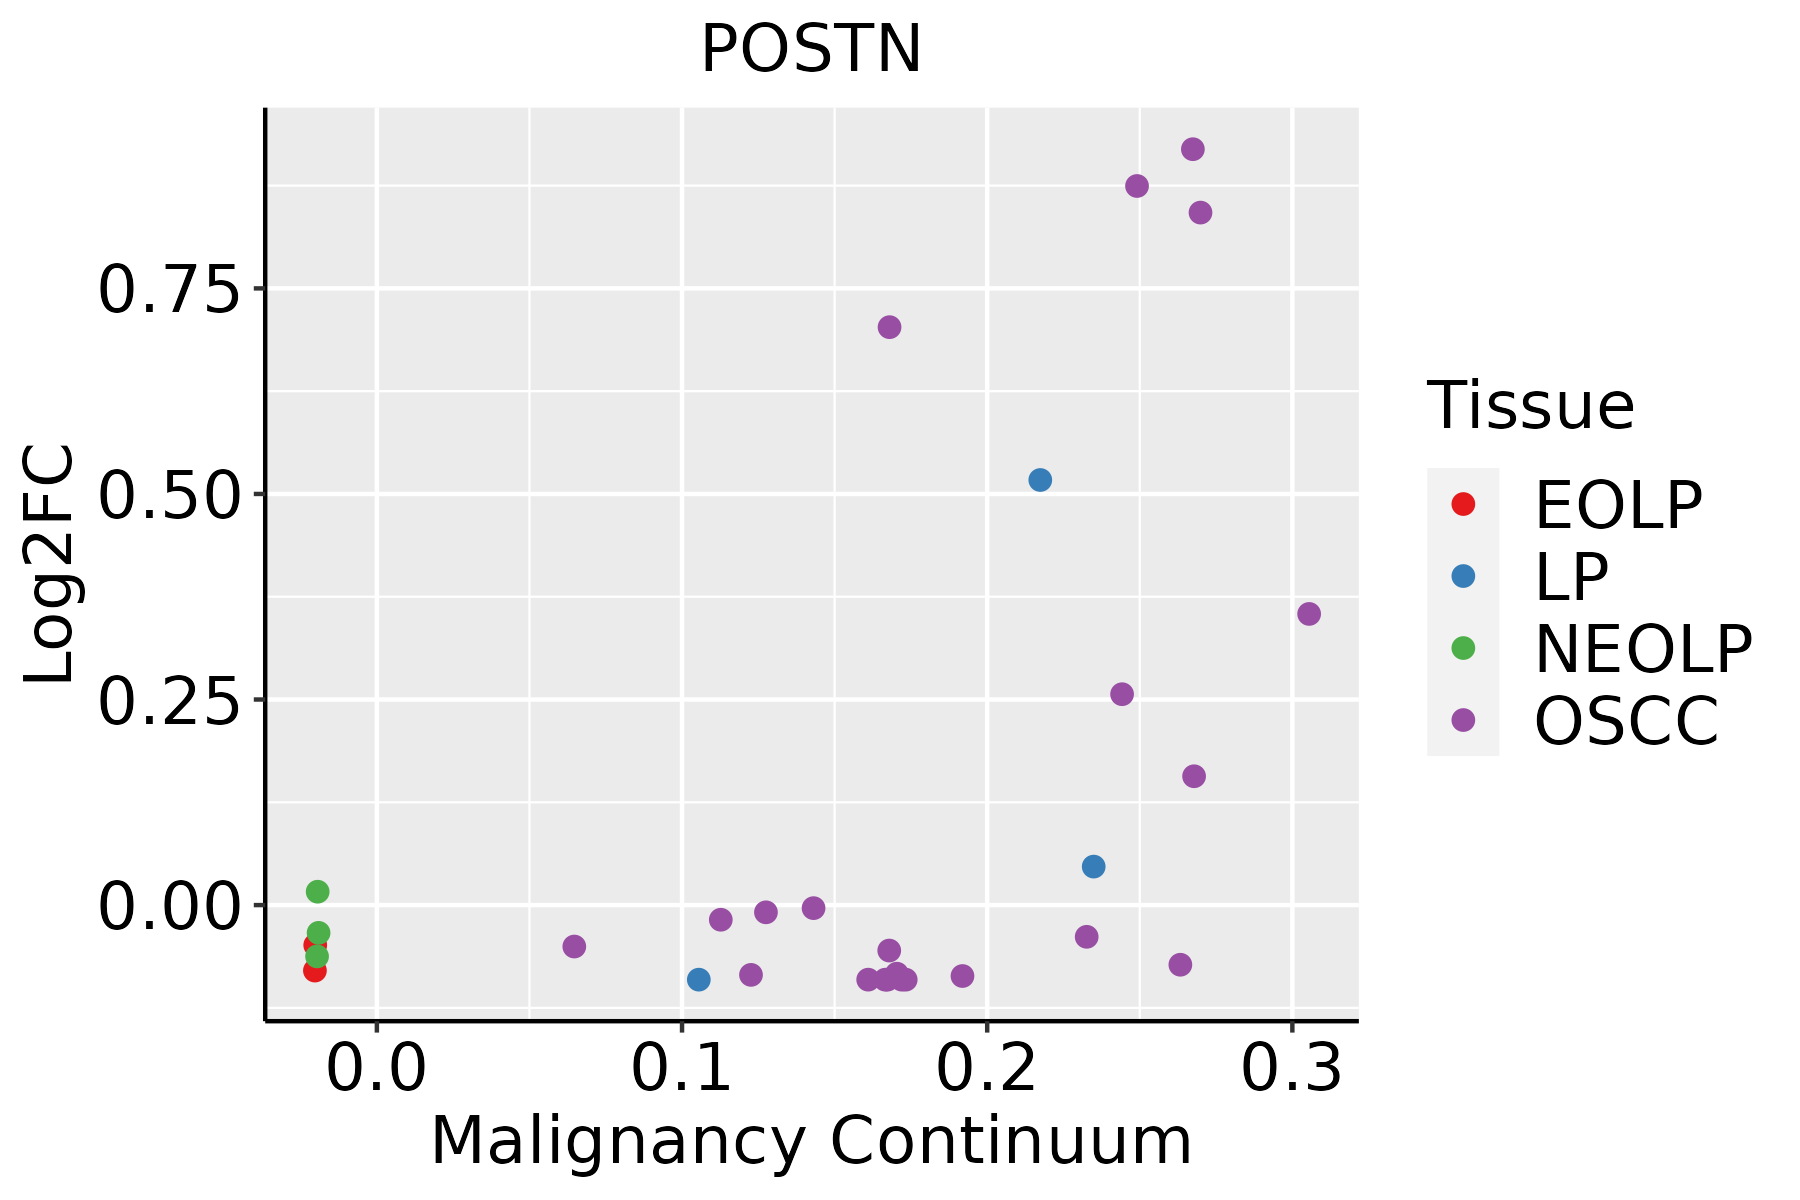 | EOLP: Erosive Oral lichen planus |
| LP: leukoplakia | ||
| NEOLP: Non-erosive oral lichen planus | ||
| OSCC: Oral squamous cell carcinoma | ||
| Skin | 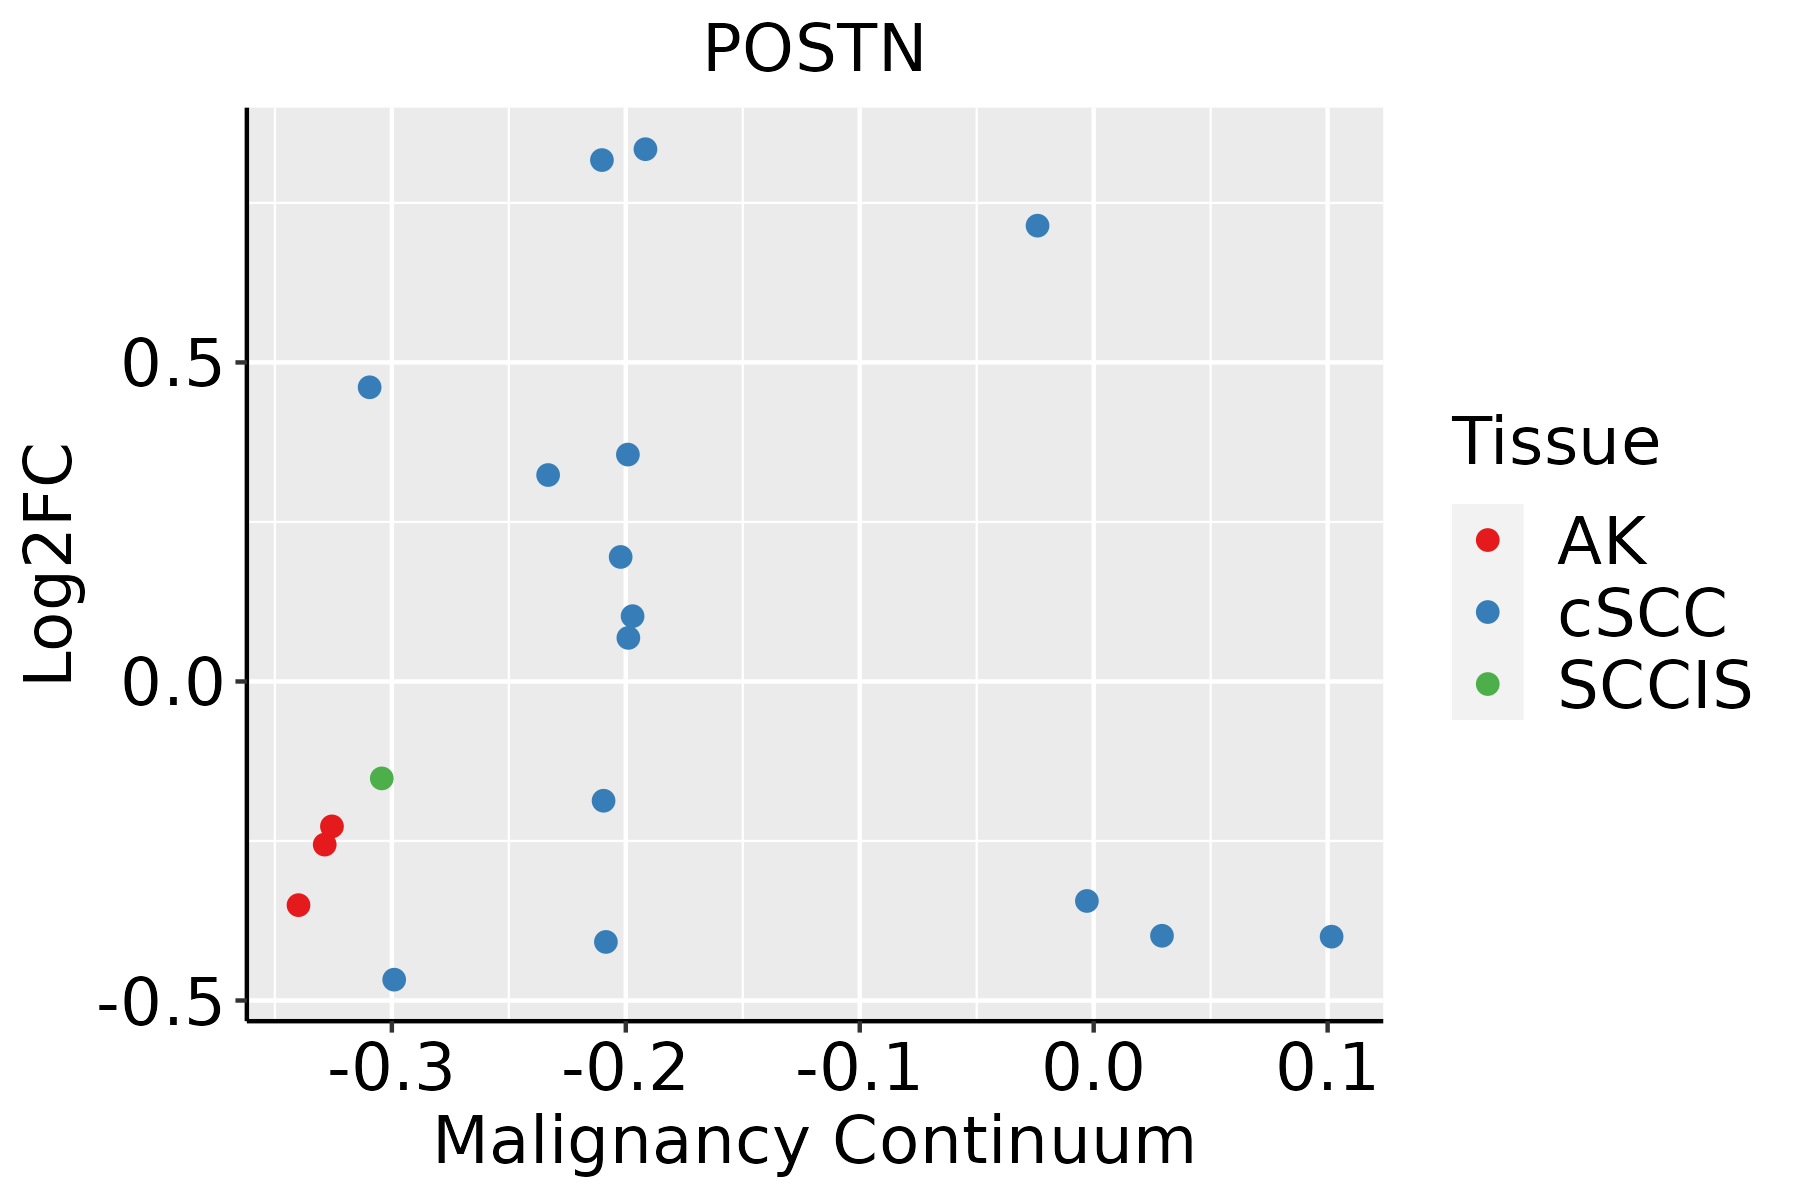 | AK: Actinic keratosis |
| cSCC: Cutaneous squamous cell carcinoma | ||
| SCCIS:squamous cell carcinoma in situ | ||
| Thyroid | 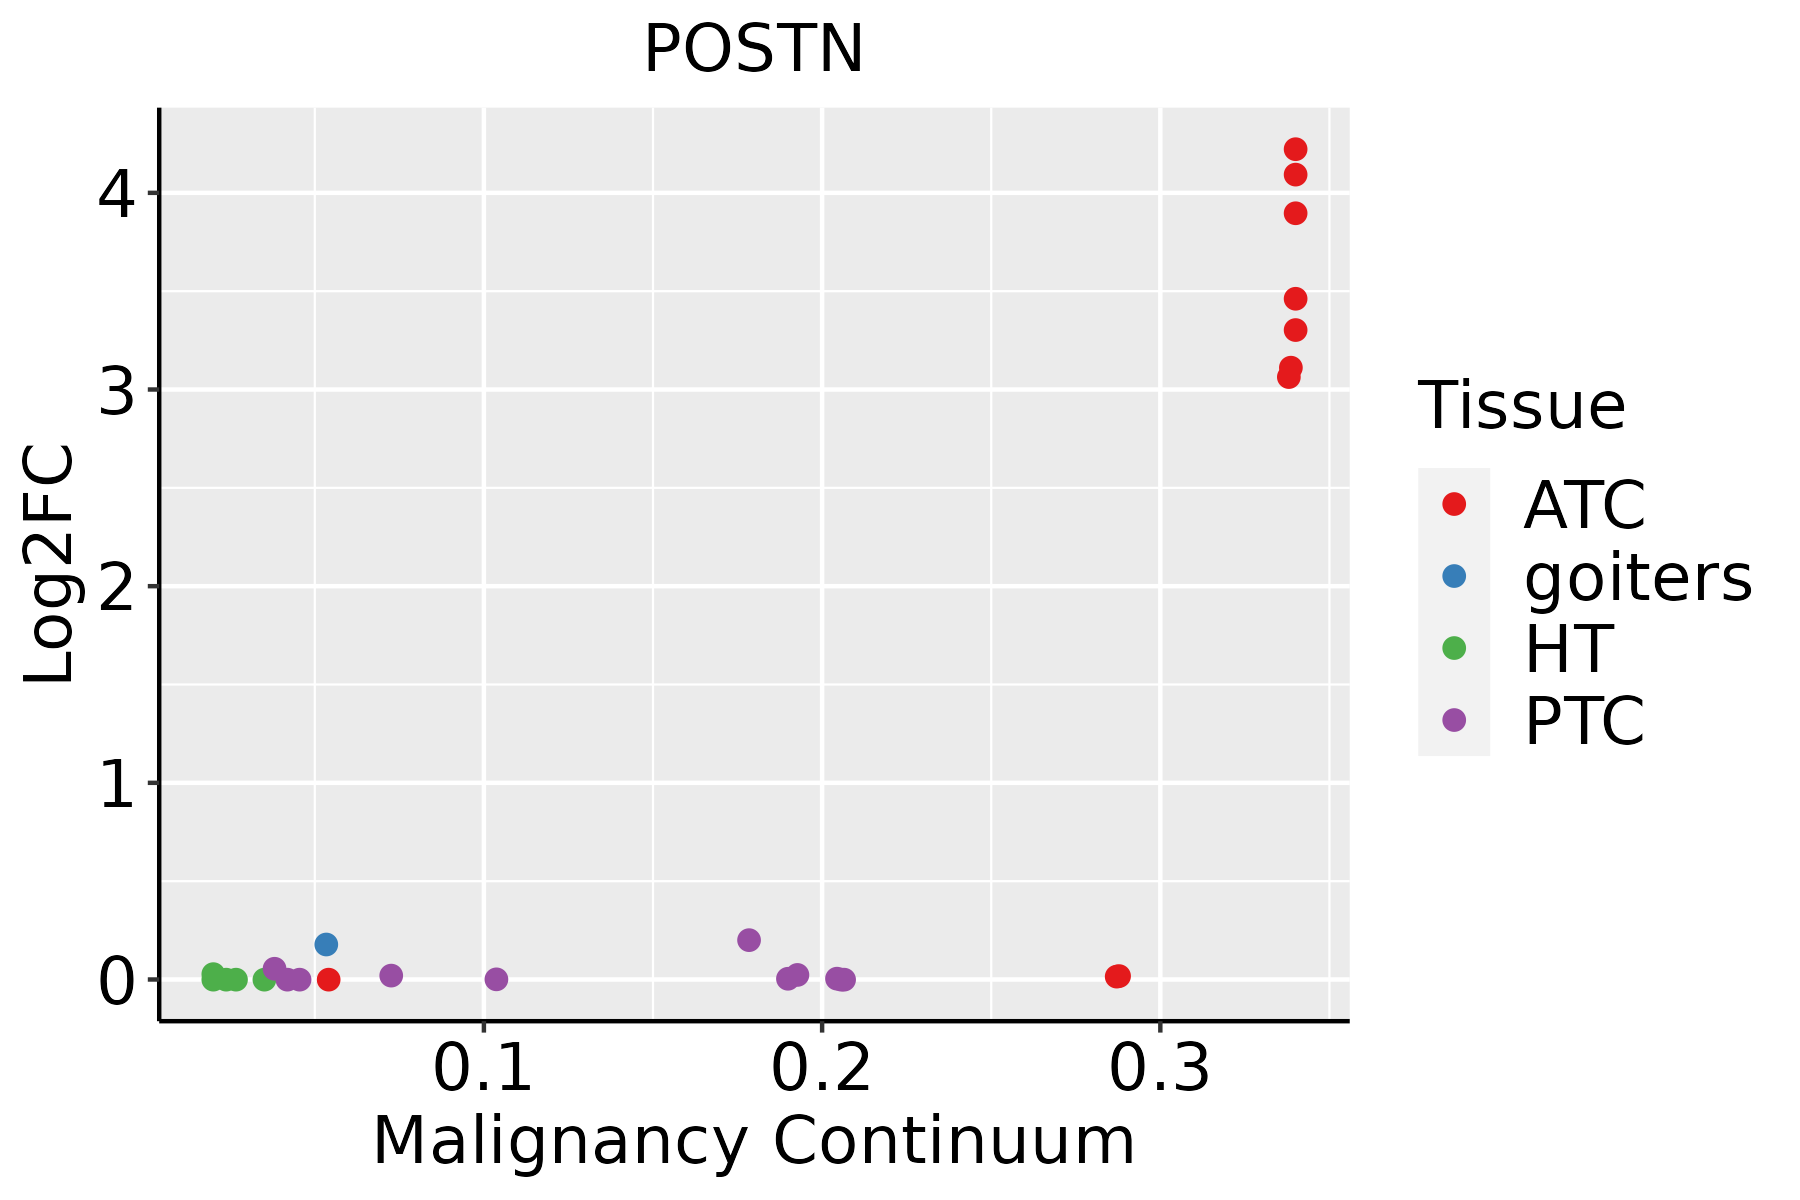 | ATC: Anaplastic thyroid cancer |
| HT: Hashimoto's thyroiditis | ||
| PTC: Papillary thyroid cancer |
| ∗log2FC in expression of this searched gene in stem-like cells from each diseased tissue sample relative to stem-like cells in normal samples in each tissue plotted against the malignancy continuum. Samples are colored based on if they are from different disease stage. |
Top |
Malignant transformation related pathway analysis |
| Find out the enriched GO biological processes and KEGG pathways involved in transition from healthy to precancer to cancer |
| Tissue | Disease Stage | Enriched GO biological Processes |
| Colorectum | AD |  |
| Colorectum | SER |  |
| Colorectum | MSS |  |
| Colorectum | MSI-H |  |
| Colorectum | FAP |  |
| ∗Top 15 enriched GO BP terms are showed in the bar plot of each disease state in each tissue. Each row represents a significant GO biological process which is colored according to the -log10(p.adjust). |
| Page: 1 2 3 4 5 6 7 8 9 |
| GO ID | Tissue | Disease Stage | Description | Gene Ratio | Bg Ratio | pvalue | p.adjust | Count |
| GO:004206010 | Cervix | CC | wound healing | 109/2311 | 422/18723 | 1.84e-14 | 1.57e-11 | 109 |
| GO:001081010 | Cervix | CC | regulation of cell-substrate adhesion | 69/2311 | 221/18723 | 8.57e-14 | 5.69e-11 | 69 |
| GO:00315898 | Cervix | CC | cell-substrate adhesion | 96/2311 | 363/18723 | 1.48e-13 | 8.85e-11 | 96 |
| GO:002260410 | Cervix | CC | regulation of cell morphogenesis | 84/2311 | 309/18723 | 1.00e-12 | 4.29e-10 | 84 |
| GO:007149610 | Cervix | CC | cellular response to external stimulus | 78/2311 | 320/18723 | 1.82e-09 | 1.98e-07 | 78 |
| GO:00019528 | Cervix | CC | regulation of cell-matrix adhesion | 40/2311 | 128/18723 | 1.32e-08 | 1.04e-06 | 40 |
| GO:00071608 | Cervix | CC | cell-matrix adhesion | 60/2311 | 233/18723 | 1.58e-08 | 1.23e-06 | 60 |
| GO:00071626 | Cervix | CC | negative regulation of cell adhesion | 72/2311 | 303/18723 | 2.36e-08 | 1.70e-06 | 72 |
| GO:19000249 | Cervix | CC | regulation of substrate adhesion-dependent cell spreading | 23/2311 | 57/18723 | 8.94e-08 | 5.04e-06 | 23 |
| GO:00107699 | Cervix | CC | regulation of cell morphogenesis involved in differentiation | 31/2311 | 96/18723 | 2.43e-07 | 1.05e-05 | 31 |
| GO:00316689 | Cervix | CC | cellular response to extracellular stimulus | 59/2311 | 246/18723 | 3.03e-07 | 1.24e-05 | 59 |
| GO:00018197 | Cervix | CC | positive regulation of cytokine production | 95/2311 | 467/18723 | 4.88e-07 | 1.85e-05 | 95 |
| GO:00344469 | Cervix | CC | substrate adhesion-dependent cell spreading | 32/2311 | 108/18723 | 1.36e-06 | 4.55e-05 | 32 |
| GO:003166710 | Cervix | CC | response to nutrient levels | 92/2311 | 474/18723 | 5.80e-06 | 1.42e-04 | 92 |
| GO:00160498 | Cervix | CC | cell growth | 92/2311 | 482/18723 | 1.16e-05 | 2.49e-04 | 92 |
| GO:00316698 | Cervix | CC | cellular response to nutrient levels | 49/2311 | 215/18723 | 1.32e-05 | 2.68e-04 | 49 |
| GO:00310996 | Cervix | CC | regeneration | 46/2311 | 198/18723 | 1.43e-05 | 2.84e-04 | 46 |
| GO:00346129 | Cervix | CC | response to tumor necrosis factor | 55/2311 | 253/18723 | 1.75e-05 | 3.32e-04 | 55 |
| GO:00713569 | Cervix | CC | cellular response to tumor necrosis factor | 51/2311 | 229/18723 | 1.75e-05 | 3.32e-04 | 51 |
| GO:190165410 | Cervix | CC | response to ketone | 45/2311 | 194/18723 | 1.83e-05 | 3.44e-04 | 45 |
| Page: 1 2 3 4 5 6 7 8 9 10 11 |
| Pathway ID | Tissue | Disease Stage | Description | Gene Ratio | Bg Ratio | pvalue | p.adjust | qvalue | Count |
| Page: 1 |
Top |
Cell-cell communication analysis |
| Identification of potential cell-cell interactions between two cell types and their ligand-receptor pairs for different disease states |
| Ligand | Receptor | LRpair | Pathway | Tissue | Disease Stage |
| POSTN | ITGAV_ITGB5 | POSTN_ITGAV_ITGB5 | PERIOSTIN | Breast | DCIS |
| POSTN | ITGAV_ITGB5 | POSTN_ITGAV_ITGB5 | PERIOSTIN | Breast | IDC |
| POSTN | ITGAV_ITGB5 | POSTN_ITGAV_ITGB5 | PERIOSTIN | Endometrium | Healthy |
| POSTN | ITGAV_ITGB5 | POSTN_ITGAV_ITGB5 | PERIOSTIN | Esophagus | ESCC |
| POSTN | ITGAV_ITGB5 | POSTN_ITGAV_ITGB5 | PERIOSTIN | HNSCC | Healthy |
| POSTN | ITGAV_ITGB5 | POSTN_ITGAV_ITGB5 | PERIOSTIN | HNSCC | OSCC |
| POSTN | ITGAV_ITGB5 | POSTN_ITGAV_ITGB5 | PERIOSTIN | HNSCC | Precancer |
| POSTN | ITGAV_ITGB5 | POSTN_ITGAV_ITGB5 | PERIOSTIN | Lung | IAC |
| POSTN | ITGAV_ITGB5 | POSTN_ITGAV_ITGB5 | PERIOSTIN | Prostate | Tumor |
| POSTN | ITGAV_ITGB5 | POSTN_ITGAV_ITGB5 | PERIOSTIN | Skin | ADJ |
| POSTN | ITGAV_ITGB5 | POSTN_ITGAV_ITGB5 | PERIOSTIN | Skin | AK |
| POSTN | ITGAV_ITGB5 | POSTN_ITGAV_ITGB5 | PERIOSTIN | Skin | cSCC |
| POSTN | ITGAV_ITGB5 | POSTN_ITGAV_ITGB5 | PERIOSTIN | Skin | SCCIS |
| POSTN | ITGAV_ITGB5 | POSTN_ITGAV_ITGB5 | PERIOSTIN | THCA | Cancer |
| POSTN | ITGAV_ITGB5 | POSTN_ITGAV_ITGB5 | PERIOSTIN | THCA | Precancer |
| POSTN | ITGAV_ITGB5 | POSTN_ITGAV_ITGB5 | PERIOSTIN | THCA | PTC |
| Page: 1 |
Top |
Single-cell gene regulatory network inference analysis |
| Find out the significant the regulons (TFs) and the target genes of each regulon across cell types for different disease states |
| TF | Cell Type | Tissue | Disease Stage | Target Gene | RSS | Regulon Activity |
| ∗The dot plots of a searched regulon are shown for all cell subpopulations in each disease state of each tissue based on the regulon specific score inferred using pySCENIC and by calculating the average expression. |
| Page: 1 |
Top |
Somatic mutation of malignant transformation related genes |
| Annotation of somatic variants for genes involved in malignant transformation |
| Hugo Symbol | Variant Class | Variant Classification | dbSNP RS | HGVSc | HGVSp | HGVSp Short | SWISSPROT | BIOTYPE | SIFT | PolyPhen | Tumor Sample Barcode | Tissue | Histology | Sex | Age | Stage | Therapy Types | Drugs | Outcome |
| POSTN | SNV | Missense_Mutation | novel | c.2133N>G | p.Phe711Leu | p.F711L | Q15063 | protein_coding | tolerated_low_confidence(0.21) | benign(0) | TCGA-5L-AAT0-01 | Breast | breast invasive carcinoma | Female | <65 | I/II | Hormone Therapy | tamoxiphen | SD |
| POSTN | SNV | Missense_Mutation | c.1133N>A | p.Gly378Glu | p.G378E | Q15063 | protein_coding | tolerated(0.25) | benign(0.39) | TCGA-A2-A0YH-01 | Breast | breast invasive carcinoma | Female | <65 | III/IV | Chemotherapy | adriamycin | SD | |
| POSTN | SNV | Missense_Mutation | rs753646323 | c.937G>A | p.Glu313Lys | p.E313K | Q15063 | protein_coding | deleterious(0.03) | probably_damaging(0.999) | TCGA-A2-A0YK-01 | Breast | breast invasive carcinoma | Female | <65 | I/II | Chemotherapy | cytoxan | SD |
| POSTN | SNV | Missense_Mutation | c.213N>T | p.Gln71His | p.Q71H | Q15063 | protein_coding | deleterious(0) | benign(0.139) | TCGA-AN-A0AL-01 | Breast | breast invasive carcinoma | Female | <65 | III/IV | Unknown | Unknown | SD | |
| POSTN | SNV | Missense_Mutation | c.46G>A | p.Val16Ile | p.V16I | Q15063 | protein_coding | tolerated(0.42) | benign(0.003) | TCGA-AO-A12F-01 | Breast | breast invasive carcinoma | Female | <65 | I/II | Chemotherapy | paclitaxel | SD | |
| POSTN | SNV | Missense_Mutation | rs767315975 | c.1447G>A | p.Gly483Ser | p.G483S | Q15063 | protein_coding | deleterious(0.04) | possibly_damaging(0.832) | TCGA-BH-A1FR-01 | Breast | breast invasive carcinoma | Female | >=65 | III/IV | Unknown | Unknown | PD |
| POSTN | SNV | Missense_Mutation | novel | c.373N>A | p.Glu125Lys | p.E125K | Q15063 | protein_coding | deleterious(0.04) | possibly_damaging(0.585) | TCGA-C8-A3M7-01 | Breast | breast invasive carcinoma | Female | <65 | III/IV | Unknown | Unknown | PD |
| POSTN | insertion | Frame_Shift_Ins | novel | c.2466dupA | p.Val823SerfsTer5 | p.V823Sfs*5 | Q15063 | protein_coding | TCGA-AN-A0AK-01 | Breast | breast invasive carcinoma | Female | >=65 | I/II | Unknown | Unknown | SD | ||
| POSTN | deletion | Frame_Shift_Del | novel | c.970delC | p.Leu324TrpfsTer8 | p.L324Wfs*8 | Q15063 | protein_coding | TCGA-B6-A0RS-01 | Breast | breast invasive carcinoma | Female | <65 | I/II | Unknown | Unknown | PD | ||
| POSTN | deletion | Frame_Shift_Del | novel | c.1455delT | p.His486ThrfsTer18 | p.H486Tfs*18 | Q15063 | protein_coding | TCGA-D8-A27V-01 | Breast | breast invasive carcinoma | Female | <65 | I/II | Hormone Therapy | tamoxiphen | SD |
| Page: 1 2 3 4 5 6 7 8 9 10 11 12 13 14 15 16 17 18 |
Top |
Related drugs of malignant transformation related genes |
| Identification of chemicals and drugs interact with genes involved in malignant transfromation |
| (DGIdb 4.0) |
| Entrez ID | Symbol | Category | Interaction Types | Drug Claim Name | Drug Name | PMIDs |
| 10631 | POSTN | DRUGGABLE GENOME | ANTISERUM | 10404027 |
| Page: 1 |

Copyright 2023-Present -The University of Texas Health Science Center at Houston |