
|
|||||
|
 | |
| |
| |
| |
| |
| |
|
Gene: POP7 |
Gene summary for POP7 |
| Gene information | Species | Human | Gene symbol | POP7 | Gene ID | 10248 |
| Gene name | POP7 homolog, ribonuclease P/MRP subunit | |
| Gene Alias | 0610037N12Rik | |
| Cytomap | 7q22.1 | |
| Gene Type | protein-coding | GO ID | GO:0000966 | UniProtAcc | O75817 |
Top |
Malignant transformation analysis |
| Identification of the aberrant gene expression in precancerous and cancerous lesions by comparing the gene expression of stem-like cells in diseased tissues with normal stem cells |
| Entrez ID | Symbol | Replicates | Species | Organ | Tissue | Adj P-value | Log2FC | Malignancy |
| 10248 | POP7 | GSM4909282 | Human | Breast | IDC | 4.06e-07 | 3.54e-01 | -0.0288 |
| 10248 | POP7 | GSM4909286 | Human | Breast | IDC | 8.42e-06 | 3.54e-01 | 0.1081 |
| 10248 | POP7 | GSM4909296 | Human | Breast | IDC | 9.07e-06 | 1.97e-01 | 0.1524 |
| 10248 | POP7 | GSM4909297 | Human | Breast | IDC | 5.00e-04 | -6.69e-02 | 0.1517 |
| 10248 | POP7 | GSM4909304 | Human | Breast | IDC | 7.56e-05 | 2.92e-01 | 0.1636 |
| 10248 | POP7 | GSM4909306 | Human | Breast | IDC | 2.27e-03 | 3.07e-01 | 0.1564 |
| 10248 | POP7 | GSM4909308 | Human | Breast | IDC | 3.88e-02 | 2.63e-01 | 0.158 |
| 10248 | POP7 | GSM4909311 | Human | Breast | IDC | 1.95e-16 | -3.35e-02 | 0.1534 |
| 10248 | POP7 | GSM4909312 | Human | Breast | IDC | 1.31e-04 | 1.41e-01 | 0.1552 |
| 10248 | POP7 | GSM4909315 | Human | Breast | IDC | 5.44e-25 | 7.37e-01 | 0.21 |
| 10248 | POP7 | GSM4909316 | Human | Breast | IDC | 7.19e-16 | 8.08e-01 | 0.21 |
| 10248 | POP7 | GSM4909317 | Human | Breast | IDC | 6.98e-06 | 3.22e-01 | 0.1355 |
| 10248 | POP7 | GSM4909319 | Human | Breast | IDC | 1.18e-21 | 1.98e-02 | 0.1563 |
| 10248 | POP7 | GSM4909321 | Human | Breast | IDC | 1.03e-08 | 4.98e-02 | 0.1559 |
| 10248 | POP7 | brca1 | Human | Breast | Precancer | 7.98e-03 | 2.79e-01 | -0.0338 |
| 10248 | POP7 | P1 | Human | Breast | IDC | 8.67e-04 | -1.15e-01 | 0.1527 |
| 10248 | POP7 | DCIS2 | Human | Breast | DCIS | 9.62e-38 | 1.89e-02 | 0.0085 |
| 10248 | POP7 | HTA11_3410_2000001011 | Human | Colorectum | AD | 9.76e-04 | 1.33e-01 | 0.0155 |
| 10248 | POP7 | HTA11_2487_2000001011 | Human | Colorectum | SER | 3.67e-03 | 2.14e-01 | -0.1808 |
| 10248 | POP7 | HTA11_1938_2000001011 | Human | Colorectum | AD | 5.30e-11 | 3.51e-01 | -0.0811 |
| Page: 1 2 3 4 5 6 7 8 9 |
| Tissue | Expression Dynamics | Abbreviation |
| Breast | 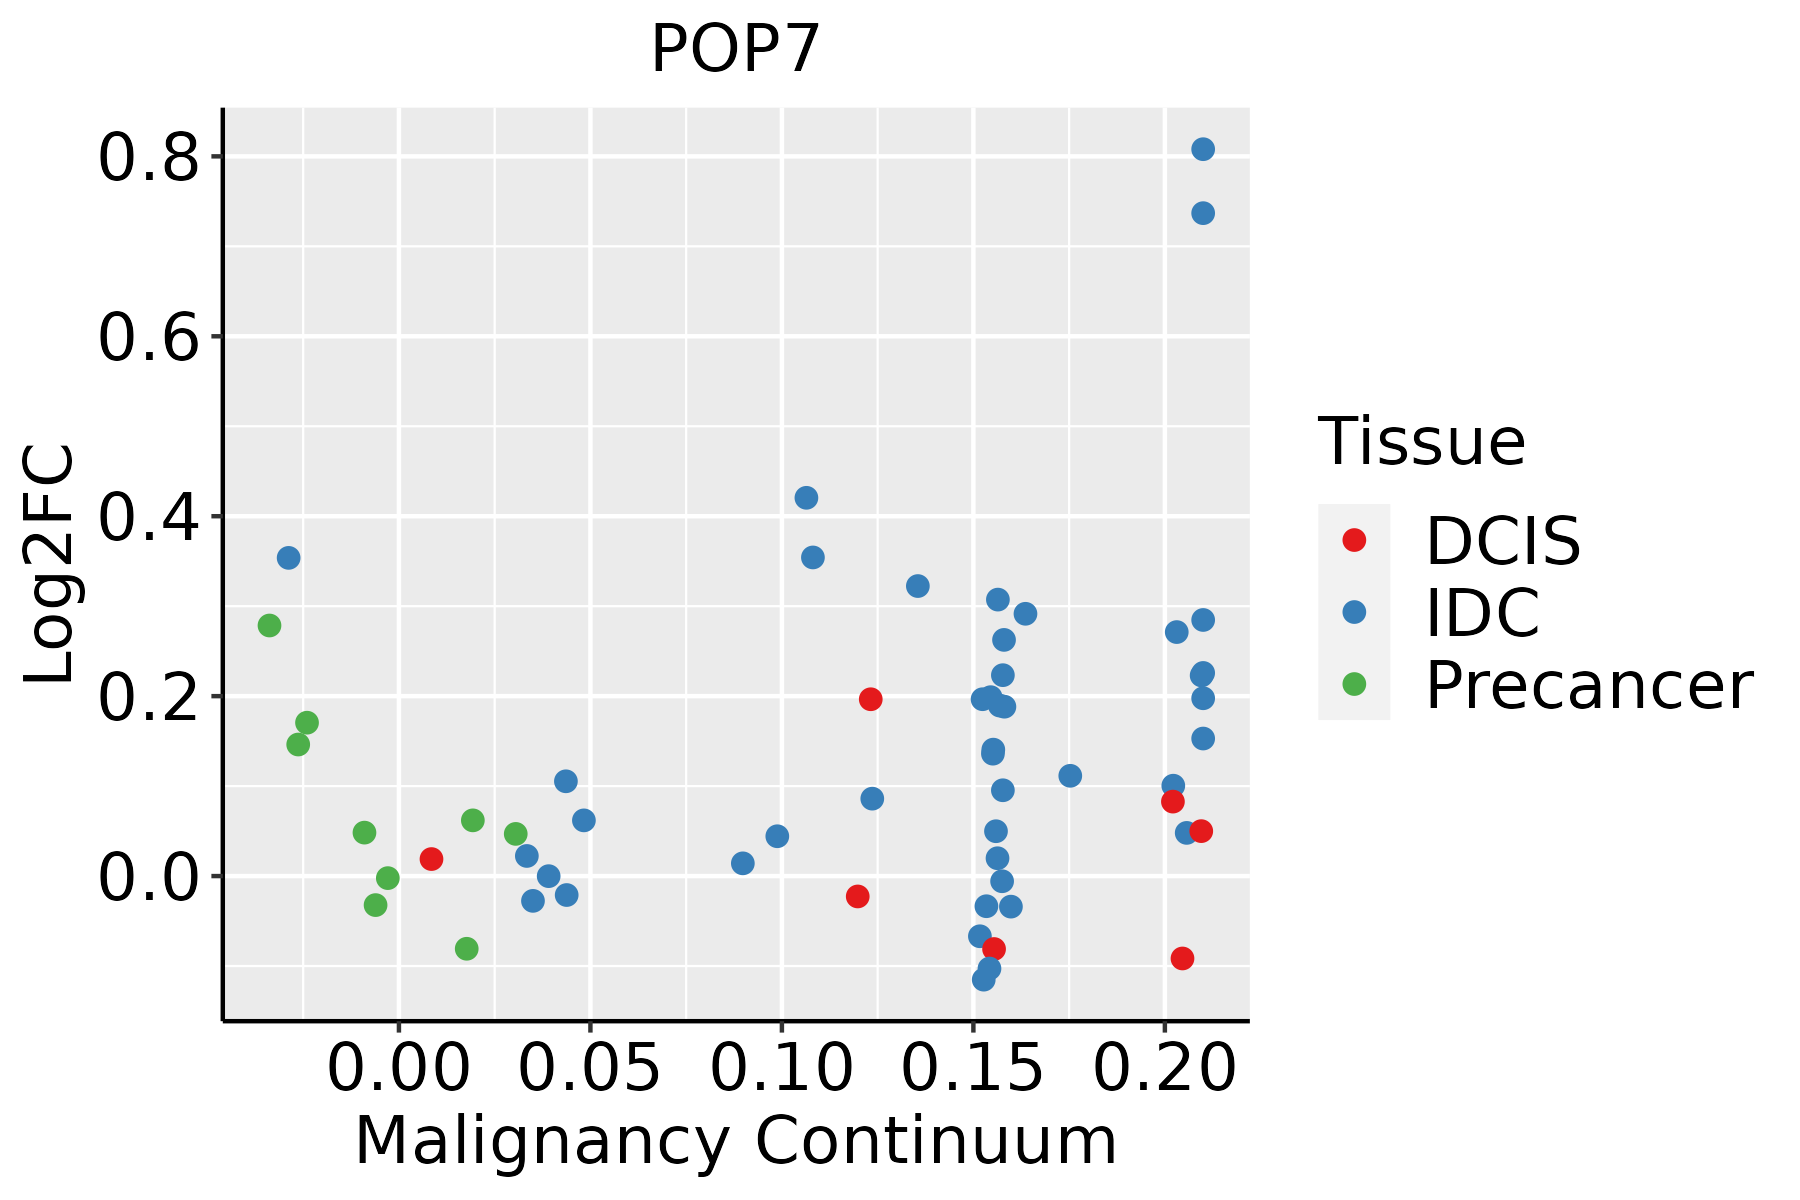 | IDC: Invasive ductal carcinoma |
| DCIS: Ductal carcinoma in situ | ||
| Precancer(BRCA1-mut): Precancerous lesion from BRCA1 mutation carriers | ||
| Colorectum (GSE201348) |  | FAP: Familial adenomatous polyposis |
| CRC: Colorectal cancer | ||
| Colorectum (HTA11) |  | AD: Adenomas |
| SER: Sessile serrated lesions | ||
| MSI-H: Microsatellite-high colorectal cancer | ||
| MSS: Microsatellite stable colorectal cancer | ||
| Esophagus | 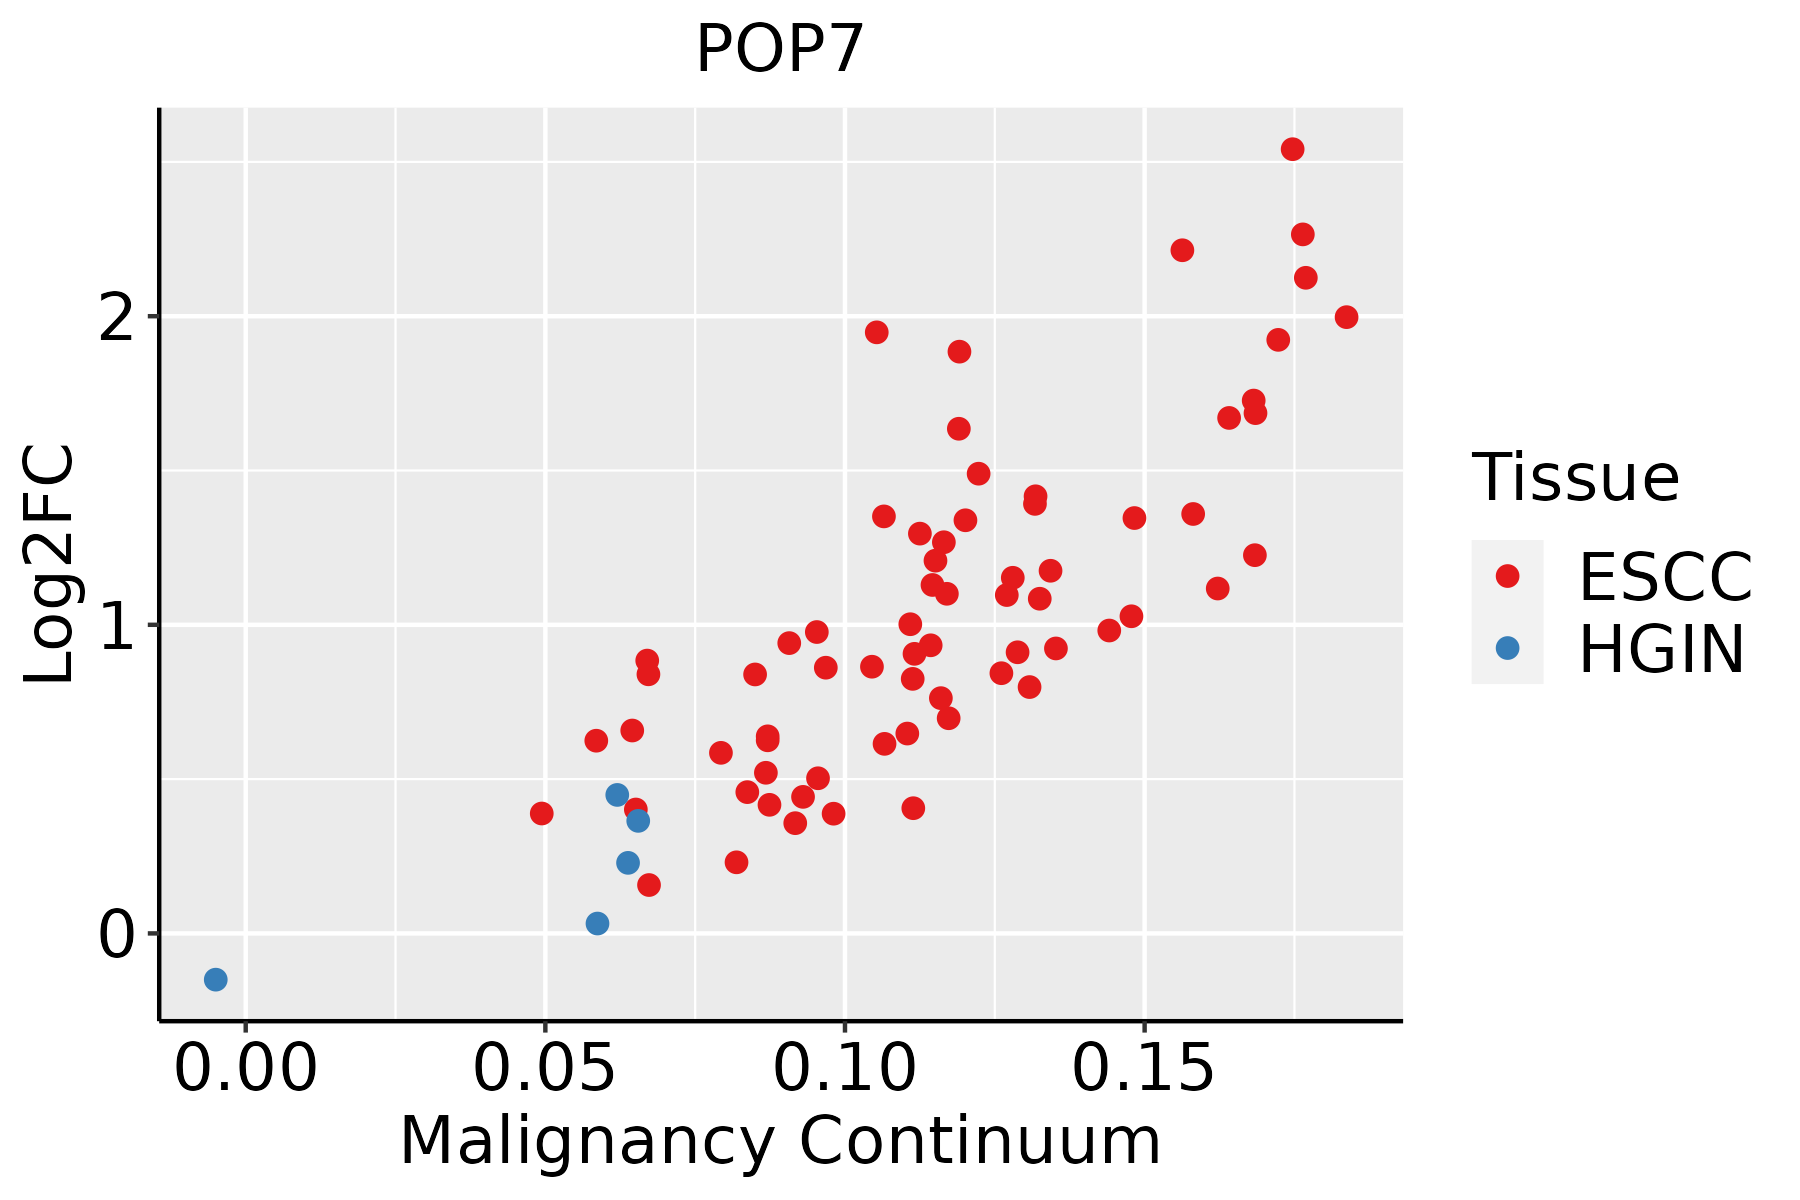 | ESCC: Esophageal squamous cell carcinoma |
| HGIN: High-grade intraepithelial neoplasias | ||
| LGIN: Low-grade intraepithelial neoplasias | ||
| Liver | 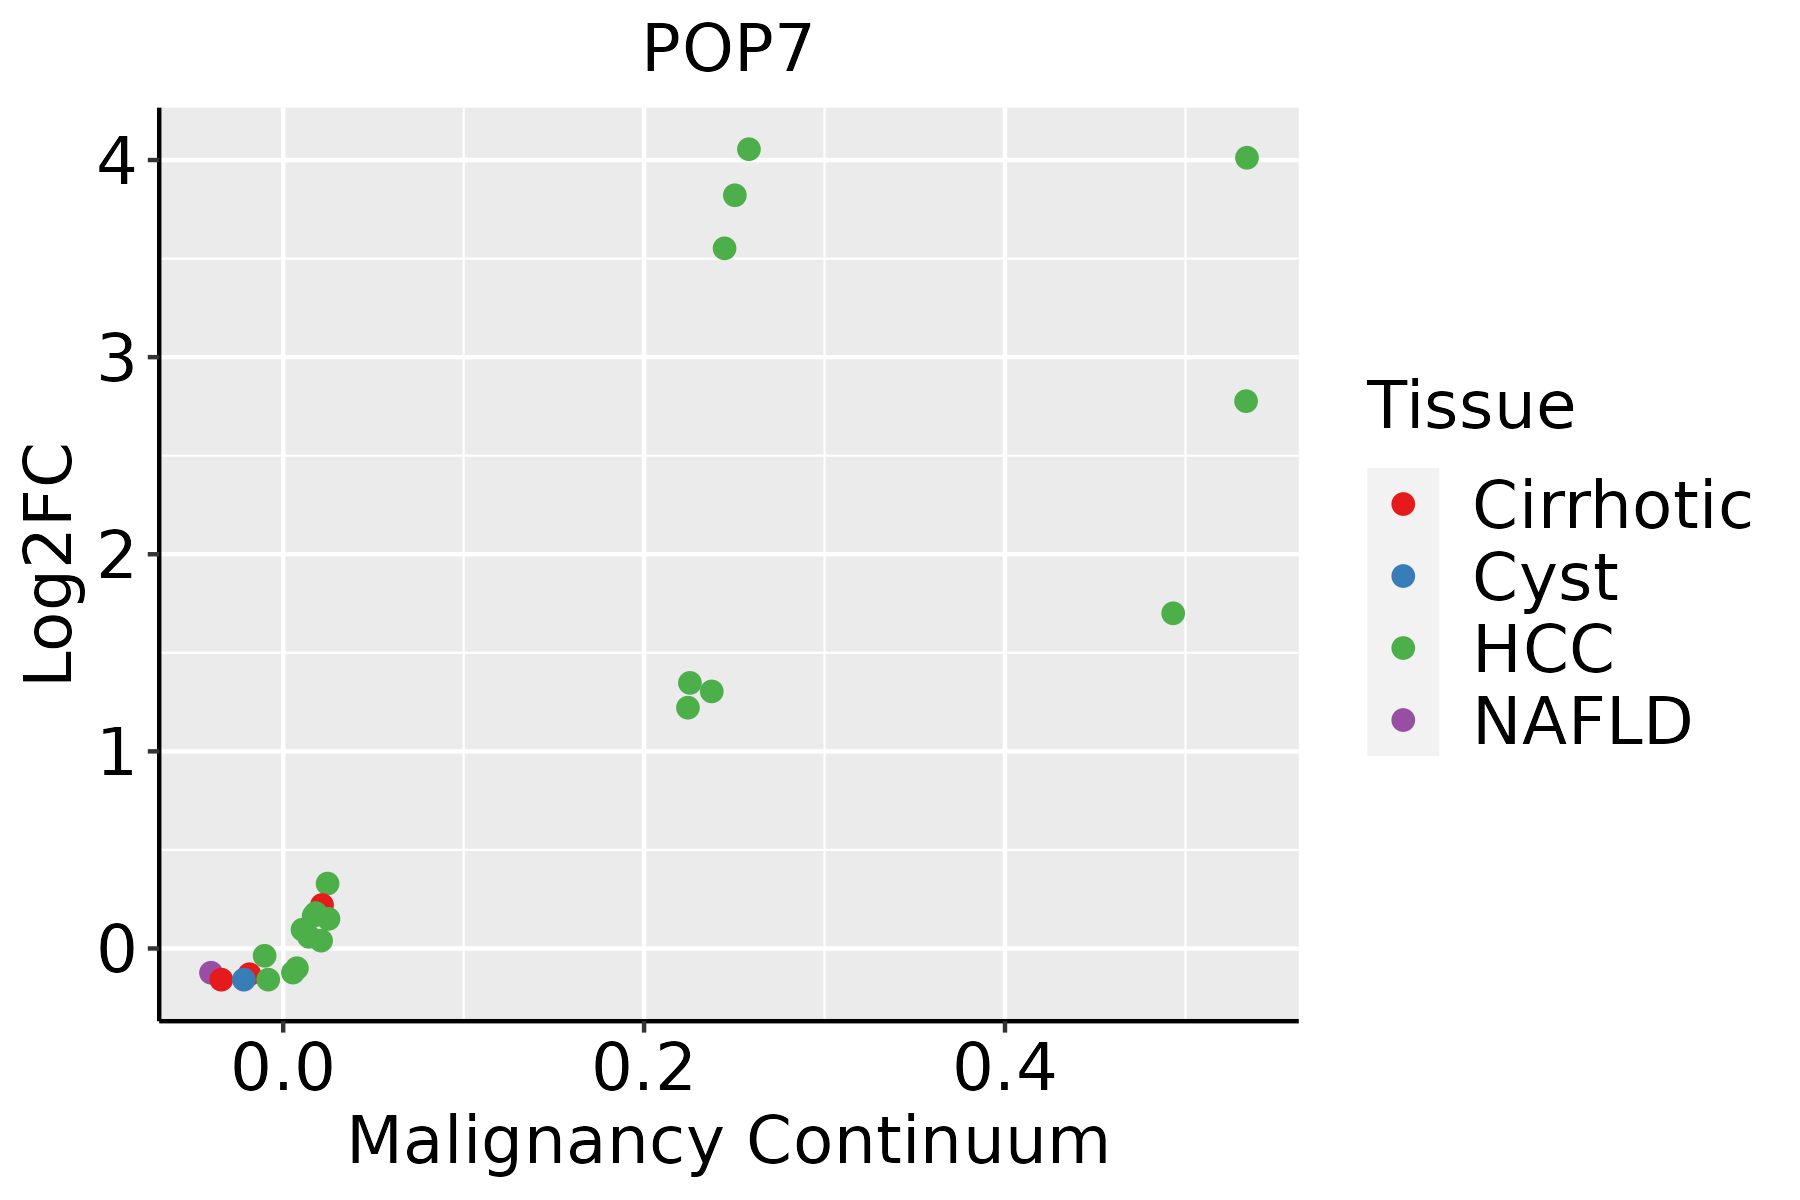 | HCC: Hepatocellular carcinoma |
| NAFLD: Non-alcoholic fatty liver disease | ||
| Oral Cavity | 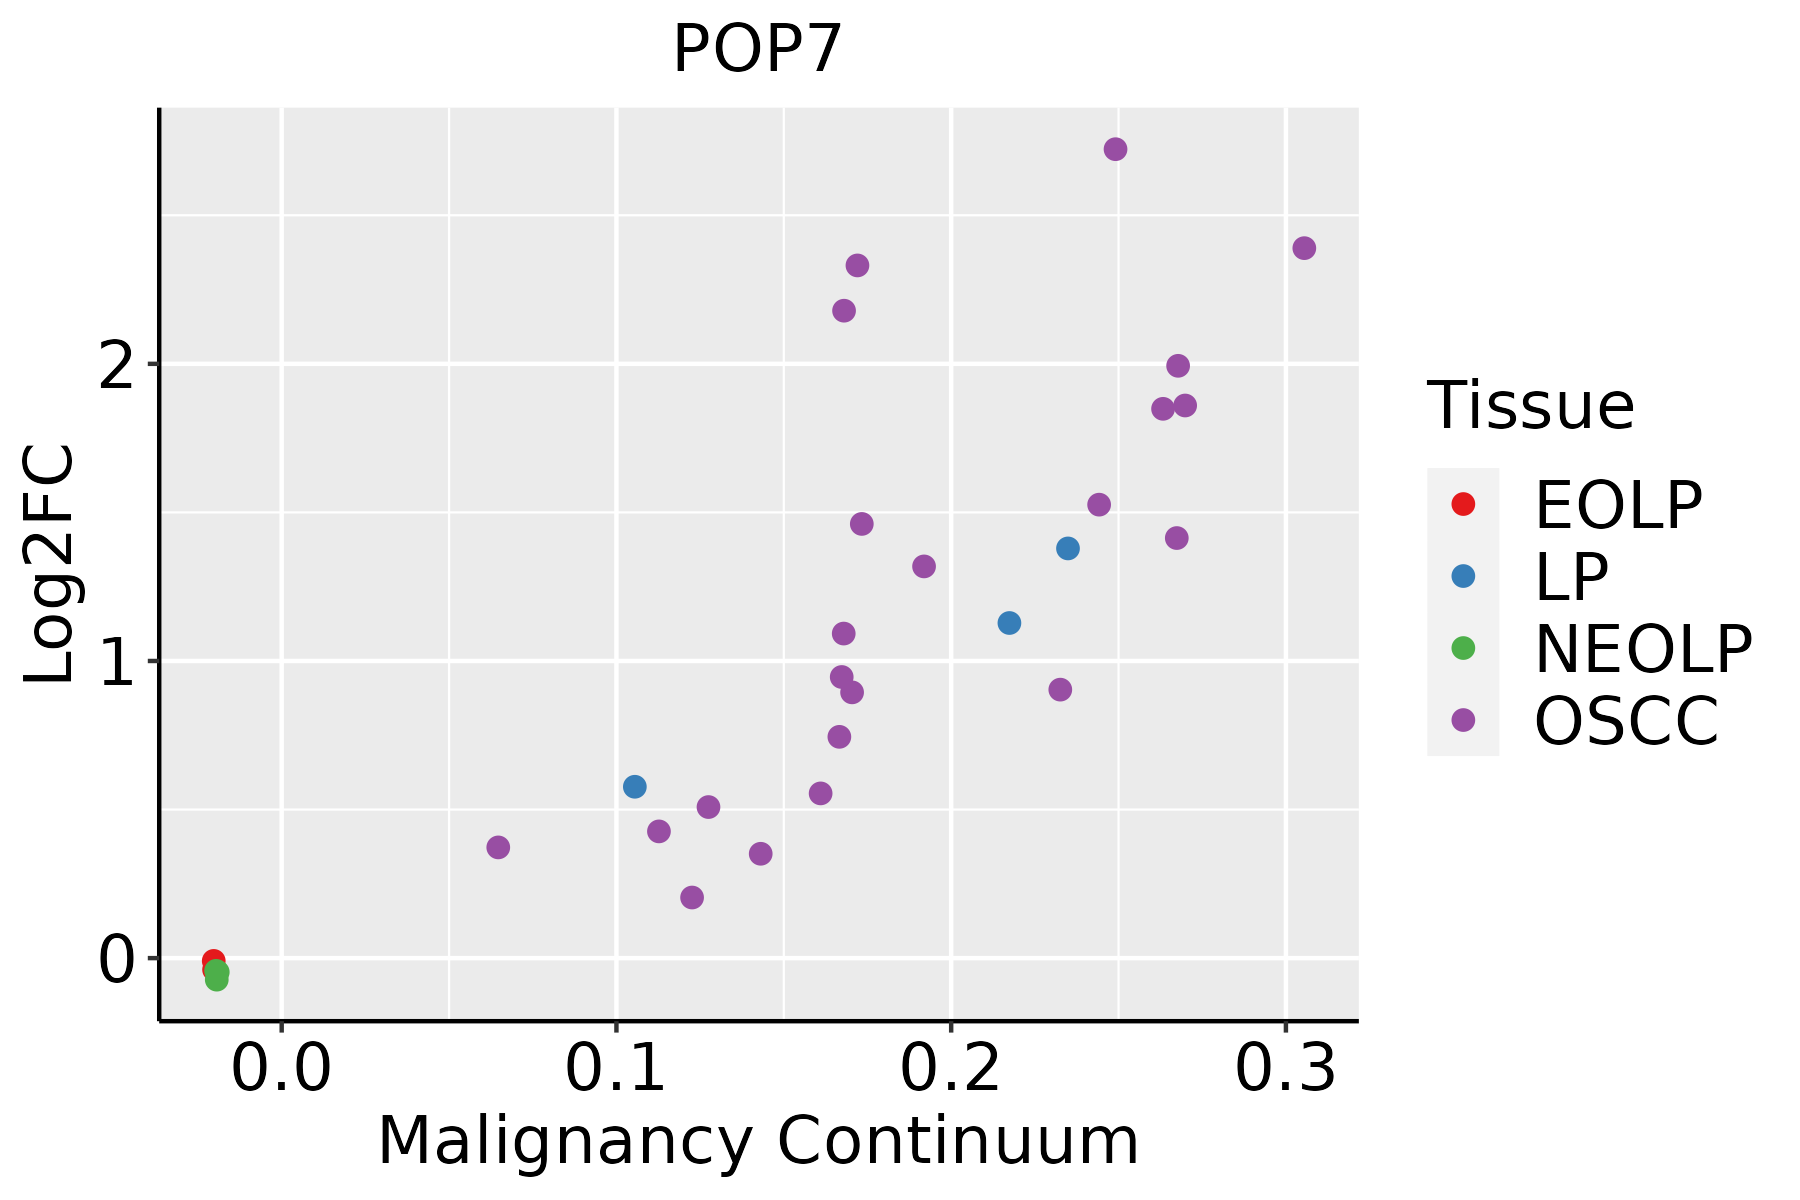 | EOLP: Erosive Oral lichen planus |
| LP: leukoplakia | ||
| NEOLP: Non-erosive oral lichen planus | ||
| OSCC: Oral squamous cell carcinoma | ||
| Prostate | 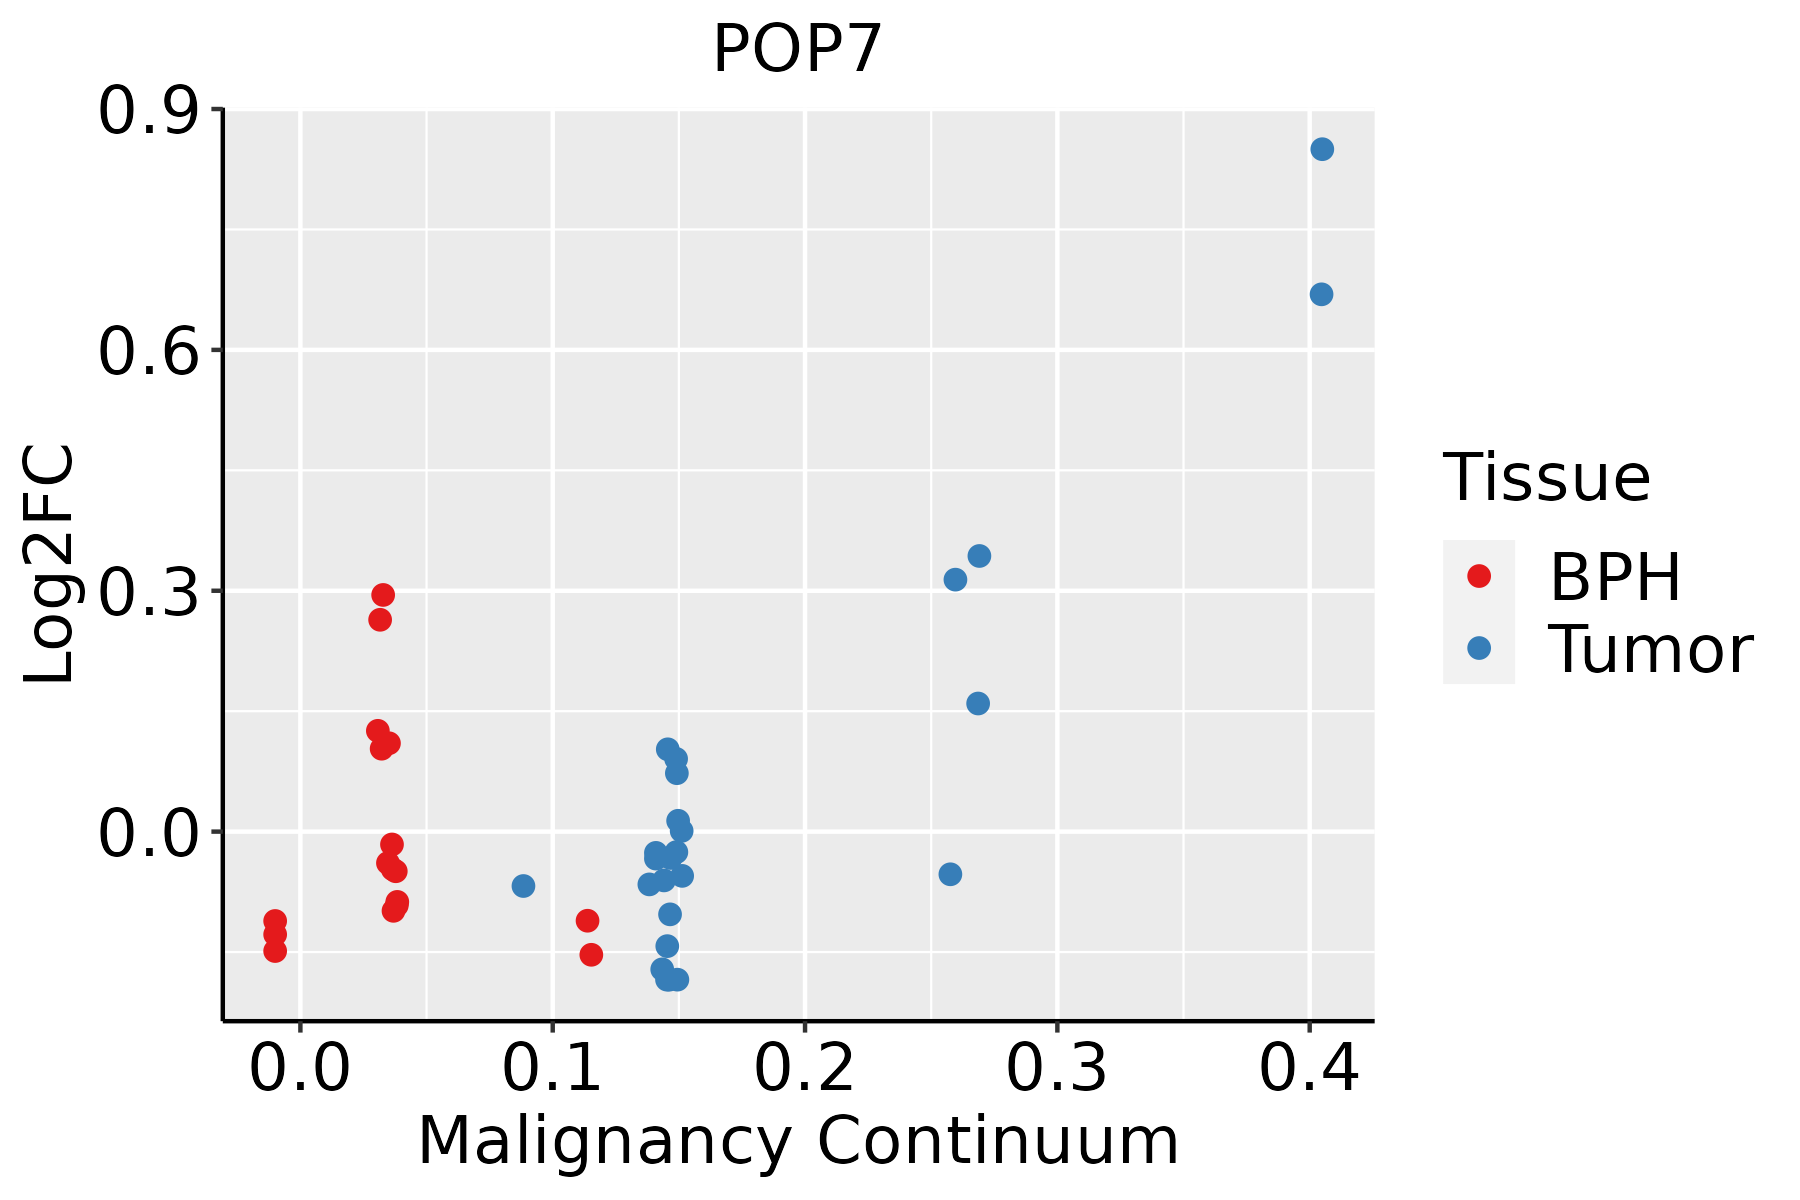 | BPH: Benign Prostatic Hyperplasia |
| Skin | 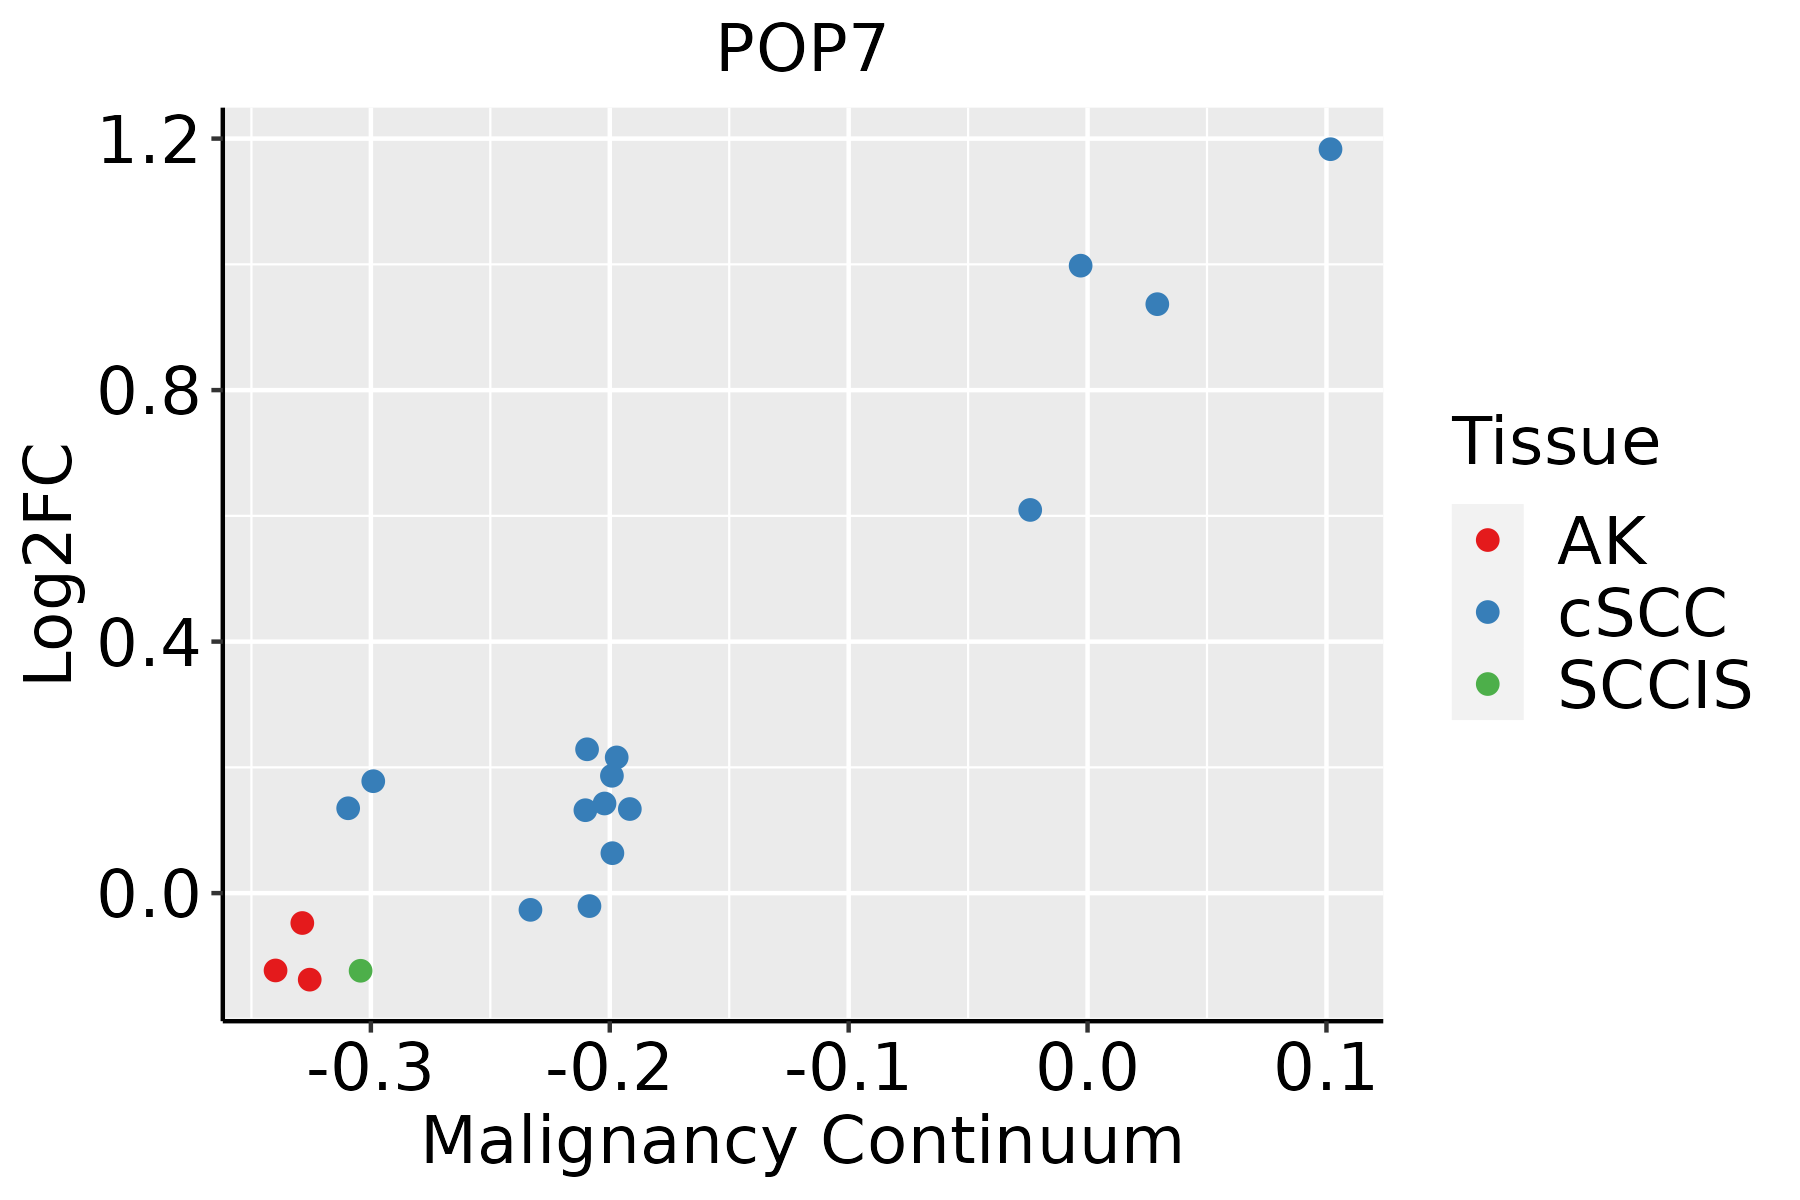 | AK: Actinic keratosis |
| cSCC: Cutaneous squamous cell carcinoma | ||
| SCCIS:squamous cell carcinoma in situ | ||
| Thyroid | 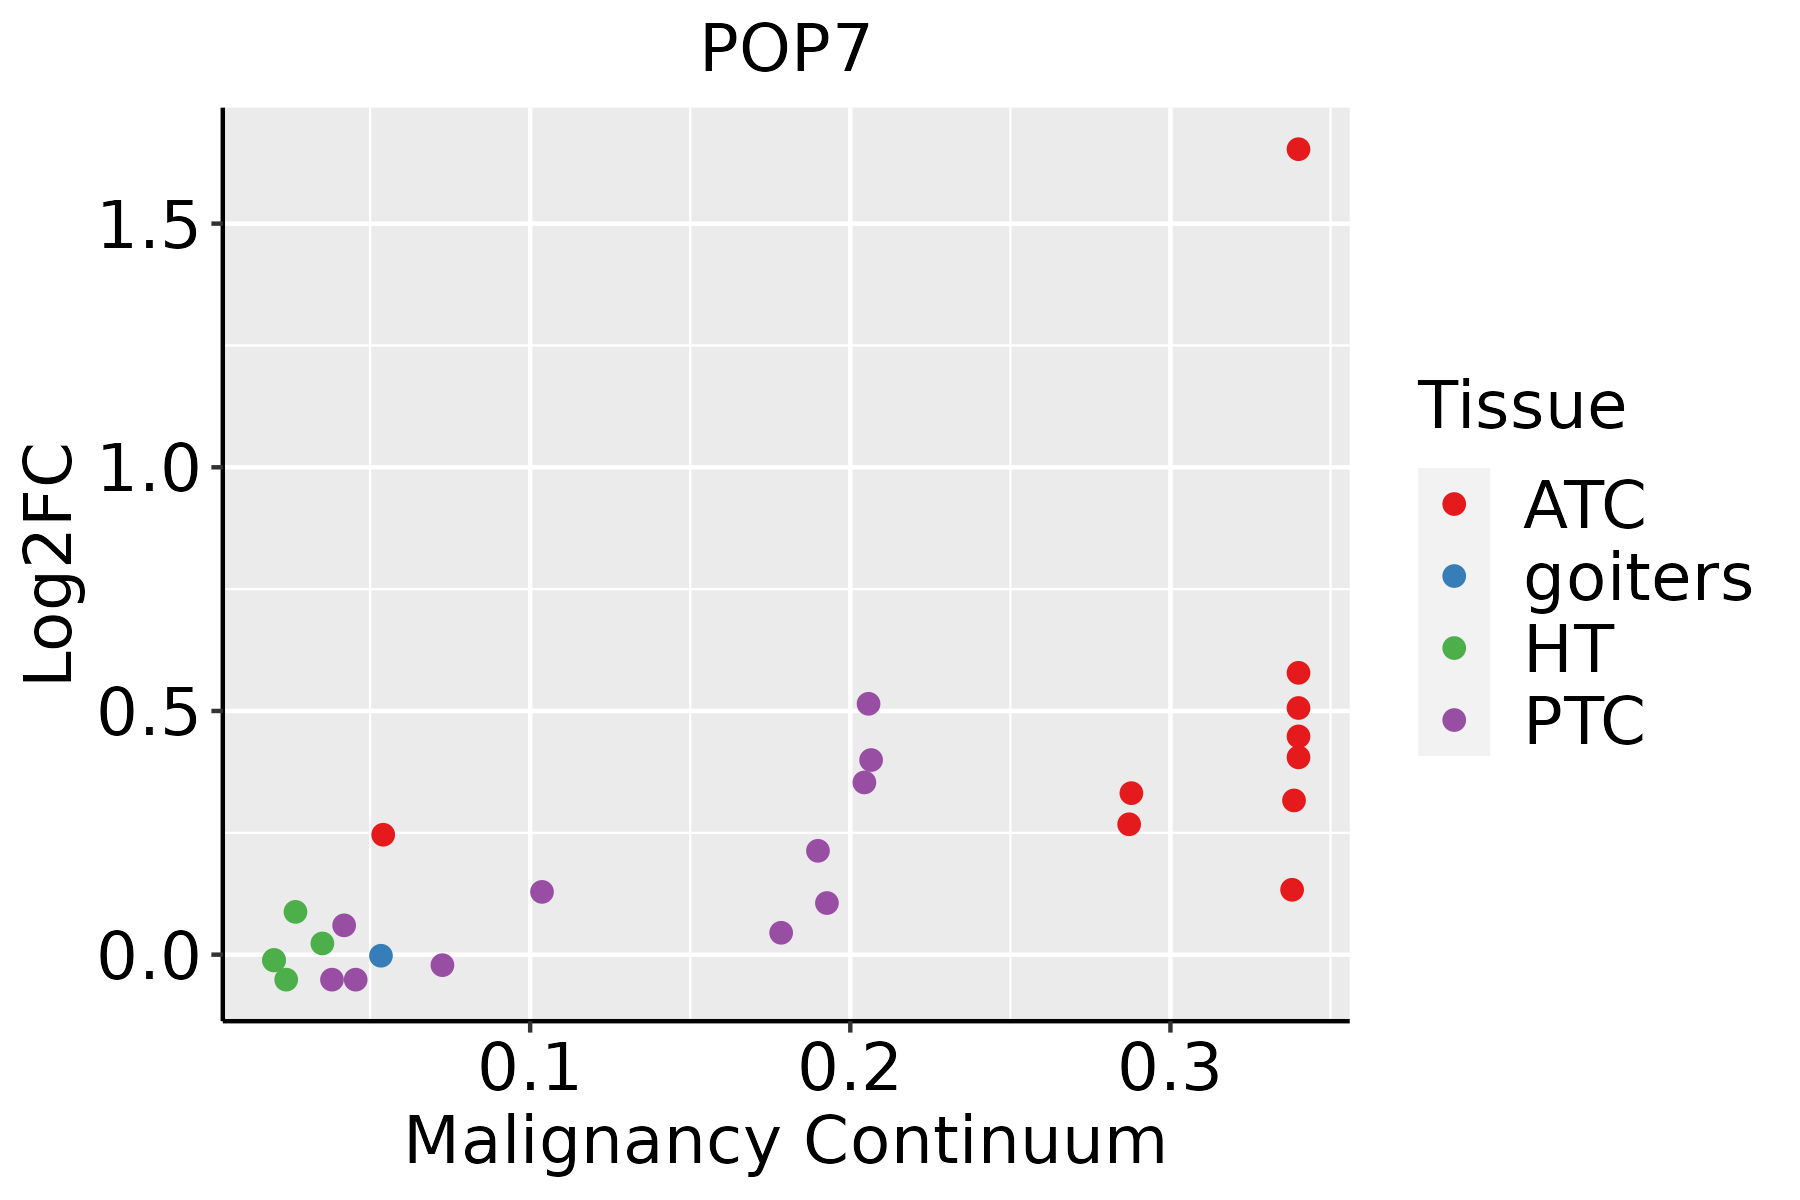 | ATC: Anaplastic thyroid cancer |
| HT: Hashimoto's thyroiditis | ||
| PTC: Papillary thyroid cancer |
| ∗log2FC in expression of this searched gene in stem-like cells from each diseased tissue sample relative to stem-like cells in normal samples in each tissue plotted against the malignancy continuum. Samples are colored based on if they are from different disease stage. |
Top |
Malignant transformation related pathway analysis |
| Find out the enriched GO biological processes and KEGG pathways involved in transition from healthy to precancer to cancer |
| Tissue | Disease Stage | Enriched GO biological Processes |
| Colorectum | AD |  |
| Colorectum | SER |  |
| Colorectum | MSS |  |
| Colorectum | MSI-H |  |
| Colorectum | FAP |  |
| ∗Top 15 enriched GO BP terms are showed in the bar plot of each disease state in each tissue. Each row represents a significant GO biological process which is colored according to the -log10(p.adjust). |
| Page: 1 2 3 4 5 6 7 8 9 |
| GO ID | Tissue | Disease Stage | Description | Gene Ratio | Bg Ratio | pvalue | p.adjust | Count |
| GO:00226139 | Breast | Precancer | ribonucleoprotein complex biogenesis | 79/1080 | 463/18723 | 2.11e-18 | 1.03e-15 | 79 |
| GO:00422549 | Breast | Precancer | ribosome biogenesis | 52/1080 | 299/18723 | 7.35e-13 | 1.51e-10 | 52 |
| GO:00063646 | Breast | Precancer | rRNA processing | 35/1080 | 225/18723 | 7.90e-08 | 4.60e-06 | 35 |
| GO:00160726 | Breast | Precancer | rRNA metabolic process | 36/1080 | 236/18723 | 8.59e-08 | 4.84e-06 | 36 |
| GO:00344705 | Breast | Precancer | ncRNA processing | 42/1080 | 395/18723 | 9.91e-05 | 1.83e-03 | 42 |
| GO:00346604 | Breast | Precancer | ncRNA metabolic process | 45/1080 | 485/18723 | 1.15e-03 | 1.26e-02 | 45 |
| GO:002261314 | Breast | IDC | ribonucleoprotein complex biogenesis | 83/1434 | 463/18723 | 2.01e-13 | 5.20e-11 | 83 |
| GO:004225414 | Breast | IDC | ribosome biogenesis | 52/1434 | 299/18723 | 1.90e-08 | 1.32e-06 | 52 |
| GO:000636414 | Breast | IDC | rRNA processing | 35/1434 | 225/18723 | 4.59e-05 | 1.03e-03 | 35 |
| GO:001607214 | Breast | IDC | rRNA metabolic process | 36/1434 | 236/18723 | 5.48e-05 | 1.17e-03 | 36 |
| GO:002261324 | Breast | DCIS | ribonucleoprotein complex biogenesis | 83/1390 | 463/18723 | 3.65e-14 | 1.09e-11 | 83 |
| GO:004225423 | Breast | DCIS | ribosome biogenesis | 52/1390 | 299/18723 | 6.73e-09 | 5.44e-07 | 52 |
| GO:000636422 | Breast | DCIS | rRNA processing | 35/1390 | 225/18723 | 2.41e-05 | 5.62e-04 | 35 |
| GO:001607222 | Breast | DCIS | rRNA metabolic process | 36/1390 | 236/18723 | 2.86e-05 | 6.42e-04 | 36 |
| GO:003447011 | Breast | DCIS | ncRNA processing | 44/1390 | 395/18723 | 4.56e-03 | 3.49e-02 | 44 |
| GO:0022613 | Colorectum | AD | ribonucleoprotein complex biogenesis | 151/3918 | 463/18723 | 1.96e-09 | 1.39e-07 | 151 |
| GO:0042254 | Colorectum | AD | ribosome biogenesis | 84/3918 | 299/18723 | 1.82e-03 | 1.50e-02 | 84 |
| GO:00226131 | Colorectum | SER | ribonucleoprotein complex biogenesis | 112/2897 | 463/18723 | 5.01e-07 | 2.48e-05 | 112 |
| GO:00422541 | Colorectum | SER | ribosome biogenesis | 66/2897 | 299/18723 | 1.48e-03 | 1.60e-02 | 66 |
| GO:00226132 | Colorectum | MSS | ribonucleoprotein complex biogenesis | 144/3467 | 463/18723 | 2.76e-11 | 3.67e-09 | 144 |
| Page: 1 2 3 4 5 6 7 |
| Pathway ID | Tissue | Disease Stage | Description | Gene Ratio | Bg Ratio | pvalue | p.adjust | qvalue | Count |
| Page: 1 |
Top |
Cell-cell communication analysis |
| Identification of potential cell-cell interactions between two cell types and their ligand-receptor pairs for different disease states |
| Ligand | Receptor | LRpair | Pathway | Tissue | Disease Stage |
| Page: 1 |
Top |
Single-cell gene regulatory network inference analysis |
| Find out the significant the regulons (TFs) and the target genes of each regulon across cell types for different disease states |
| TF | Cell Type | Tissue | Disease Stage | Target Gene | RSS | Regulon Activity |
| ∗The dot plots of a searched regulon are shown for all cell subpopulations in each disease state of each tissue based on the regulon specific score inferred using pySCENIC and by calculating the average expression. |
| Page: 1 |
Top |
Somatic mutation of malignant transformation related genes |
| Annotation of somatic variants for genes involved in malignant transformation |
| Hugo Symbol | Variant Class | Variant Classification | dbSNP RS | HGVSc | HGVSp | HGVSp Short | SWISSPROT | BIOTYPE | SIFT | PolyPhen | Tumor Sample Barcode | Tissue | Histology | Sex | Age | Stage | Therapy Types | Drugs | Outcome |
| POP7 | SNV | Missense_Mutation | novel | c.308C>G | p.Ser103Cys | p.S103C | O75817 | protein_coding | deleterious(0) | probably_damaging(0.996) | TCGA-C5-A1MH-01 | Cervix | cervical & endocervical cancer | Female | >=65 | III/IV | Chemotherapy | cisplatin | PD |
| POP7 | SNV | Missense_Mutation | rs755458828 | c.373N>T | p.Arg125Cys | p.R125C | O75817 | protein_coding | deleterious(0) | probably_damaging(1) | TCGA-CK-5916-01 | Colorectum | colon adenocarcinoma | Female | >=65 | I/II | Unknown | Unknown | PD |
| POP7 | SNV | Missense_Mutation | c.346N>A | p.Asp116Asn | p.D116N | O75817 | protein_coding | deleterious(0.04) | benign(0.011) | TCGA-G4-6628-01 | Colorectum | colon adenocarcinoma | Male | >=65 | I/II | Unknown | Unknown | SD | |
| POP7 | SNV | Missense_Mutation | novel | c.229G>A | p.Ala77Thr | p.A77T | O75817 | protein_coding | tolerated(0.06) | probably_damaging(0.987) | TCGA-A5-A0G1-01 | Endometrium | uterine corpus endometrioid carcinoma | Female | >=65 | I/II | Unknown | Unknown | SD |
| POP7 | SNV | Missense_Mutation | rs761545949 | c.68G>T | p.Arg23Met | p.R23M | O75817 | protein_coding | deleterious(0) | probably_damaging(0.99) | TCGA-AP-A0LG-01 | Endometrium | uterine corpus endometrioid carcinoma | Female | <65 | I/II | Unknown | Unknown | SD |
| POP7 | SNV | Missense_Mutation | rs532407719 | c.420N>T | p.Lys140Asn | p.K140N | O75817 | protein_coding | deleterious_low_confidence(0.01) | benign(0.031) | TCGA-AP-A0LM-01 | Endometrium | uterine corpus endometrioid carcinoma | Female | <65 | III/IV | Chemotherapy | cisplatin | SD |
| POP7 | SNV | Missense_Mutation | novel | c.98N>T | p.Arg33Ile | p.R33I | O75817 | protein_coding | deleterious(0) | probably_damaging(0.997) | TCGA-B5-A3FA-01 | Endometrium | uterine corpus endometrioid carcinoma | Female | >=65 | I/II | Unknown | Unknown | SD |
| POP7 | SNV | Missense_Mutation | c.206N>C | p.Ile69Thr | p.I69T | O75817 | protein_coding | deleterious(0) | benign(0.207) | TCGA-BS-A0UF-01 | Endometrium | uterine corpus endometrioid carcinoma | Female | >=65 | I/II | Unknown | Unknown | SD | |
| POP7 | insertion | Frame_Shift_Ins | novel | c.293_294insCCCATCA | p.Ala99ProfsTer13 | p.A99Pfs*13 | O75817 | protein_coding | TCGA-AP-A05P-01 | Endometrium | uterine corpus endometrioid carcinoma | Female | <65 | I/II | Unknown | Unknown | SD | ||
| POP7 | SNV | Missense_Mutation | c.140N>A | p.Ala47Asp | p.A47D | O75817 | protein_coding | deleterious(0.01) | probably_damaging(0.986) | TCGA-44-8120-01 | Lung | lung adenocarcinoma | Male | <65 | I/II | Unknown | Unknown | SD |
| Page: 1 2 |
Top |
Related drugs of malignant transformation related genes |
| Identification of chemicals and drugs interact with genes involved in malignant transfromation |
| (DGIdb 4.0) |
| Entrez ID | Symbol | Category | Interaction Types | Drug Claim Name | Drug Name | PMIDs |
| Page: 1 |

Copyright 2023-Present -The University of Texas Health Science Center at Houston |