
|
|||||
|
 | |
| |
| |
| |
| |
| |
|
Gene: POP4 |
Gene summary for POP4 |
| Gene information | Species | Human | Gene symbol | POP4 | Gene ID | 10775 |
| Gene name | POP4 homolog, ribonuclease P/MRP subunit | |
| Gene Alias | RPP29 | |
| Cytomap | 19q12 | |
| Gene Type | protein-coding | GO ID | GO:0000966 | UniProtAcc | O95707 |
Top |
Malignant transformation analysis |
| Identification of the aberrant gene expression in precancerous and cancerous lesions by comparing the gene expression of stem-like cells in diseased tissues with normal stem cells |
| Entrez ID | Symbol | Replicates | Species | Organ | Tissue | Adj P-value | Log2FC | Malignancy |
| 10775 | POP4 | LZE4T | Human | Esophagus | ESCC | 5.38e-07 | 2.12e-01 | 0.0811 |
| 10775 | POP4 | LZE7T | Human | Esophagus | ESCC | 2.15e-05 | 4.67e-01 | 0.0667 |
| 10775 | POP4 | LZE8T | Human | Esophagus | ESCC | 9.50e-10 | 2.10e-01 | 0.067 |
| 10775 | POP4 | LZE20T | Human | Esophagus | ESCC | 4.95e-07 | 2.25e-01 | 0.0662 |
| 10775 | POP4 | LZE24T | Human | Esophagus | ESCC | 2.35e-21 | 3.93e-01 | 0.0596 |
| 10775 | POP4 | LZE21T | Human | Esophagus | ESCC | 4.53e-04 | 2.69e-01 | 0.0655 |
| 10775 | POP4 | LZE6T | Human | Esophagus | ESCC | 2.05e-05 | 3.41e-01 | 0.0845 |
| 10775 | POP4 | P1T-E | Human | Esophagus | ESCC | 3.48e-12 | 5.87e-01 | 0.0875 |
| 10775 | POP4 | P2T-E | Human | Esophagus | ESCC | 2.16e-26 | 3.56e-01 | 0.1177 |
| 10775 | POP4 | P4T-E | Human | Esophagus | ESCC | 1.74e-22 | 5.47e-01 | 0.1323 |
| 10775 | POP4 | P5T-E | Human | Esophagus | ESCC | 2.60e-25 | 5.25e-01 | 0.1327 |
| 10775 | POP4 | P8T-E | Human | Esophagus | ESCC | 4.89e-39 | 7.12e-01 | 0.0889 |
| 10775 | POP4 | P9T-E | Human | Esophagus | ESCC | 8.47e-13 | 4.61e-01 | 0.1131 |
| 10775 | POP4 | P10T-E | Human | Esophagus | ESCC | 9.40e-24 | 5.68e-01 | 0.116 |
| 10775 | POP4 | P11T-E | Human | Esophagus | ESCC | 4.52e-11 | 6.61e-01 | 0.1426 |
| 10775 | POP4 | P12T-E | Human | Esophagus | ESCC | 1.37e-26 | 4.58e-01 | 0.1122 |
| 10775 | POP4 | P15T-E | Human | Esophagus | ESCC | 2.14e-20 | 4.52e-01 | 0.1149 |
| 10775 | POP4 | P16T-E | Human | Esophagus | ESCC | 9.79e-17 | 2.82e-01 | 0.1153 |
| 10775 | POP4 | P17T-E | Human | Esophagus | ESCC | 2.76e-10 | 4.51e-01 | 0.1278 |
| 10775 | POP4 | P19T-E | Human | Esophagus | ESCC | 4.81e-11 | 8.23e-01 | 0.1662 |
| Page: 1 2 3 4 5 6 |
| Tissue | Expression Dynamics | Abbreviation |
| Esophagus | 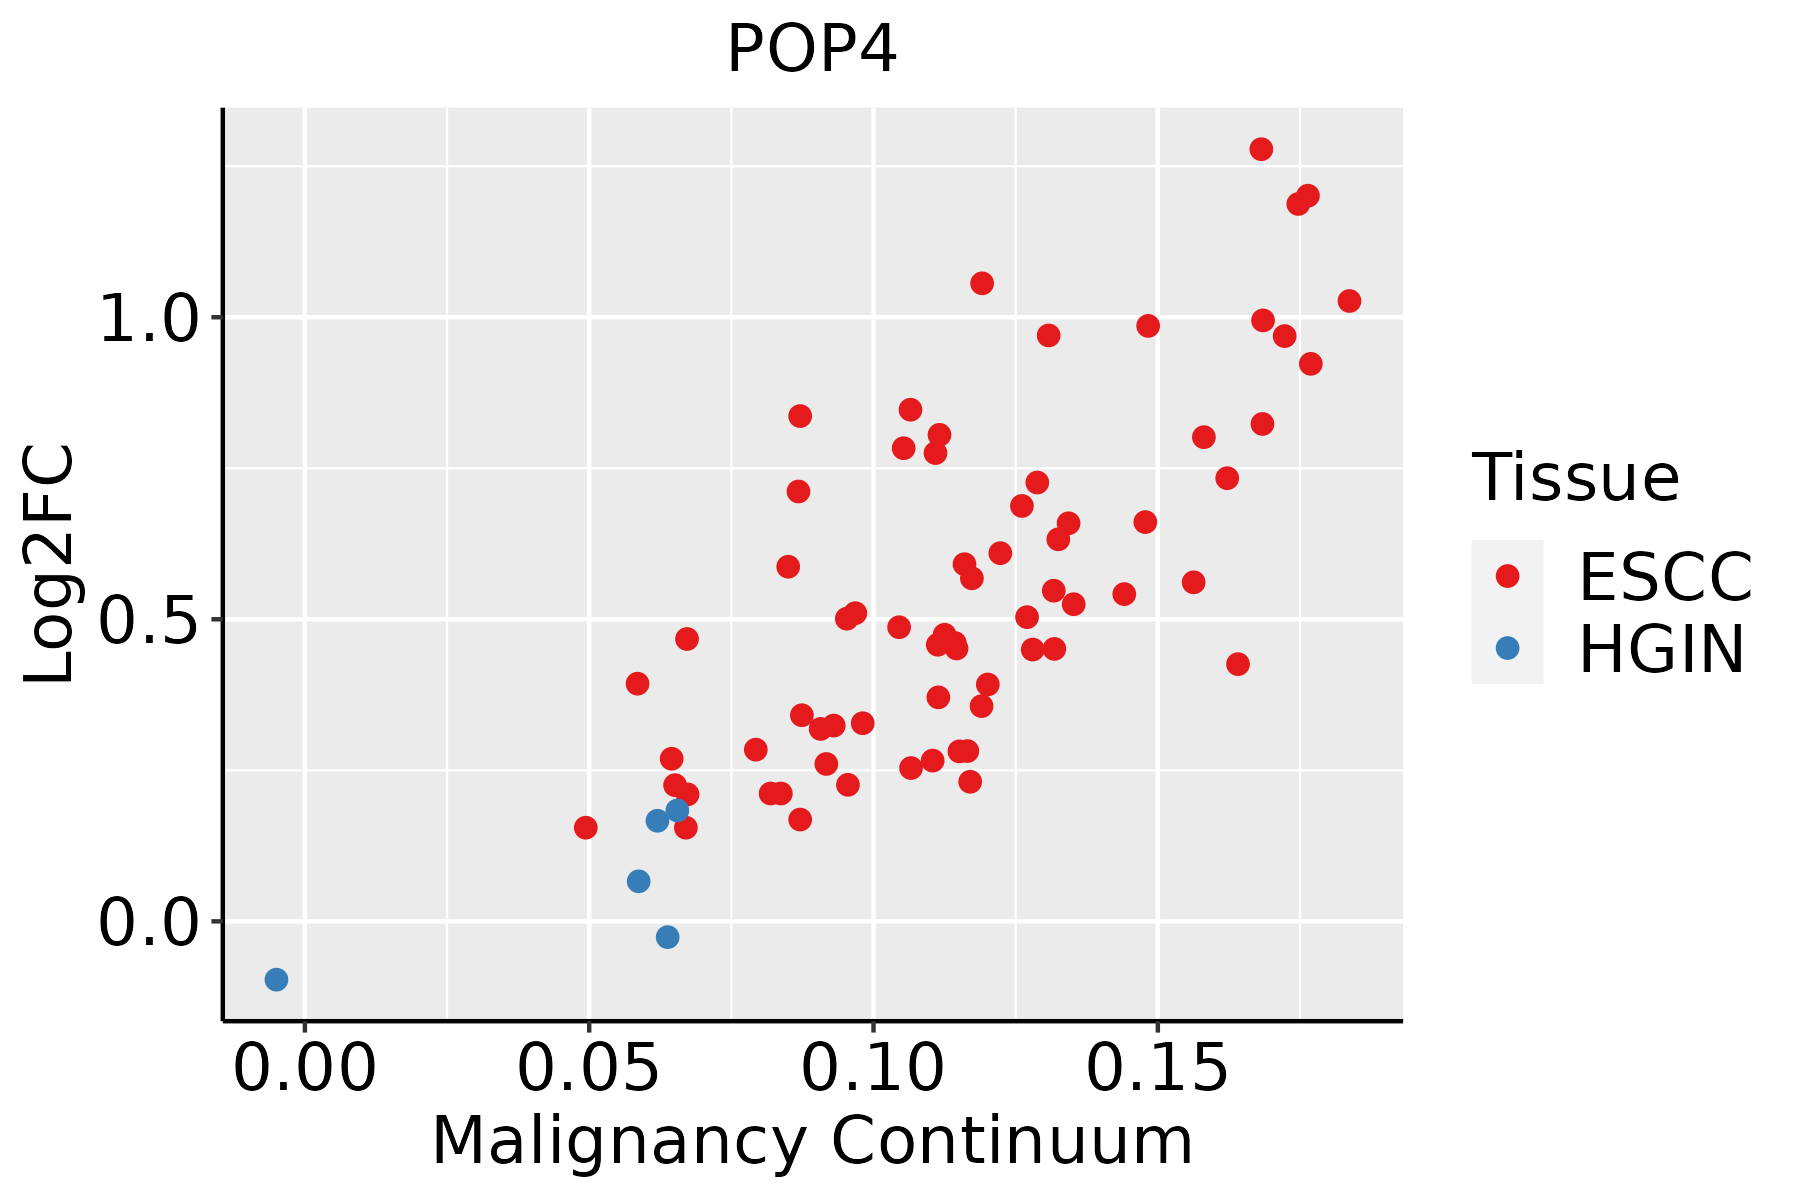 | ESCC: Esophageal squamous cell carcinoma |
| HGIN: High-grade intraepithelial neoplasias | ||
| LGIN: Low-grade intraepithelial neoplasias | ||
| Liver | 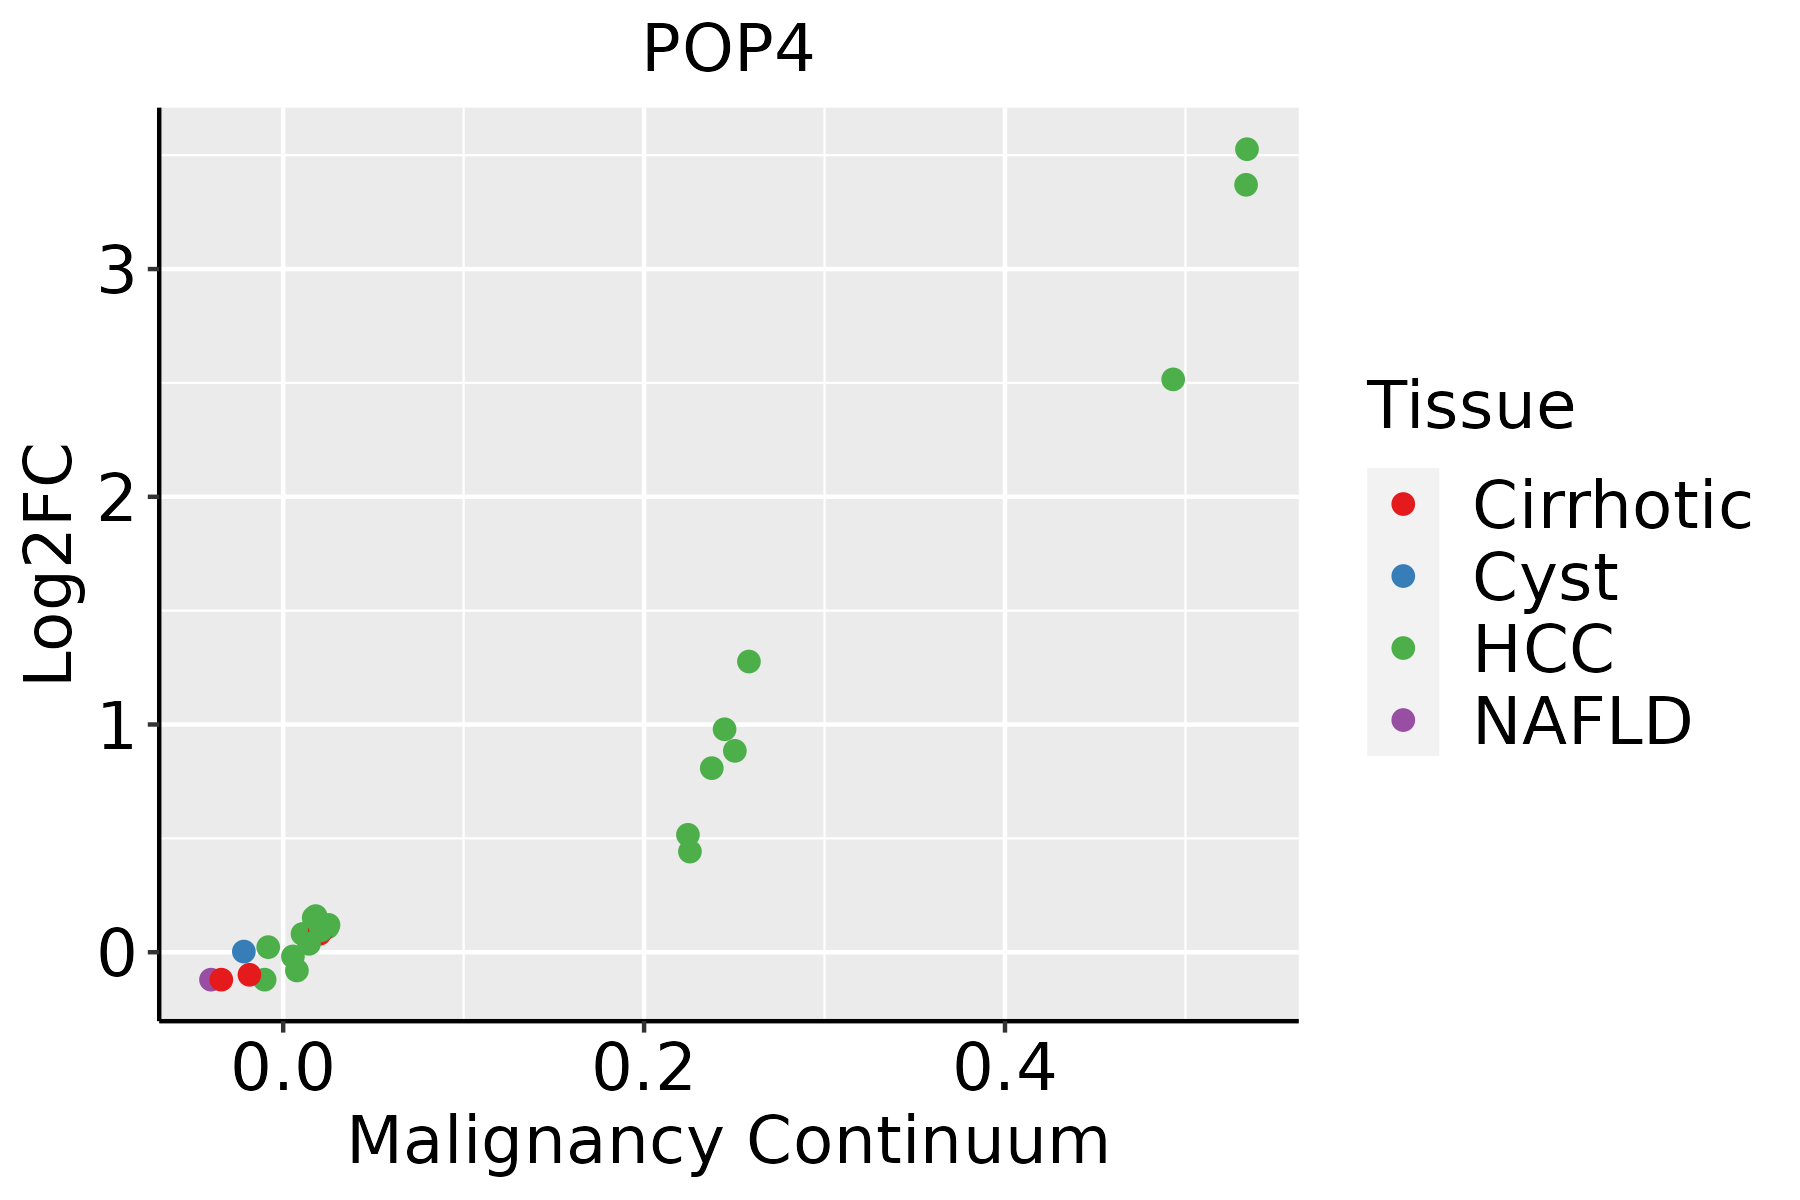 | HCC: Hepatocellular carcinoma |
| NAFLD: Non-alcoholic fatty liver disease | ||
| Oral Cavity | 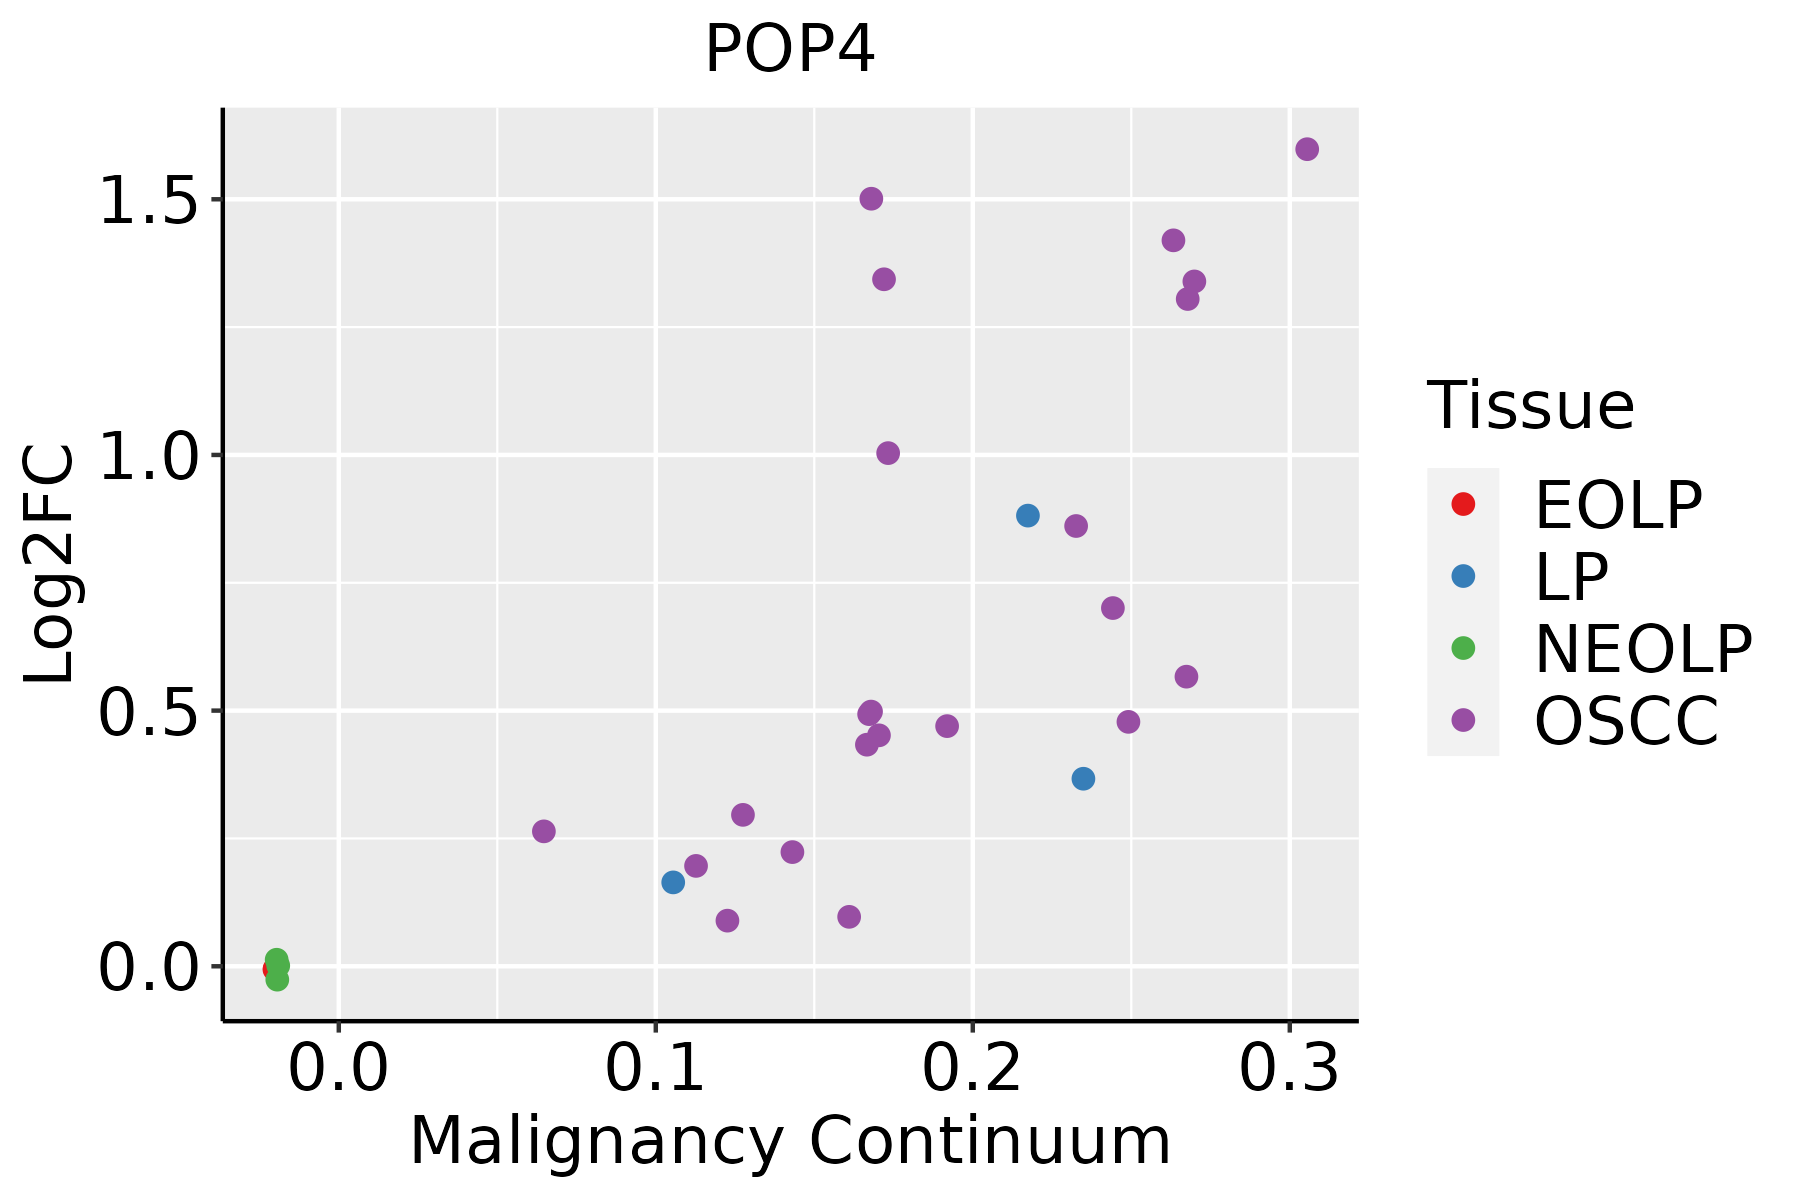 | EOLP: Erosive Oral lichen planus |
| LP: leukoplakia | ||
| NEOLP: Non-erosive oral lichen planus | ||
| OSCC: Oral squamous cell carcinoma | ||
| Skin | 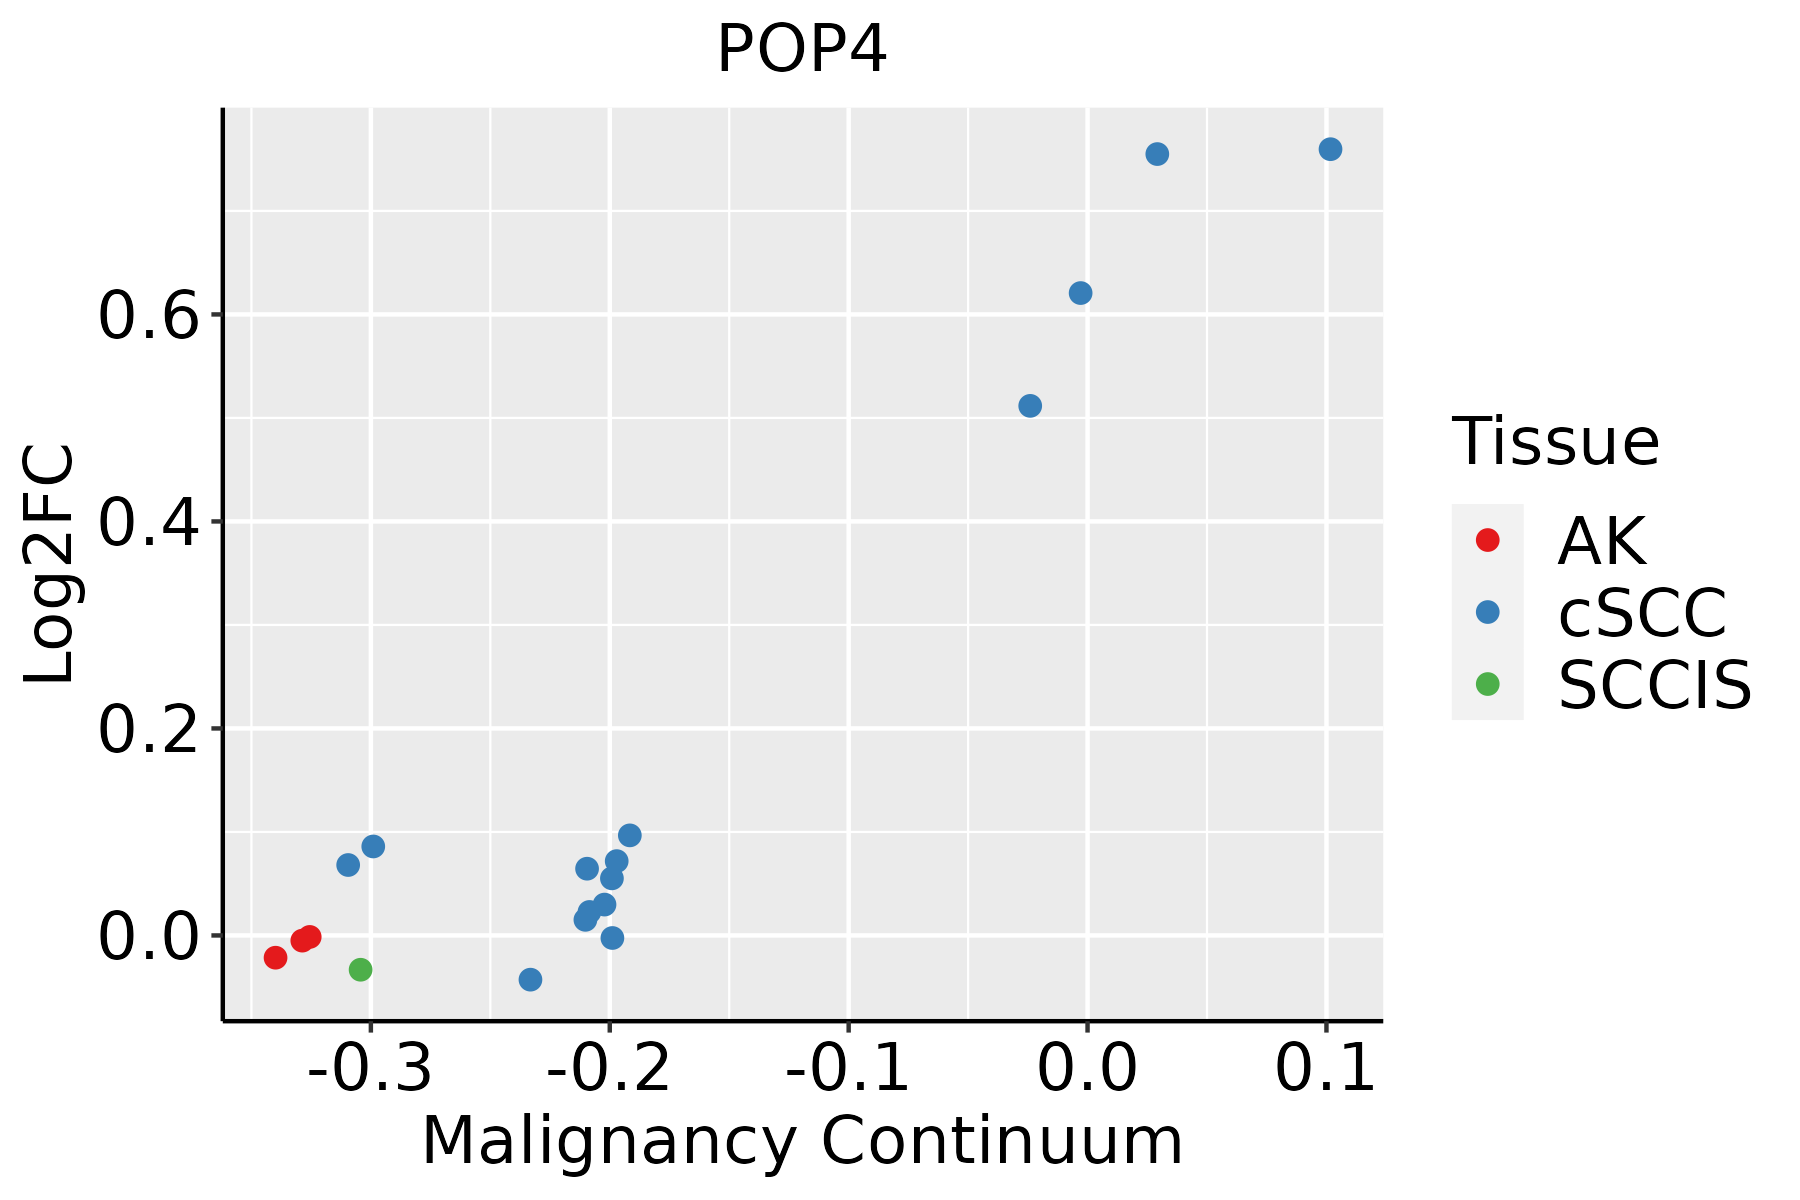 | AK: Actinic keratosis |
| cSCC: Cutaneous squamous cell carcinoma | ||
| SCCIS:squamous cell carcinoma in situ | ||
| Thyroid |  | ATC: Anaplastic thyroid cancer |
| HT: Hashimoto's thyroiditis | ||
| PTC: Papillary thyroid cancer |
| ∗log2FC in expression of this searched gene in stem-like cells from each diseased tissue sample relative to stem-like cells in normal samples in each tissue plotted against the malignancy continuum. Samples are colored based on if they are from different disease stage. |
Top |
Malignant transformation related pathway analysis |
| Find out the enriched GO biological processes and KEGG pathways involved in transition from healthy to precancer to cancer |
| Tissue | Disease Stage | Enriched GO biological Processes |
| Colorectum | AD |  |
| Colorectum | SER |  |
| Colorectum | MSS |  |
| Colorectum | MSI-H |  |
| Colorectum | FAP |  |
| ∗Top 15 enriched GO BP terms are showed in the bar plot of each disease state in each tissue. Each row represents a significant GO biological process which is colored according to the -log10(p.adjust). |
| Page: 1 2 3 4 5 6 7 8 9 |
| GO ID | Tissue | Disease Stage | Description | Gene Ratio | Bg Ratio | pvalue | p.adjust | Count |
| GO:0022613111 | Esophagus | ESCC | ribonucleoprotein complex biogenesis | 365/8552 | 463/18723 | 1.74e-49 | 1.11e-45 | 365 |
| GO:0042254111 | Esophagus | ESCC | ribosome biogenesis | 252/8552 | 299/18723 | 3.27e-44 | 1.04e-40 | 252 |
| GO:003447015 | Esophagus | ESCC | ncRNA processing | 300/8552 | 395/18723 | 3.09e-35 | 3.26e-32 | 300 |
| GO:0016072110 | Esophagus | ESCC | rRNA metabolic process | 197/8552 | 236/18723 | 1.31e-33 | 1.18e-30 | 197 |
| GO:0006364110 | Esophagus | ESCC | rRNA processing | 189/8552 | 225/18723 | 4.88e-33 | 3.87e-30 | 189 |
| GO:003466012 | Esophagus | ESCC | ncRNA metabolic process | 346/8552 | 485/18723 | 4.35e-31 | 2.51e-28 | 346 |
| GO:00905013 | Esophagus | ESCC | RNA phosphodiester bond hydrolysis | 110/8552 | 152/18723 | 1.95e-11 | 6.81e-10 | 110 |
| GO:00080333 | Esophagus | ESCC | tRNA processing | 92/8552 | 127/18723 | 7.83e-10 | 1.93e-08 | 92 |
| GO:00063992 | Esophagus | ESCC | tRNA metabolic process | 122/8552 | 179/18723 | 9.03e-10 | 2.19e-08 | 122 |
| GO:00903053 | Esophagus | ESCC | nucleic acid phosphodiester bond hydrolysis | 163/8552 | 261/18723 | 3.07e-08 | 5.73e-07 | 163 |
| GO:00905023 | Esophagus | ESCC | RNA phosphodiester bond hydrolysis, endonucleolytic | 55/8552 | 82/18723 | 7.34e-05 | 5.51e-04 | 55 |
| GO:00344713 | Esophagus | ESCC | ncRNA 5'-end processing | 18/8552 | 21/18723 | 1.81e-04 | 1.16e-03 | 18 |
| GO:00009663 | Esophagus | ESCC | RNA 5'-end processing | 19/8552 | 23/18723 | 3.12e-04 | 1.85e-03 | 19 |
| GO:00991163 | Esophagus | ESCC | tRNA 5'-end processing | 14/8552 | 16/18723 | 6.78e-04 | 3.56e-03 | 14 |
| GO:00016823 | Esophagus | ESCC | tRNA 5'-leader removal | 11/8552 | 13/18723 | 4.76e-03 | 1.85e-02 | 11 |
| GO:002261312 | Liver | Cirrhotic | ribonucleoprotein complex biogenesis | 231/4634 | 463/18723 | 3.28e-32 | 6.86e-29 | 231 |
| GO:004225412 | Liver | Cirrhotic | ribosome biogenesis | 154/4634 | 299/18723 | 1.18e-23 | 6.72e-21 | 154 |
| GO:000636412 | Liver | Cirrhotic | rRNA processing | 115/4634 | 225/18723 | 1.12e-17 | 1.64e-15 | 115 |
| GO:00160724 | Liver | Cirrhotic | rRNA metabolic process | 119/4634 | 236/18723 | 1.19e-17 | 1.70e-15 | 119 |
| GO:00344701 | Liver | Cirrhotic | ncRNA processing | 158/4634 | 395/18723 | 1.09e-11 | 6.96e-10 | 158 |
| Page: 1 2 3 4 5 |
| Pathway ID | Tissue | Disease Stage | Description | Gene Ratio | Bg Ratio | pvalue | p.adjust | qvalue | Count |
| Page: 1 |
Top |
Cell-cell communication analysis |
| Identification of potential cell-cell interactions between two cell types and their ligand-receptor pairs for different disease states |
| Ligand | Receptor | LRpair | Pathway | Tissue | Disease Stage |
| Page: 1 |
Top |
Single-cell gene regulatory network inference analysis |
| Find out the significant the regulons (TFs) and the target genes of each regulon across cell types for different disease states |
| TF | Cell Type | Tissue | Disease Stage | Target Gene | RSS | Regulon Activity |
| ∗The dot plots of a searched regulon are shown for all cell subpopulations in each disease state of each tissue based on the regulon specific score inferred using pySCENIC and by calculating the average expression. |
| Page: 1 |
Top |
Somatic mutation of malignant transformation related genes |
| Annotation of somatic variants for genes involved in malignant transformation |
| Hugo Symbol | Variant Class | Variant Classification | dbSNP RS | HGVSc | HGVSp | HGVSp Short | SWISSPROT | BIOTYPE | SIFT | PolyPhen | Tumor Sample Barcode | Tissue | Histology | Sex | Age | Stage | Therapy Types | Drugs | Outcome |
| POP4 | SNV | Missense_Mutation | novel | c.655G>A | p.Asp219Asn | p.D219N | O95707 | protein_coding | deleterious(0) | benign(0.406) | TCGA-JW-AAVH-01 | Cervix | cervical & endocervical cancer | Female | <65 | I/II | Unknown | Unknown | SD |
| POP4 | SNV | Missense_Mutation | rs547007300 | c.517C>T | p.Arg173Cys | p.R173C | O95707 | protein_coding | deleterious(0.04) | benign(0.027) | TCGA-4T-AA8H-01 | Colorectum | colon adenocarcinoma | Female | <65 | I/II | Unknown | Unknown | SD |
| POP4 | SNV | Missense_Mutation | rs565503123 | c.116N>T | p.Thr39Met | p.T39M | O95707 | protein_coding | tolerated(0.27) | benign(0) | TCGA-CK-6746-01 | Colorectum | colon adenocarcinoma | Female | >=65 | I/II | Unknown | Unknown | SD |
| POP4 | SNV | Missense_Mutation | novel | c.406C>T | p.His136Tyr | p.H136Y | O95707 | protein_coding | deleterious(0) | probably_damaging(0.997) | TCGA-A5-A0G1-01 | Endometrium | uterine corpus endometrioid carcinoma | Female | >=65 | I/II | Unknown | Unknown | SD |
| POP4 | SNV | Missense_Mutation | rs140893351 | c.41C>T | p.Ala14Val | p.A14V | O95707 | protein_coding | deleterious(0.03) | benign(0.186) | TCGA-A5-A0G2-01 | Endometrium | uterine corpus endometrioid carcinoma | Female | <65 | III/IV | Unknown | Unknown | SD |
| POP4 | SNV | Missense_Mutation | c.607C>T | p.Arg203Trp | p.R203W | O95707 | protein_coding | deleterious(0.02) | probably_damaging(1) | TCGA-AP-A0LM-01 | Endometrium | uterine corpus endometrioid carcinoma | Female | <65 | III/IV | Chemotherapy | cisplatin | SD | |
| POP4 | SNV | Missense_Mutation | rs758843443 | c.131N>T | p.Pro44Leu | p.P44L | O95707 | protein_coding | tolerated(0.2) | benign(0.011) | TCGA-AP-A1DV-01 | Endometrium | uterine corpus endometrioid carcinoma | Female | <65 | I/II | Unknown | Unknown | SD |
| POP4 | SNV | Missense_Mutation | novel | c.500N>G | p.Ile167Ser | p.I167S | O95707 | protein_coding | deleterious(0) | probably_damaging(0.932) | TCGA-AP-A1E0-01 | Endometrium | uterine corpus endometrioid carcinoma | Female | <65 | III/IV | Chemotherapy | paclitaxel | SD |
| POP4 | SNV | Missense_Mutation | c.50N>T | p.Ser17Phe | p.S17F | O95707 | protein_coding | tolerated(0.5) | benign(0) | TCGA-AX-A2H5-01 | Endometrium | uterine corpus endometrioid carcinoma | Female | >=65 | III/IV | Chemotherapy | carboplatin | CR | |
| POP4 | SNV | Missense_Mutation | rs758843443 | c.131N>T | p.Pro44Leu | p.P44L | O95707 | protein_coding | tolerated(0.2) | benign(0.011) | TCGA-AX-A2HD-01 | Endometrium | uterine corpus endometrioid carcinoma | Female | >=65 | III/IV | Unknown | Unknown | SD |
| Page: 1 2 3 |
Top |
Related drugs of malignant transformation related genes |
| Identification of chemicals and drugs interact with genes involved in malignant transfromation |
| (DGIdb 4.0) |
| Entrez ID | Symbol | Category | Interaction Types | Drug Claim Name | Drug Name | PMIDs |
| Page: 1 |

Copyright 2023-Present -The University of Texas Health Science Center at Houston |