
|
|||||
|
 | |
| |
| |
| |
| |
| |
|
Gene: POP1 |
Gene summary for POP1 |
| Gene information | Species | Human | Gene symbol | POP1 | Gene ID | 10940 |
| Gene name | POP1 homolog, ribonuclease P/MRP subunit | |
| Gene Alias | ANXD2 | |
| Cytomap | 8q22.2 | |
| Gene Type | protein-coding | GO ID | GO:0000966 | UniProtAcc | Q99575 |
Top |
Malignant transformation analysis |
| Identification of the aberrant gene expression in precancerous and cancerous lesions by comparing the gene expression of stem-like cells in diseased tissues with normal stem cells |
| Entrez ID | Symbol | Replicates | Species | Organ | Tissue | Adj P-value | Log2FC | Malignancy |
| 10940 | POP1 | P2T-E | Human | Esophagus | ESCC | 3.08e-12 | 1.79e-01 | 0.1177 |
| 10940 | POP1 | P4T-E | Human | Esophagus | ESCC | 3.09e-03 | 1.51e-01 | 0.1323 |
| 10940 | POP1 | P5T-E | Human | Esophagus | ESCC | 9.22e-10 | 2.04e-01 | 0.1327 |
| 10940 | POP1 | P8T-E | Human | Esophagus | ESCC | 2.47e-06 | 1.08e-01 | 0.0889 |
| 10940 | POP1 | P9T-E | Human | Esophagus | ESCC | 2.42e-05 | 1.10e-01 | 0.1131 |
| 10940 | POP1 | P10T-E | Human | Esophagus | ESCC | 2.86e-08 | 1.32e-01 | 0.116 |
| 10940 | POP1 | P11T-E | Human | Esophagus | ESCC | 4.81e-03 | 1.50e-01 | 0.1426 |
| 10940 | POP1 | P12T-E | Human | Esophagus | ESCC | 1.07e-03 | 1.01e-01 | 0.1122 |
| 10940 | POP1 | P16T-E | Human | Esophagus | ESCC | 3.48e-09 | 2.36e-01 | 0.1153 |
| 10940 | POP1 | P17T-E | Human | Esophagus | ESCC | 2.37e-09 | 2.72e-01 | 0.1278 |
| 10940 | POP1 | P20T-E | Human | Esophagus | ESCC | 8.56e-16 | 3.89e-01 | 0.1124 |
| 10940 | POP1 | P21T-E | Human | Esophagus | ESCC | 3.67e-15 | 3.03e-01 | 0.1617 |
| 10940 | POP1 | P22T-E | Human | Esophagus | ESCC | 5.04e-09 | 1.98e-01 | 0.1236 |
| 10940 | POP1 | P23T-E | Human | Esophagus | ESCC | 1.74e-04 | 1.73e-01 | 0.108 |
| 10940 | POP1 | P24T-E | Human | Esophagus | ESCC | 4.15e-07 | 8.37e-02 | 0.1287 |
| 10940 | POP1 | P26T-E | Human | Esophagus | ESCC | 2.19e-07 | 1.41e-01 | 0.1276 |
| 10940 | POP1 | P27T-E | Human | Esophagus | ESCC | 3.39e-18 | 1.60e-01 | 0.1055 |
| 10940 | POP1 | P28T-E | Human | Esophagus | ESCC | 6.81e-14 | 2.87e-01 | 0.1149 |
| 10940 | POP1 | P30T-E | Human | Esophagus | ESCC | 5.55e-08 | 3.56e-01 | 0.137 |
| 10940 | POP1 | P31T-E | Human | Esophagus | ESCC | 6.83e-24 | 4.72e-01 | 0.1251 |
| Page: 1 2 3 |
| Tissue | Expression Dynamics | Abbreviation |
| Esophagus | 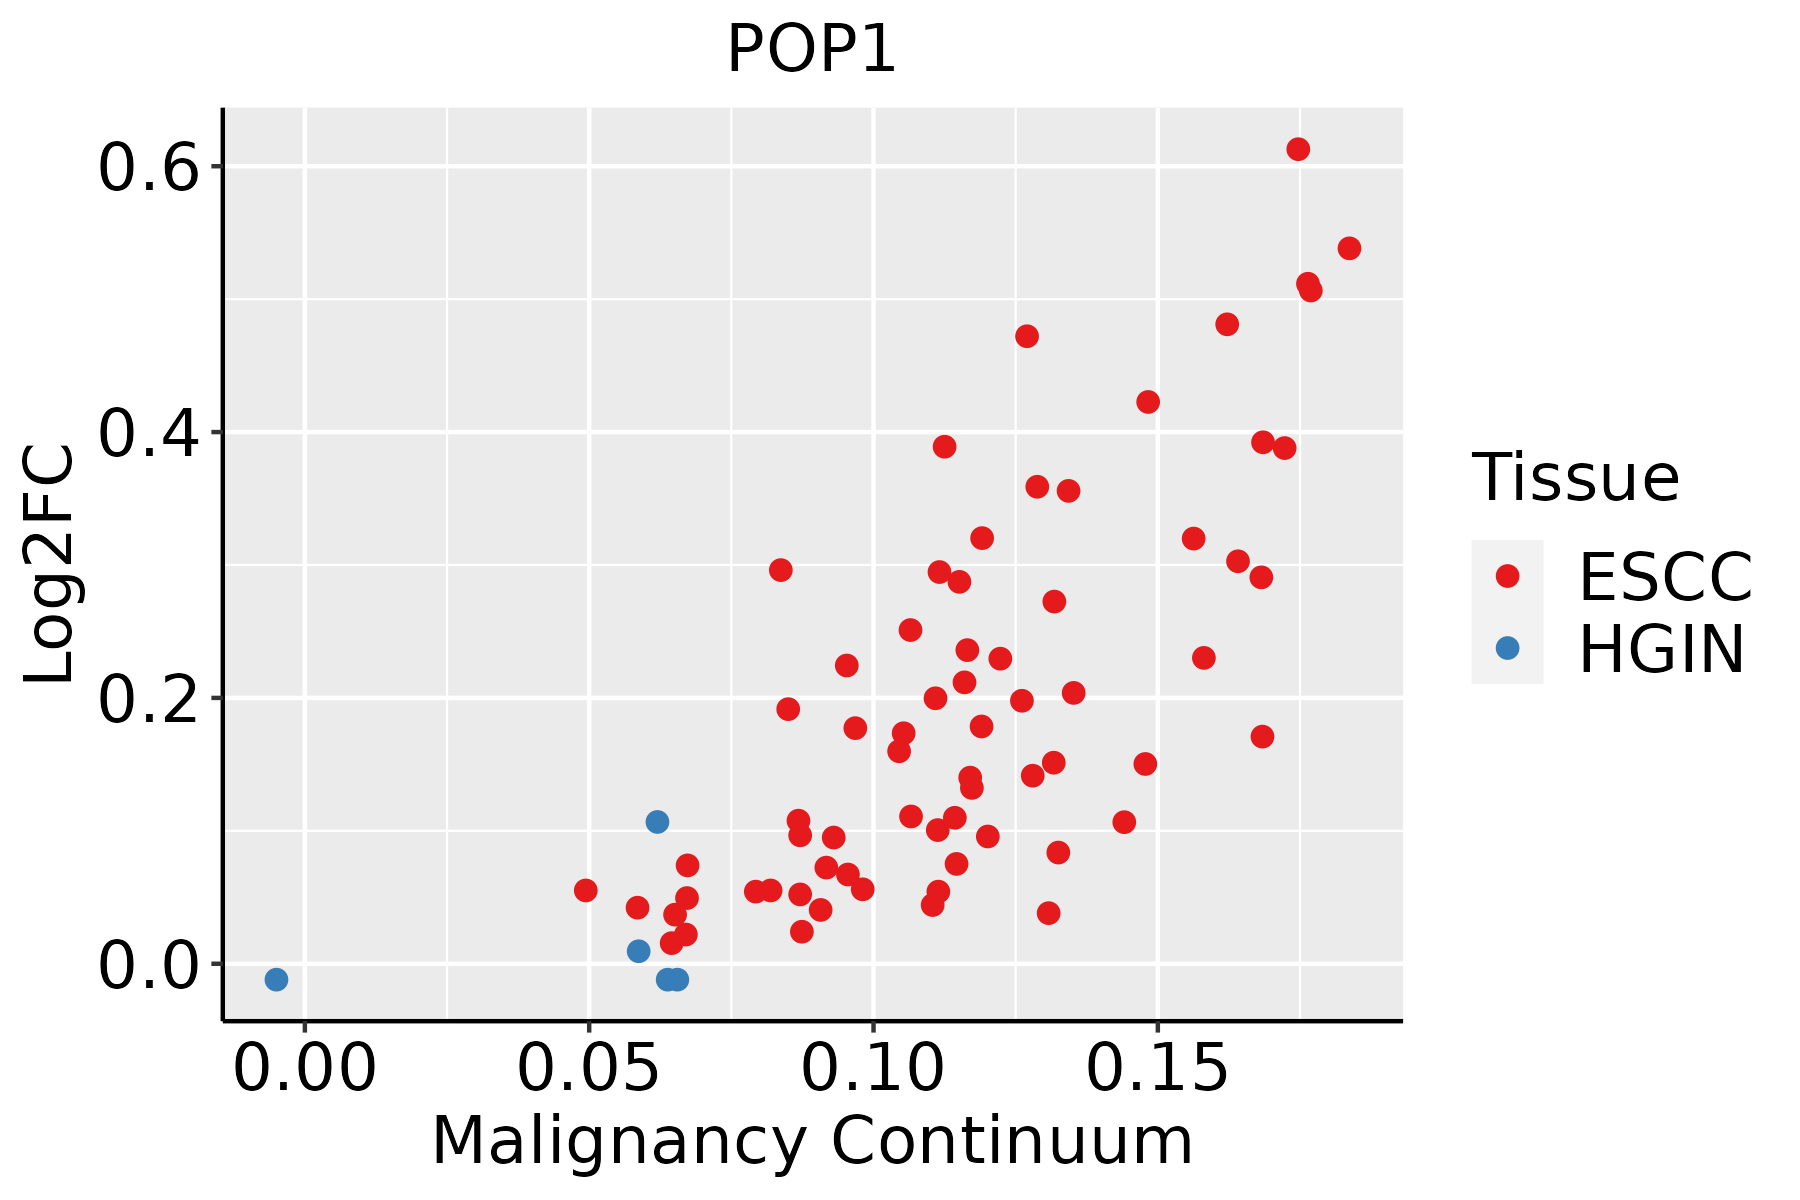 | ESCC: Esophageal squamous cell carcinoma |
| HGIN: High-grade intraepithelial neoplasias | ||
| LGIN: Low-grade intraepithelial neoplasias | ||
| Oral Cavity |  | EOLP: Erosive Oral lichen planus |
| LP: leukoplakia | ||
| NEOLP: Non-erosive oral lichen planus | ||
| OSCC: Oral squamous cell carcinoma |
| ∗log2FC in expression of this searched gene in stem-like cells from each diseased tissue sample relative to stem-like cells in normal samples in each tissue plotted against the malignancy continuum. Samples are colored based on if they are from different disease stage. |
Top |
Malignant transformation related pathway analysis |
| Find out the enriched GO biological processes and KEGG pathways involved in transition from healthy to precancer to cancer |
| Tissue | Disease Stage | Enriched GO biological Processes |
| Colorectum | AD |  |
| Colorectum | SER |  |
| Colorectum | MSS |  |
| Colorectum | MSI-H |  |
| Colorectum | FAP |  |
| ∗Top 15 enriched GO BP terms are showed in the bar plot of each disease state in each tissue. Each row represents a significant GO biological process which is colored according to the -log10(p.adjust). |
| Page: 1 2 3 4 5 6 7 8 9 |
| GO ID | Tissue | Disease Stage | Description | Gene Ratio | Bg Ratio | pvalue | p.adjust | Count |
| GO:003447015 | Esophagus | ESCC | ncRNA processing | 300/8552 | 395/18723 | 3.09e-35 | 3.26e-32 | 300 |
| GO:003466012 | Esophagus | ESCC | ncRNA metabolic process | 346/8552 | 485/18723 | 4.35e-31 | 2.51e-28 | 346 |
| GO:0006401110 | Esophagus | ESCC | RNA catabolic process | 204/8552 | 278/18723 | 3.39e-21 | 5.66e-19 | 204 |
| GO:0034655110 | Esophagus | ESCC | nucleobase-containing compound catabolic process | 272/8552 | 407/18723 | 2.92e-18 | 2.90e-16 | 272 |
| GO:004670018 | Esophagus | ESCC | heterocycle catabolic process | 286/8552 | 445/18723 | 1.12e-15 | 7.47e-14 | 286 |
| GO:004427019 | Esophagus | ESCC | cellular nitrogen compound catabolic process | 288/8552 | 451/18723 | 3.03e-15 | 1.79e-13 | 288 |
| GO:001943918 | Esophagus | ESCC | aromatic compound catabolic process | 295/8552 | 467/18723 | 1.09e-14 | 5.98e-13 | 295 |
| GO:190136118 | Esophagus | ESCC | organic cyclic compound catabolic process | 307/8552 | 495/18723 | 9.99e-14 | 4.80e-12 | 307 |
| GO:00905013 | Esophagus | ESCC | RNA phosphodiester bond hydrolysis | 110/8552 | 152/18723 | 1.95e-11 | 6.81e-10 | 110 |
| GO:00080333 | Esophagus | ESCC | tRNA processing | 92/8552 | 127/18723 | 7.83e-10 | 1.93e-08 | 92 |
| GO:00063992 | Esophagus | ESCC | tRNA metabolic process | 122/8552 | 179/18723 | 9.03e-10 | 2.19e-08 | 122 |
| GO:00903053 | Esophagus | ESCC | nucleic acid phosphodiester bond hydrolysis | 163/8552 | 261/18723 | 3.07e-08 | 5.73e-07 | 163 |
| GO:00346613 | Esophagus | ESCC | ncRNA catabolic process | 33/8552 | 43/18723 | 3.25e-05 | 2.69e-04 | 33 |
| GO:00905023 | Esophagus | ESCC | RNA phosphodiester bond hydrolysis, endonucleolytic | 55/8552 | 82/18723 | 7.34e-05 | 5.51e-04 | 55 |
| GO:00344713 | Esophagus | ESCC | ncRNA 5'-end processing | 18/8552 | 21/18723 | 1.81e-04 | 1.16e-03 | 18 |
| GO:00009663 | Esophagus | ESCC | RNA 5'-end processing | 19/8552 | 23/18723 | 3.12e-04 | 1.85e-03 | 19 |
| GO:00991163 | Esophagus | ESCC | tRNA 5'-end processing | 14/8552 | 16/18723 | 6.78e-04 | 3.56e-03 | 14 |
| GO:00016823 | Esophagus | ESCC | tRNA 5'-leader removal | 11/8552 | 13/18723 | 4.76e-03 | 1.85e-02 | 11 |
| GO:00160782 | Esophagus | ESCC | tRNA catabolic process | 11/8552 | 13/18723 | 4.76e-03 | 1.85e-02 | 11 |
| GO:00344709 | Oral cavity | OSCC | ncRNA processing | 263/7305 | 395/18723 | 4.38e-29 | 2.78e-26 | 263 |
| Page: 1 2 |
| Pathway ID | Tissue | Disease Stage | Description | Gene Ratio | Bg Ratio | pvalue | p.adjust | qvalue | Count |
| Page: 1 |
Top |
Cell-cell communication analysis |
| Identification of potential cell-cell interactions between two cell types and their ligand-receptor pairs for different disease states |
| Ligand | Receptor | LRpair | Pathway | Tissue | Disease Stage |
| Page: 1 |
Top |
Single-cell gene regulatory network inference analysis |
| Find out the significant the regulons (TFs) and the target genes of each regulon across cell types for different disease states |
| TF | Cell Type | Tissue | Disease Stage | Target Gene | RSS | Regulon Activity |
| ∗The dot plots of a searched regulon are shown for all cell subpopulations in each disease state of each tissue based on the regulon specific score inferred using pySCENIC and by calculating the average expression. |
| Page: 1 |
Top |
Somatic mutation of malignant transformation related genes |
| Annotation of somatic variants for genes involved in malignant transformation |
| Hugo Symbol | Variant Class | Variant Classification | dbSNP RS | HGVSc | HGVSp | HGVSp Short | SWISSPROT | BIOTYPE | SIFT | PolyPhen | Tumor Sample Barcode | Tissue | Histology | Sex | Age | Stage | Therapy Types | Drugs | Outcome |
| POP1 | SNV | Missense_Mutation | c.3051N>G | p.Phe1017Leu | p.F1017L | Q99575 | protein_coding | deleterious(0.03) | benign(0.052) | TCGA-A2-A04T-01 | Breast | breast invasive carcinoma | Female | <65 | I/II | Chemotherapy | cyclophosphamide | SD | |
| POP1 | SNV | Missense_Mutation | novel | c.2557N>A | p.Pro853Thr | p.P853T | Q99575 | protein_coding | deleterious(0.01) | possibly_damaging(0.811) | TCGA-A2-A1FW-01 | Breast | breast invasive carcinoma | Female | <65 | III/IV | Chemotherapy | cytoxan | SD |
| POP1 | SNV | Missense_Mutation | c.2461N>T | p.Pro821Ser | p.P821S | Q99575 | protein_coding | tolerated(0.09) | probably_damaging(0.987) | TCGA-A8-A09Z-01 | Breast | breast invasive carcinoma | Female | >=65 | I/II | Unknown | Unknown | SD | |
| POP1 | SNV | Missense_Mutation | novel | c.91G>A | p.Gly31Ser | p.G31S | Q99575 | protein_coding | tolerated(0.24) | benign(0.033) | TCGA-AO-A0JD-01 | Breast | breast invasive carcinoma | Female | <65 | III/IV | Chemotherapy | cyclophosphamide | SD |
| POP1 | SNV | Missense_Mutation | c.2071N>G | p.Lys691Glu | p.K691E | Q99575 | protein_coding | deleterious(0) | probably_damaging(0.963) | TCGA-B6-A1KN-01 | Breast | breast invasive carcinoma | Female | <65 | III/IV | Unknown | Unknown | SD | |
| POP1 | SNV | Missense_Mutation | c.667G>C | p.Gly223Arg | p.G223R | Q99575 | protein_coding | deleterious(0) | probably_damaging(0.991) | TCGA-BH-A0BL-01 | Breast | breast invasive carcinoma | Female | <65 | I/II | Chemotherapy | adriamycin | CR | |
| POP1 | SNV | Missense_Mutation | c.1745N>T | p.Pro582Leu | p.P582L | Q99575 | protein_coding | deleterious(0) | probably_damaging(0.934) | TCGA-BH-A0BZ-01 | Breast | breast invasive carcinoma | Female | <65 | III/IV | Chemotherapy | doxorubicin | CR | |
| POP1 | SNV | Missense_Mutation | c.107N>C | p.Ser36Thr | p.S36T | Q99575 | protein_coding | tolerated(0.2) | benign(0.01) | TCGA-BH-A0DK-01 | Breast | breast invasive carcinoma | Female | <65 | I/II | Hormone Therapy | tamoxiphen | SD | |
| POP1 | insertion | Frame_Shift_Ins | novel | c.981_982insAGAAAGAAACT | p.Trp328ArgfsTer17 | p.W328Rfs*17 | Q99575 | protein_coding | TCGA-A2-A0CU-01 | Breast | breast invasive carcinoma | Female | >=65 | I/II | Hormone Therapy | tamoxiphen | SD | ||
| POP1 | insertion | Nonsense_Mutation | novel | c.983_984insAAGCTCTCATTACTCATTTAACACATATTTGTTGA | p.Trp328Ter | p.W328* | Q99575 | protein_coding | TCGA-A2-A0CU-01 | Breast | breast invasive carcinoma | Female | >=65 | I/II | Hormone Therapy | tamoxiphen | SD |
| Page: 1 2 3 4 5 6 7 8 9 10 11 12 13 |
Top |
Related drugs of malignant transformation related genes |
| Identification of chemicals and drugs interact with genes involved in malignant transfromation |
| (DGIdb 4.0) |
| Entrez ID | Symbol | Category | Interaction Types | Drug Claim Name | Drug Name | PMIDs |
| Page: 1 |

Copyright 2023-Present -The University of Texas Health Science Center at Houston |