
|
|||||
|
 | |
| |
| |
| |
| |
| |
|
Gene: PON2 |
Gene summary for PON2 |
| Gene information | Species | Human | Gene symbol | PON2 | Gene ID | 5445 |
| Gene name | paraoxonase 2 | |
| Gene Alias | PON2 | |
| Cytomap | 7q21.3 | |
| Gene Type | protein-coding | GO ID | GO:0006725 | UniProtAcc | A0A0J9YYG4 |
Top |
Malignant transformation analysis |
| Identification of the aberrant gene expression in precancerous and cancerous lesions by comparing the gene expression of stem-like cells in diseased tissues with normal stem cells |
| Entrez ID | Symbol | Replicates | Species | Organ | Tissue | Adj P-value | Log2FC | Malignancy |
| 5445 | PON2 | LZE2T | Human | Esophagus | ESCC | 2.50e-02 | 6.18e-01 | 0.082 |
| 5445 | PON2 | LZE4T | Human | Esophagus | ESCC | 4.43e-08 | 2.67e-01 | 0.0811 |
| 5445 | PON2 | LZE5T | Human | Esophagus | ESCC | 6.72e-04 | 6.60e-01 | 0.0514 |
| 5445 | PON2 | LZE7T | Human | Esophagus | ESCC | 4.42e-08 | 6.60e-01 | 0.0667 |
| 5445 | PON2 | LZE8T | Human | Esophagus | ESCC | 3.57e-07 | 3.84e-01 | 0.067 |
| 5445 | PON2 | LZE22T | Human | Esophagus | ESCC | 1.90e-07 | 8.70e-01 | 0.068 |
| 5445 | PON2 | LZE6T | Human | Esophagus | ESCC | 1.03e-02 | 5.38e-01 | 0.0845 |
| 5445 | PON2 | P1T-E | Human | Esophagus | ESCC | 2.29e-09 | 6.73e-01 | 0.0875 |
| 5445 | PON2 | P2T-E | Human | Esophagus | ESCC | 9.02e-56 | 1.05e+00 | 0.1177 |
| 5445 | PON2 | P4T-E | Human | Esophagus | ESCC | 4.25e-32 | 8.69e-01 | 0.1323 |
| 5445 | PON2 | P5T-E | Human | Esophagus | ESCC | 9.22e-30 | 7.32e-01 | 0.1327 |
| 5445 | PON2 | P8T-E | Human | Esophagus | ESCC | 6.51e-45 | 8.84e-01 | 0.0889 |
| 5445 | PON2 | P9T-E | Human | Esophagus | ESCC | 1.61e-18 | 5.69e-01 | 0.1131 |
| 5445 | PON2 | P10T-E | Human | Esophagus | ESCC | 1.88e-50 | 9.56e-01 | 0.116 |
| 5445 | PON2 | P11T-E | Human | Esophagus | ESCC | 1.59e-29 | 1.19e+00 | 0.1426 |
| 5445 | PON2 | P12T-E | Human | Esophagus | ESCC | 1.24e-56 | 9.41e-01 | 0.1122 |
| 5445 | PON2 | P15T-E | Human | Esophagus | ESCC | 4.19e-44 | 1.22e+00 | 0.1149 |
| 5445 | PON2 | P16T-E | Human | Esophagus | ESCC | 4.92e-57 | 1.14e+00 | 0.1153 |
| 5445 | PON2 | P17T-E | Human | Esophagus | ESCC | 4.82e-13 | 8.85e-01 | 0.1278 |
| 5445 | PON2 | P19T-E | Human | Esophagus | ESCC | 5.40e-13 | 1.11e+00 | 0.1662 |
| Page: 1 2 3 4 5 6 7 8 |
| Tissue | Expression Dynamics | Abbreviation |
| Esophagus | 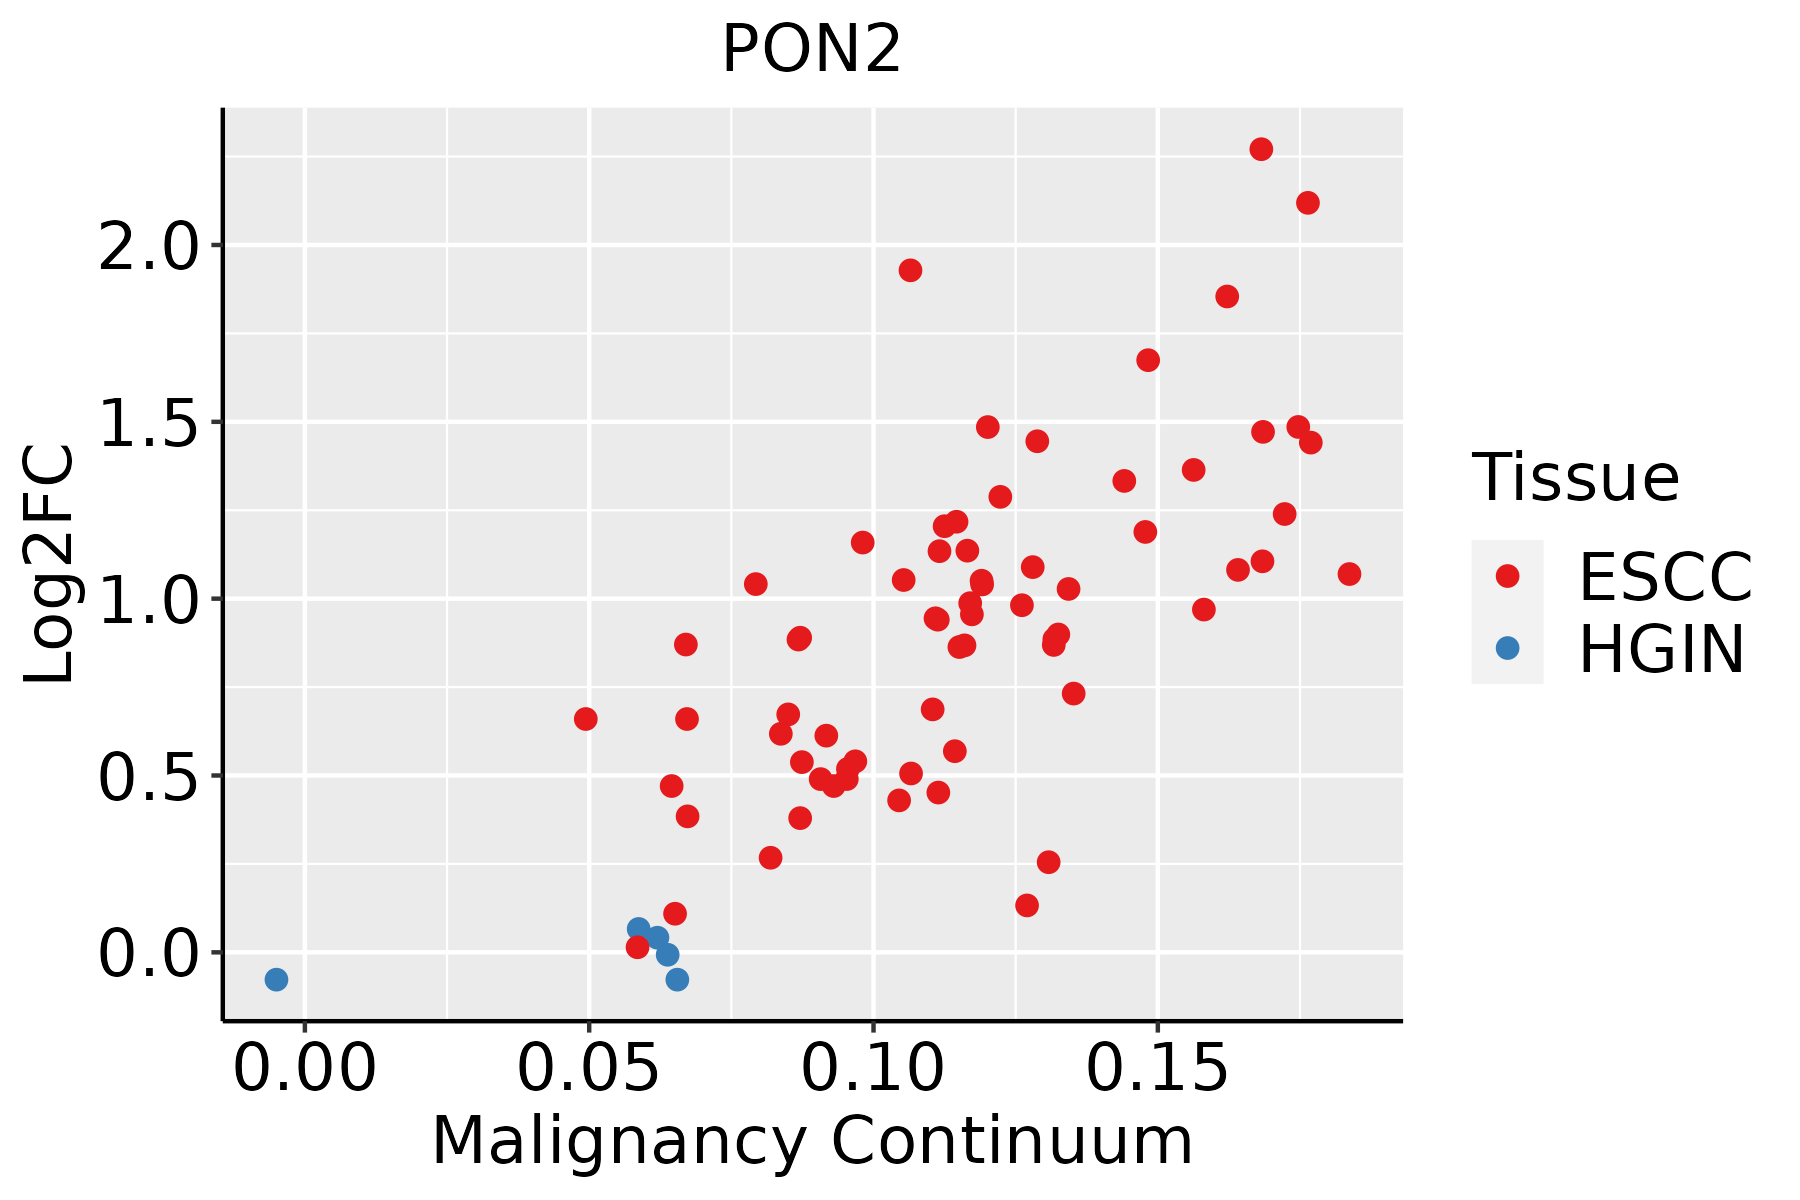 | ESCC: Esophageal squamous cell carcinoma |
| HGIN: High-grade intraepithelial neoplasias | ||
| LGIN: Low-grade intraepithelial neoplasias | ||
| GC | 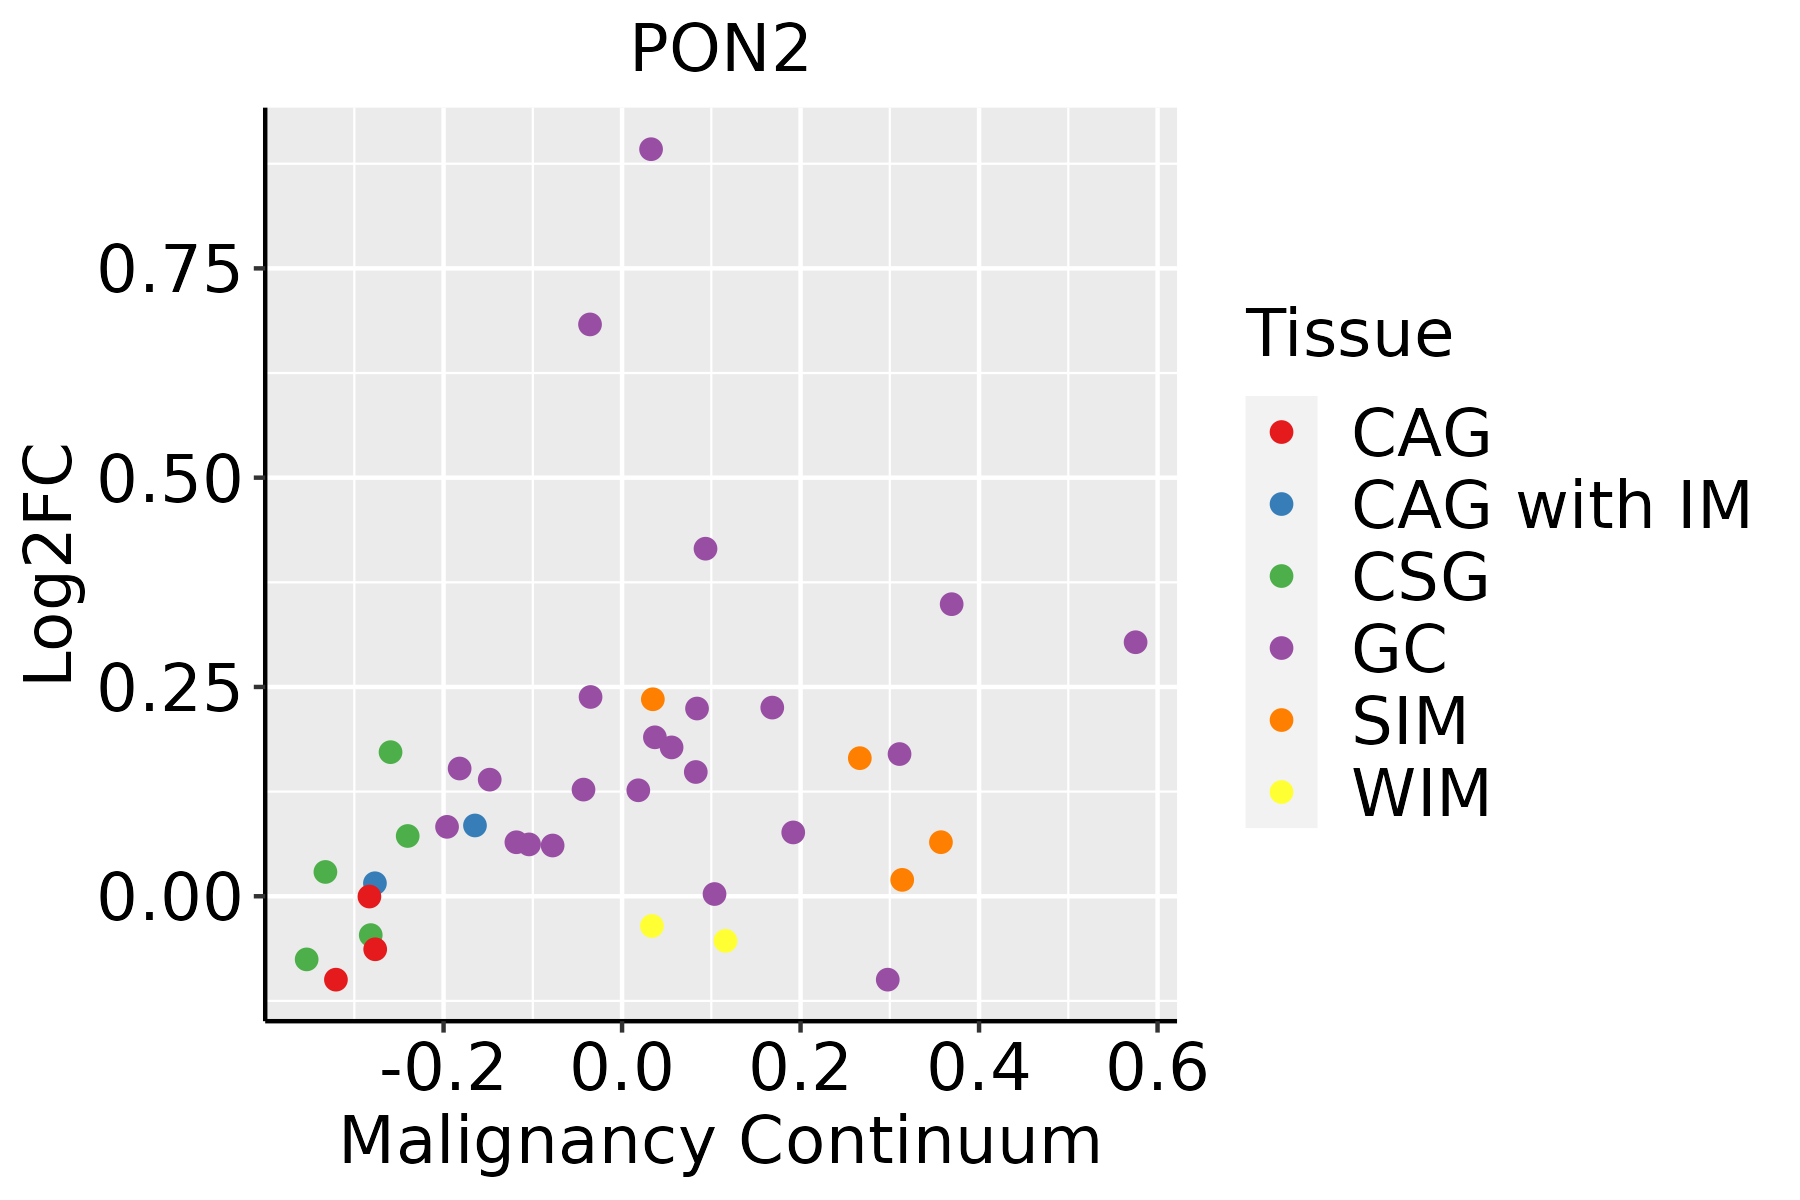 | CAG: Chronic atrophic gastritis |
| CAG with IM: Chronic atrophic gastritis with intestinal metaplasia | ||
| CSG: Chronic superficial gastritis | ||
| GC: Gastric cancer | ||
| SIM: Severe intestinal metaplasia | ||
| WIM: Wild intestinal metaplasia | ||
| Liver | 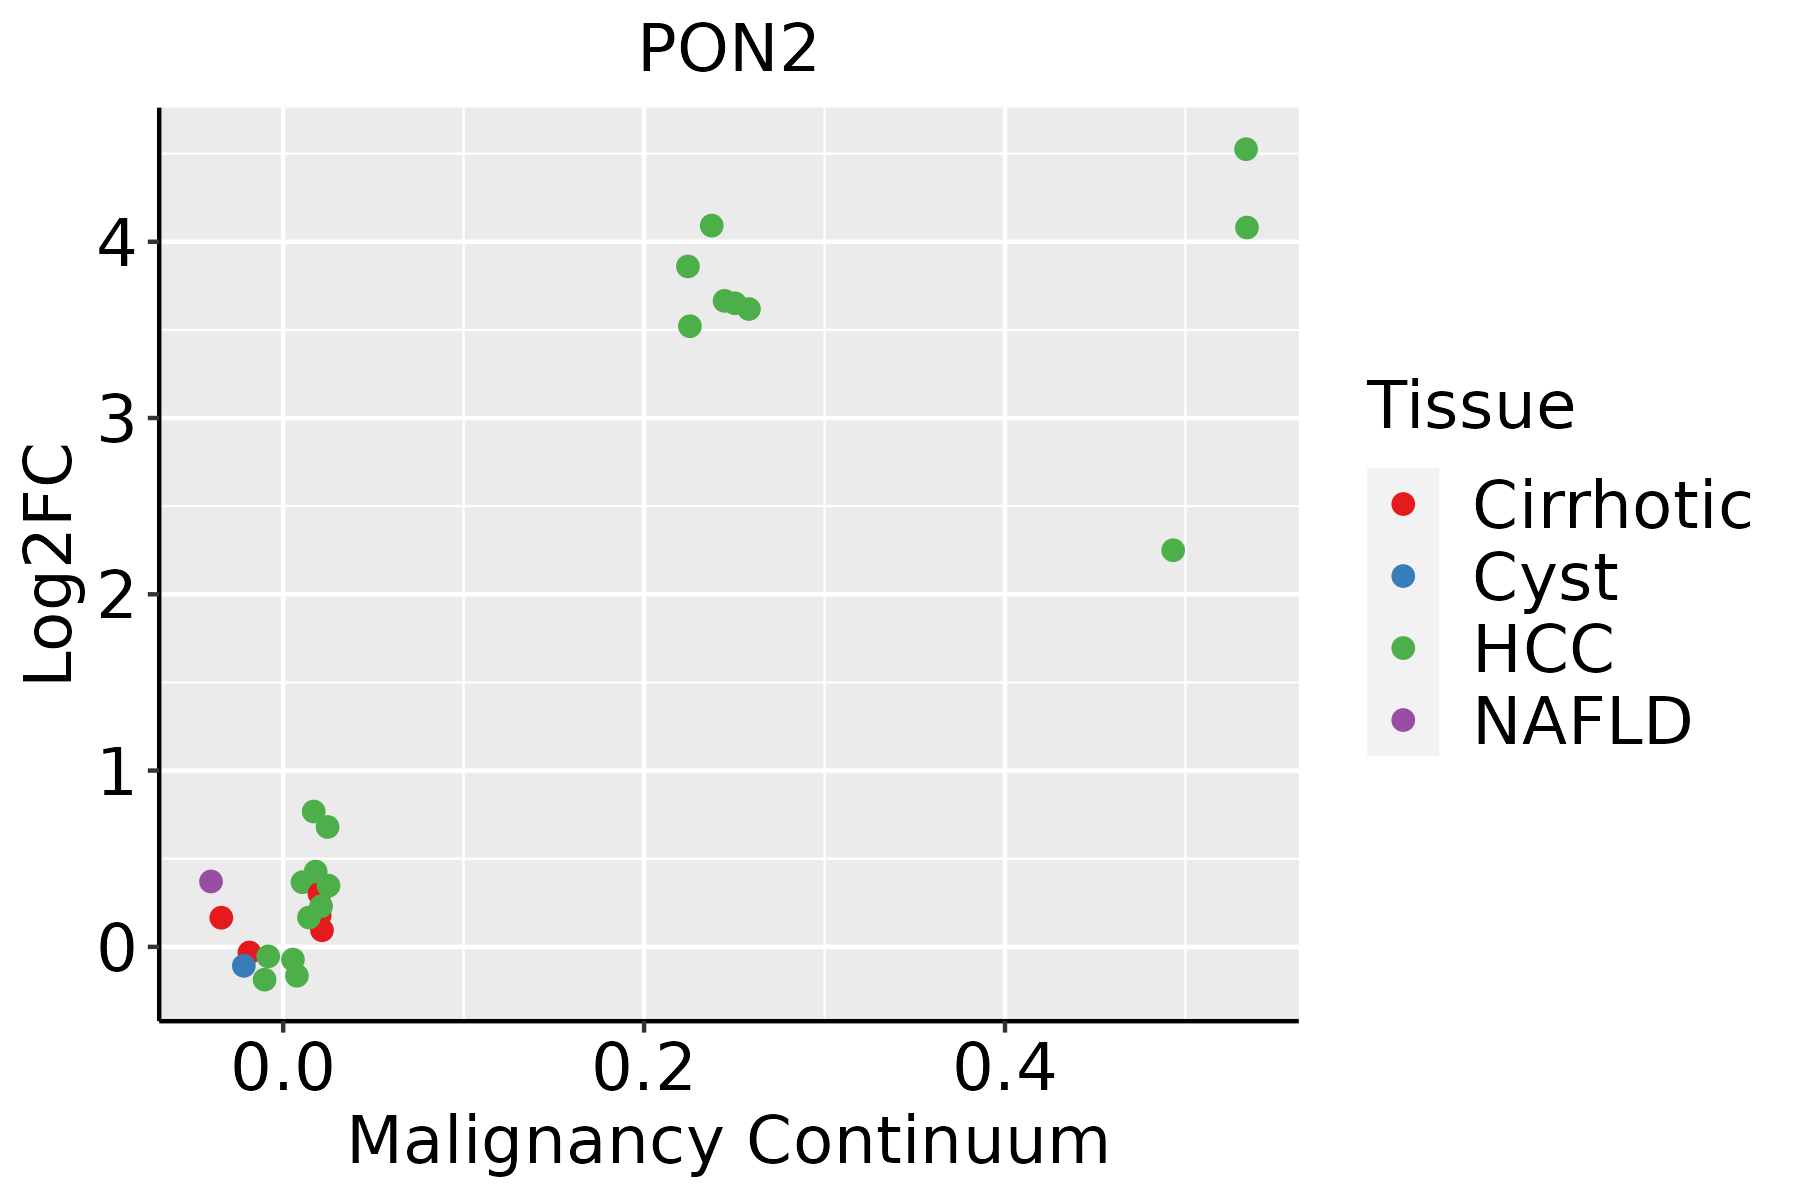 | HCC: Hepatocellular carcinoma |
| NAFLD: Non-alcoholic fatty liver disease | ||
| Lung | 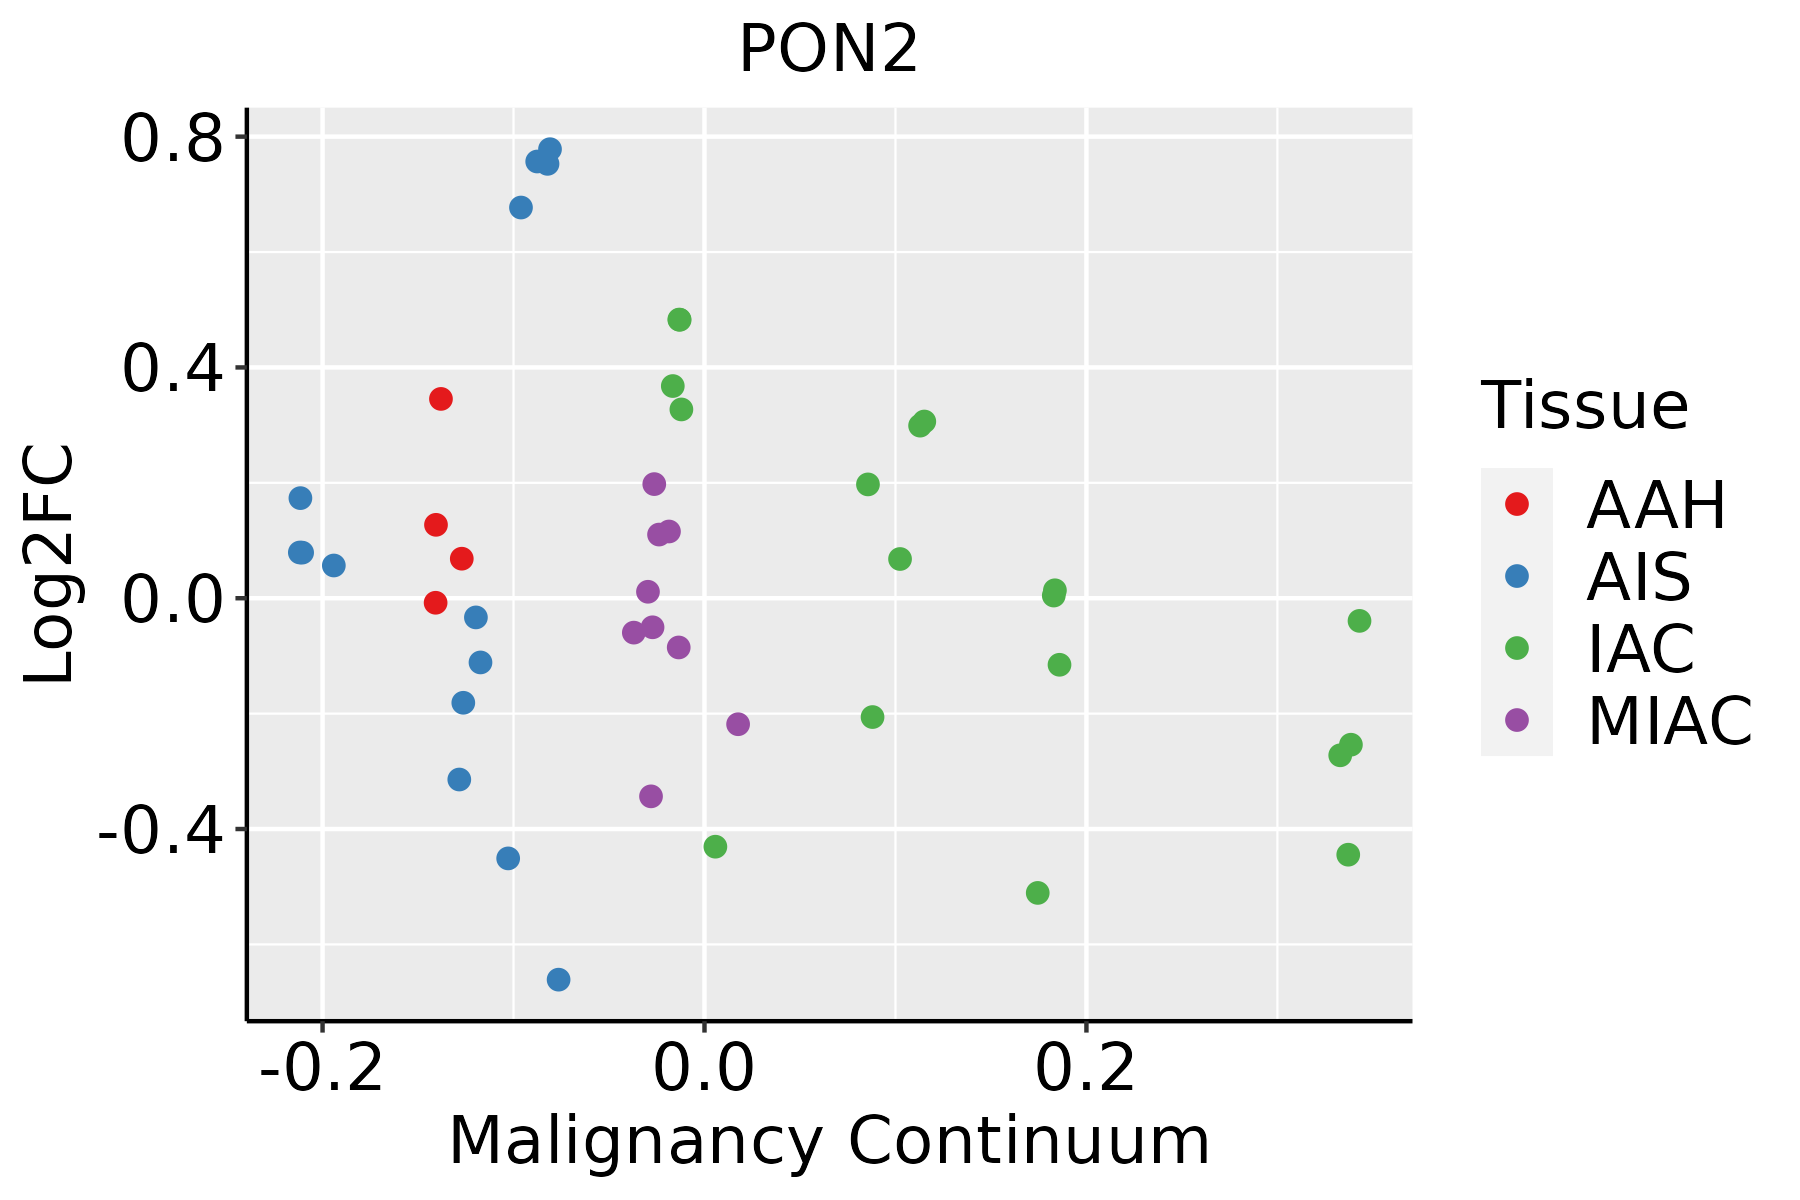 | AAH: Atypical adenomatous hyperplasia |
| AIS: Adenocarcinoma in situ | ||
| IAC: Invasive lung adenocarcinoma | ||
| MIA: Minimally invasive adenocarcinoma | ||
| Oral Cavity |  | EOLP: Erosive Oral lichen planus |
| LP: leukoplakia | ||
| NEOLP: Non-erosive oral lichen planus | ||
| OSCC: Oral squamous cell carcinoma | ||
| Skin | 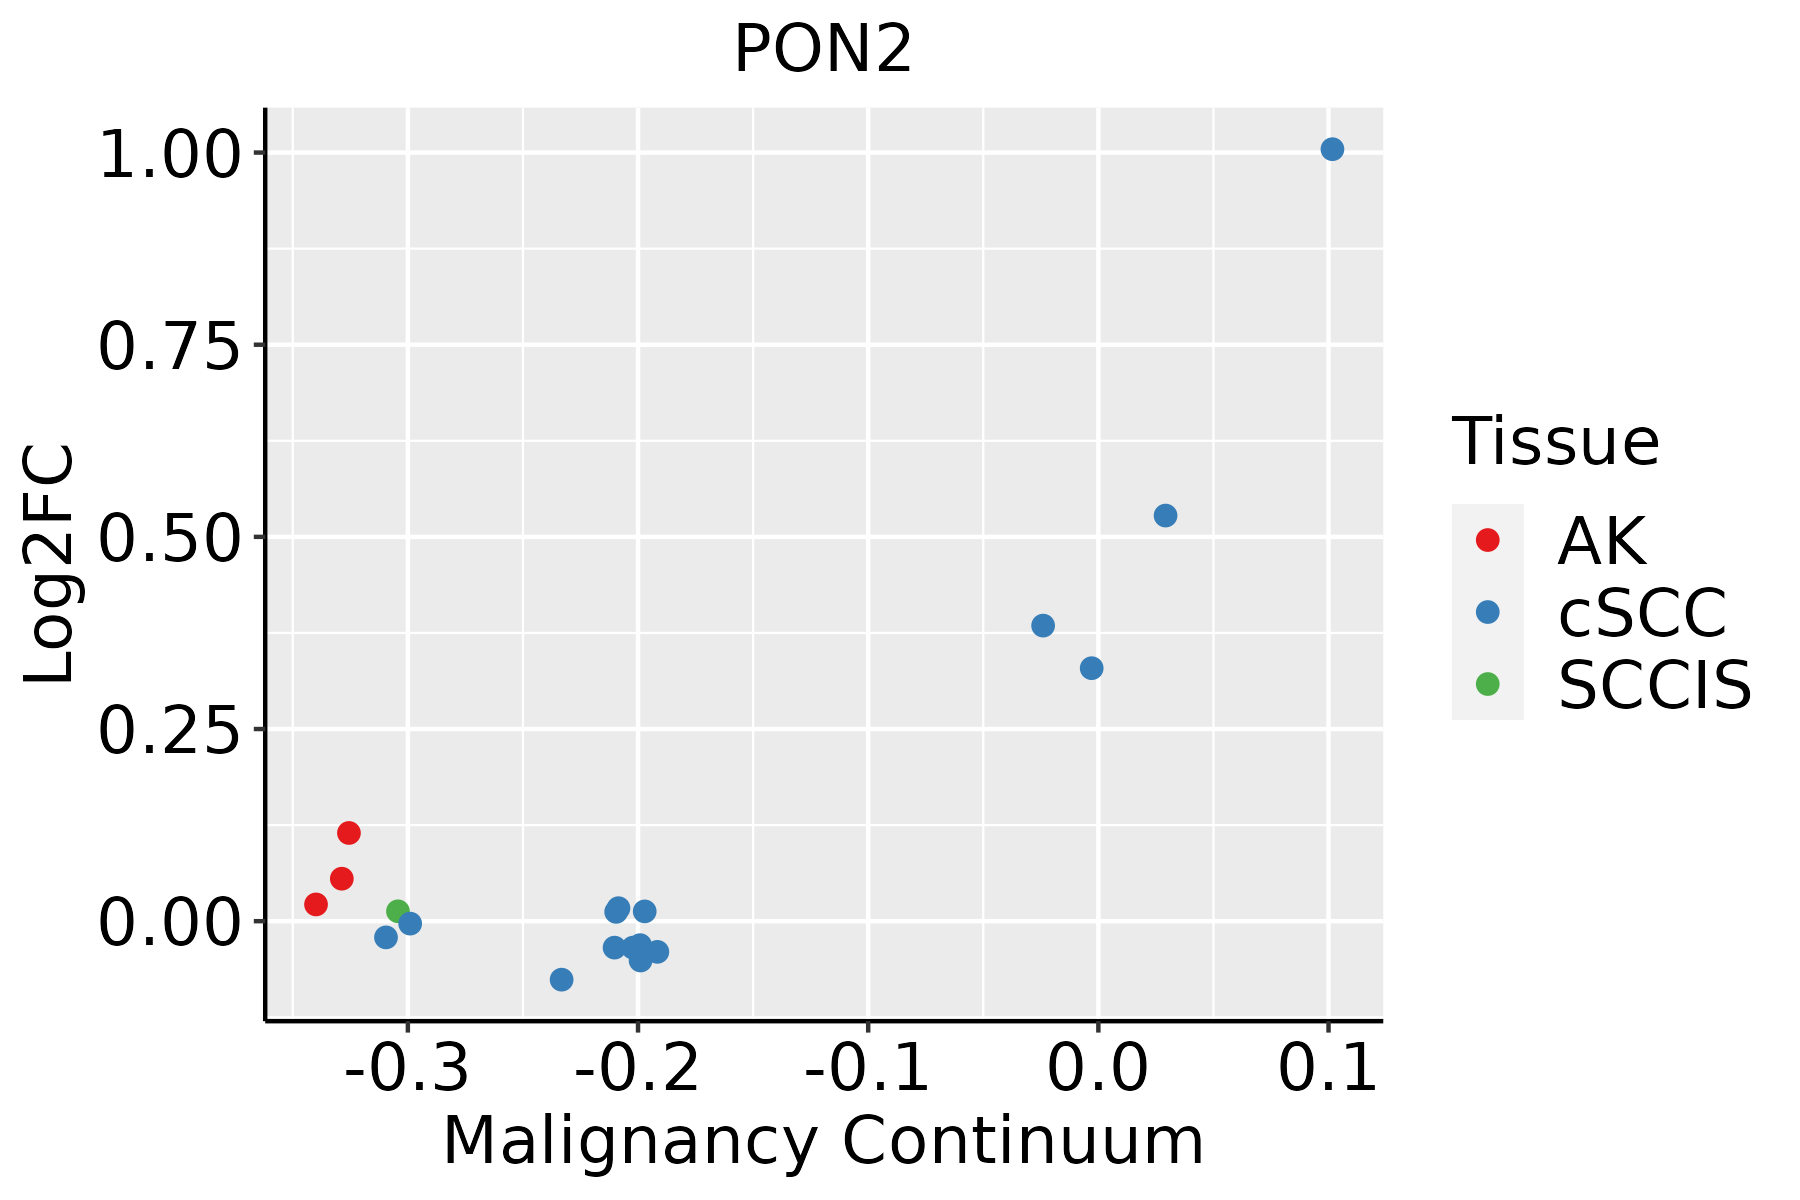 | AK: Actinic keratosis |
| cSCC: Cutaneous squamous cell carcinoma | ||
| SCCIS:squamous cell carcinoma in situ | ||
| Thyroid | 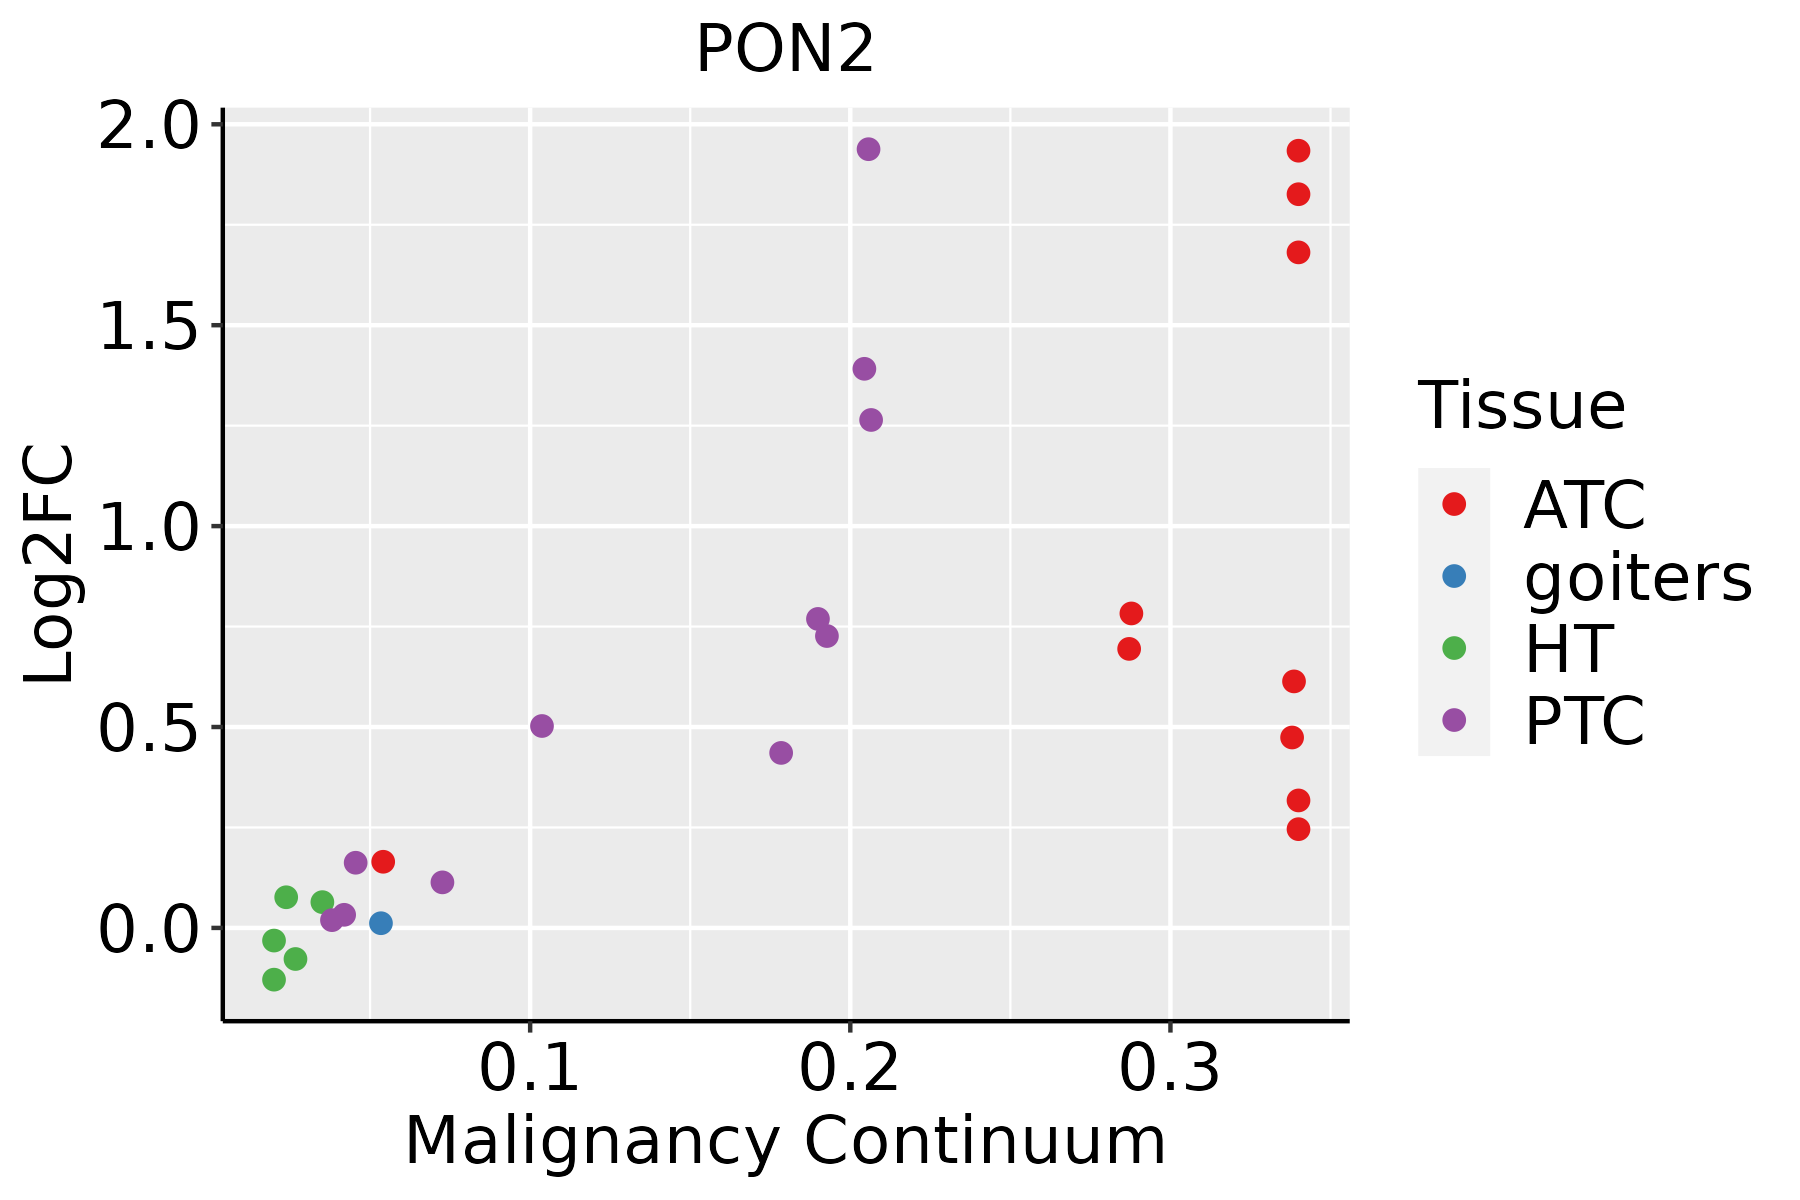 | ATC: Anaplastic thyroid cancer |
| HT: Hashimoto's thyroiditis | ||
| PTC: Papillary thyroid cancer |
| ∗log2FC in expression of this searched gene in stem-like cells from each diseased tissue sample relative to stem-like cells in normal samples in each tissue plotted against the malignancy continuum. Samples are colored based on if they are from different disease stage. |
Top |
Malignant transformation related pathway analysis |
| Find out the enriched GO biological processes and KEGG pathways involved in transition from healthy to precancer to cancer |
| Tissue | Disease Stage | Enriched GO biological Processes |
| Colorectum | AD |  |
| Colorectum | SER |  |
| Colorectum | MSS |  |
| Colorectum | MSI-H |  |
| Colorectum | FAP |  |
| ∗Top 15 enriched GO BP terms are showed in the bar plot of each disease state in each tissue. Each row represents a significant GO biological process which is colored according to the -log10(p.adjust). |
| Page: 1 2 3 4 5 6 7 8 9 |
| GO ID | Tissue | Disease Stage | Description | Gene Ratio | Bg Ratio | pvalue | p.adjust | Count |
| GO:000223710 | Endometrium | AEH | response to molecule of bacterial origin | 65/2100 | 363/18723 | 9.00e-05 | 1.30e-03 | 65 |
| GO:003249610 | Endometrium | AEH | response to lipopolysaccharide | 62/2100 | 343/18723 | 9.82e-05 | 1.41e-03 | 62 |
| GO:00096159 | Endometrium | AEH | response to virus | 63/2100 | 367/18723 | 3.81e-04 | 4.10e-03 | 63 |
| GO:00712229 | Endometrium | AEH | cellular response to lipopolysaccharide | 37/2100 | 209/18723 | 3.30e-03 | 2.31e-02 | 37 |
| GO:00712169 | Endometrium | AEH | cellular response to biotic stimulus | 42/2100 | 246/18723 | 3.65e-03 | 2.50e-02 | 42 |
| GO:00018198 | Endometrium | AEH | positive regulation of cytokine production | 71/2100 | 467/18723 | 4.76e-03 | 3.02e-02 | 71 |
| GO:00712199 | Endometrium | AEH | cellular response to molecule of bacterial origin | 37/2100 | 221/18723 | 8.34e-03 | 4.56e-02 | 37 |
| GO:000223714 | Endometrium | EEC | response to molecule of bacterial origin | 68/2168 | 363/18723 | 3.96e-05 | 6.64e-04 | 68 |
| GO:003249614 | Endometrium | EEC | response to lipopolysaccharide | 65/2168 | 343/18723 | 4.04e-05 | 6.75e-04 | 65 |
| GO:000961513 | Endometrium | EEC | response to virus | 66/2168 | 367/18723 | 1.78e-04 | 2.20e-03 | 66 |
| GO:007122213 | Endometrium | EEC | cellular response to lipopolysaccharide | 40/2168 | 209/18723 | 9.31e-04 | 8.37e-03 | 40 |
| GO:007121613 | Endometrium | EEC | cellular response to biotic stimulus | 45/2168 | 246/18723 | 1.24e-03 | 1.03e-02 | 45 |
| GO:007121913 | Endometrium | EEC | cellular response to molecule of bacterial origin | 40/2168 | 221/18723 | 2.73e-03 | 1.97e-02 | 40 |
| GO:000181913 | Endometrium | EEC | positive regulation of cytokine production | 73/2168 | 467/18723 | 4.64e-03 | 2.97e-02 | 73 |
| GO:0006979111 | Esophagus | ESCC | response to oxidative stress | 303/8552 | 446/18723 | 7.15e-22 | 1.30e-19 | 303 |
| GO:001943918 | Esophagus | ESCC | aromatic compound catabolic process | 295/8552 | 467/18723 | 1.09e-14 | 5.98e-13 | 295 |
| GO:000961518 | Esophagus | ESCC | response to virus | 238/8552 | 367/18723 | 6.65e-14 | 3.32e-12 | 238 |
| GO:00516075 | Esophagus | ESCC | defense response to virus | 171/8552 | 265/18723 | 3.91e-10 | 1.05e-08 | 171 |
| GO:01405465 | Esophagus | ESCC | defense response to symbiont | 171/8552 | 265/18723 | 3.91e-10 | 1.05e-08 | 171 |
| GO:000963620 | Esophagus | ESCC | response to toxic substance | 150/8552 | 262/18723 | 1.00e-04 | 7.12e-04 | 150 |
| Page: 1 2 3 4 5 6 |
| Pathway ID | Tissue | Disease Stage | Description | Gene Ratio | Bg Ratio | pvalue | p.adjust | qvalue | Count |
| Page: 1 |
Top |
Cell-cell communication analysis |
| Identification of potential cell-cell interactions between two cell types and their ligand-receptor pairs for different disease states |
| Ligand | Receptor | LRpair | Pathway | Tissue | Disease Stage |
| Page: 1 |
Top |
Single-cell gene regulatory network inference analysis |
| Find out the significant the regulons (TFs) and the target genes of each regulon across cell types for different disease states |
| TF | Cell Type | Tissue | Disease Stage | Target Gene | RSS | Regulon Activity |
| ∗The dot plots of a searched regulon are shown for all cell subpopulations in each disease state of each tissue based on the regulon specific score inferred using pySCENIC and by calculating the average expression. |
| Page: 1 |
Top |
Somatic mutation of malignant transformation related genes |
| Annotation of somatic variants for genes involved in malignant transformation |
| Hugo Symbol | Variant Class | Variant Classification | dbSNP RS | HGVSc | HGVSp | HGVSp Short | SWISSPROT | BIOTYPE | SIFT | PolyPhen | Tumor Sample Barcode | Tissue | Histology | Sex | Age | Stage | Therapy Types | Drugs | Outcome |
| PON2 | SNV | Missense_Mutation | c.396C>A | p.Asn132Lys | p.N132K | Q15165 | protein_coding | deleterious(0) | probably_damaging(0.999) | TCGA-AO-A03O-01 | Breast | breast invasive carcinoma | Female | >=65 | I/II | Chemotherapy | doxorubicin | SD | |
| PON2 | insertion | Nonsense_Mutation | novel | c.102_103insTATTGTATTCTCACATCCTATTGACCCAAACTTAGACATAT | p.Glu35TyrfsTer8 | p.E35Yfs*8 | Q15165 | protein_coding | TCGA-A7-A0CG-01 | Breast | breast invasive carcinoma | Female | >=65 | I/II | Unknown | Unknown | SD | ||
| PON2 | SNV | Missense_Mutation | c.333N>G | p.Phe111Leu | p.F111L | Q15165 | protein_coding | deleterious(0.04) | benign(0.118) | TCGA-C5-A1BQ-01 | Cervix | cervical & endocervical cancer | Female | >=65 | III/IV | Chemotherapy | cisplatin | CR | |
| PON2 | SNV | Missense_Mutation | c.139G>A | p.Gly47Arg | p.G47R | Q15165 | protein_coding | deleterious(0.01) | possibly_damaging(0.879) | TCGA-FU-A3HZ-01 | Cervix | cervical & endocervical cancer | Female | <65 | I/II | Chemotherapy | cisplatin | CR | |
| PON2 | SNV | Missense_Mutation | c.619N>C | p.Tyr207His | p.Y207H | Q15165 | protein_coding | deleterious(0) | probably_damaging(0.999) | TCGA-AA-3672-01 | Colorectum | colon adenocarcinoma | Female | >=65 | III/IV | Unknown | Unknown | SD | |
| PON2 | SNV | Missense_Mutation | c.261G>T | p.Met87Ile | p.M87I | Q15165 | protein_coding | tolerated(0.08) | benign(0.003) | TCGA-CA-6717-01 | Colorectum | colon adenocarcinoma | Male | <65 | I/II | Chemotherapy | oxaliplatin | CR | |
| PON2 | SNV | Missense_Mutation | novel | c.743N>G | p.Glu248Gly | p.E248G | Q15165 | protein_coding | deleterious(0) | possibly_damaging(0.572) | TCGA-CK-4951-01 | Colorectum | colon adenocarcinoma | Female | >=65 | I/II | Unknown | Unknown | PD |
| PON2 | SNV | Missense_Mutation | c.860N>A | p.Gly287Asp | p.G287D | Q15165 | protein_coding | deleterious(0.03) | possibly_damaging(0.865) | TCGA-CK-5913-01 | Colorectum | colon adenocarcinoma | Female | <65 | I/II | Unknown | Unknown | SD | |
| PON2 | SNV | Missense_Mutation | c.442G>A | p.Ala148Thr | p.A148T | Q15165 | protein_coding | deleterious(0.03) | benign(0.039) | TCGA-AG-A014-01 | Colorectum | rectum adenocarcinoma | Male | >=65 | I/II | Unknown | Unknown | SD | |
| PON2 | deletion | Frame_Shift_Del | c.195delT | p.Phe65LeufsTer5 | p.F65Lfs*5 | Q15165 | protein_coding | TCGA-G4-6588-01 | Colorectum | colon adenocarcinoma | Female | <65 | I/II | Unknown | Unknown | SD |
| Page: 1 2 3 4 5 |
Top |
Related drugs of malignant transformation related genes |
| Identification of chemicals and drugs interact with genes involved in malignant transfromation |
| (DGIdb 4.0) |
| Entrez ID | Symbol | Category | Interaction Types | Drug Claim Name | Drug Name | PMIDs |
| 5445 | PON2 | DRUGGABLE GENOME, ENZYME | antidepressants |
| Page: 1 |

Copyright 2023-Present -The University of Texas Health Science Center at Houston |