
|
|||||
|
 | |
| |
| |
| |
| |
| |
|
Gene: POMP |
Gene summary for POMP |
| Gene information | Species | Human | Gene symbol | POMP | Gene ID | 51371 |
| Gene name | proteasome maturation protein | |
| Gene Alias | C13orf12 | |
| Cytomap | 13q12.3 | |
| Gene Type | protein-coding | GO ID | GO:0008150 | UniProtAcc | Q9Y244 |
Top |
Malignant transformation analysis |
| Identification of the aberrant gene expression in precancerous and cancerous lesions by comparing the gene expression of stem-like cells in diseased tissues with normal stem cells |
| Entrez ID | Symbol | Replicates | Species | Organ | Tissue | Adj P-value | Log2FC | Malignancy |
| 51371 | POMP | GSM4909281 | Human | Breast | IDC | 4.02e-11 | 3.43e-01 | 0.21 |
| 51371 | POMP | GSM4909282 | Human | Breast | IDC | 4.27e-02 | 1.66e-01 | -0.0288 |
| 51371 | POMP | GSM4909285 | Human | Breast | IDC | 2.16e-19 | 4.28e-01 | 0.21 |
| 51371 | POMP | GSM4909288 | Human | Breast | IDC | 7.18e-07 | 2.30e-01 | 0.0988 |
| 51371 | POMP | GSM4909294 | Human | Breast | IDC | 9.50e-14 | 1.18e-01 | 0.2022 |
| 51371 | POMP | GSM4909296 | Human | Breast | IDC | 9.63e-14 | -1.24e-01 | 0.1524 |
| 51371 | POMP | GSM4909297 | Human | Breast | IDC | 4.96e-25 | 3.50e-02 | 0.1517 |
| 51371 | POMP | GSM4909298 | Human | Breast | IDC | 9.31e-03 | 2.23e-01 | 0.1551 |
| 51371 | POMP | GSM4909306 | Human | Breast | IDC | 9.43e-03 | 1.35e-01 | 0.1564 |
| 51371 | POMP | GSM4909311 | Human | Breast | IDC | 3.36e-47 | -3.73e-01 | 0.1534 |
| 51371 | POMP | GSM4909312 | Human | Breast | IDC | 2.11e-19 | -1.65e-01 | 0.1552 |
| 51371 | POMP | GSM4909315 | Human | Breast | IDC | 3.12e-04 | 1.39e-01 | 0.21 |
| 51371 | POMP | GSM4909316 | Human | Breast | IDC | 7.46e-06 | 2.06e-01 | 0.21 |
| 51371 | POMP | GSM4909317 | Human | Breast | IDC | 5.17e-19 | 4.72e-01 | 0.1355 |
| 51371 | POMP | GSM4909318 | Human | Breast | IDC | 4.11e-14 | 5.86e-01 | 0.2031 |
| 51371 | POMP | GSM4909319 | Human | Breast | IDC | 1.94e-57 | -4.32e-01 | 0.1563 |
| 51371 | POMP | GSM4909320 | Human | Breast | IDC | 1.95e-05 | -2.22e-01 | 0.1575 |
| 51371 | POMP | GSM4909321 | Human | Breast | IDC | 2.52e-29 | 1.12e-01 | 0.1559 |
| 51371 | POMP | brca1 | Human | Breast | Precancer | 1.06e-28 | 5.10e-01 | -0.0338 |
| 51371 | POMP | brca2 | Human | Breast | Precancer | 6.15e-37 | 5.23e-01 | -0.024 |
| Page: 1 2 3 4 5 6 7 8 9 10 11 12 13 |
| Tissue | Expression Dynamics | Abbreviation |
| Breast | 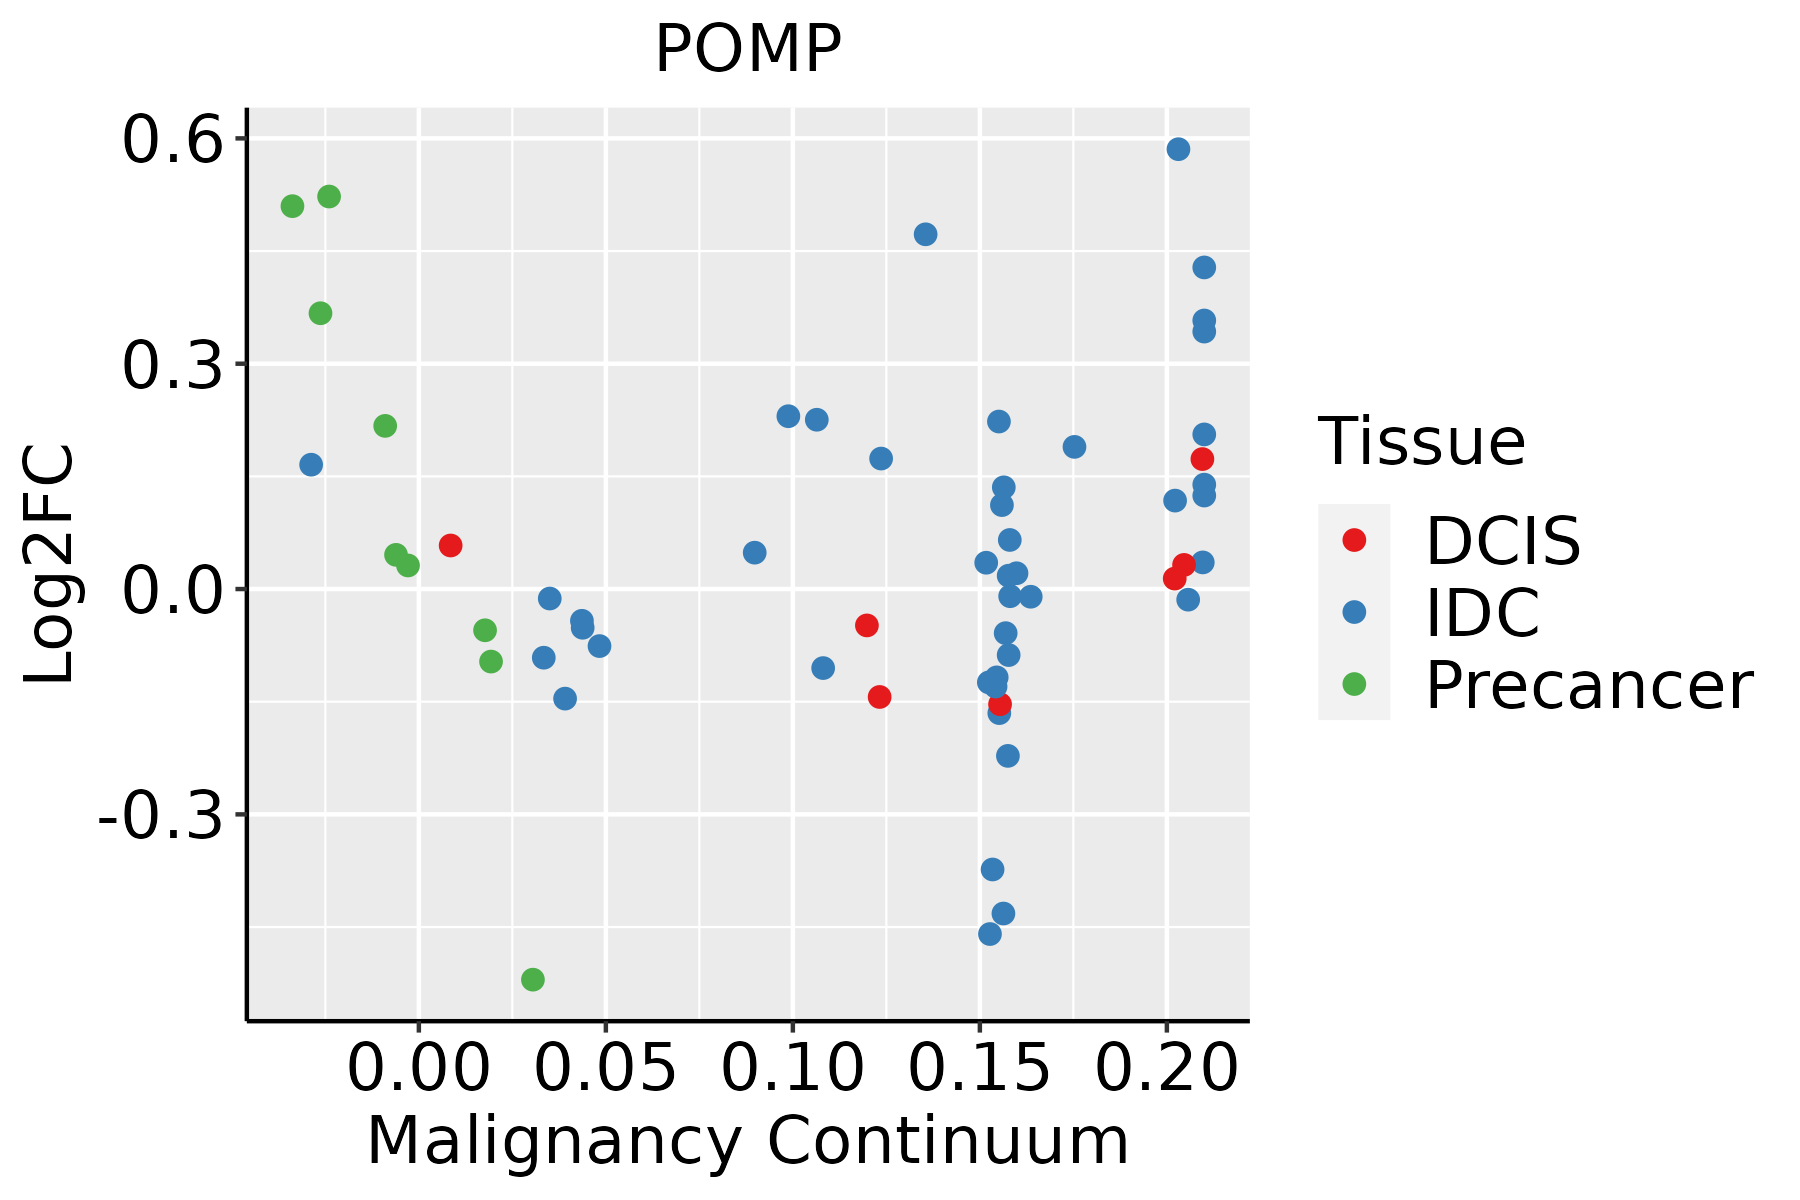 | IDC: Invasive ductal carcinoma |
| DCIS: Ductal carcinoma in situ | ||
| Precancer(BRCA1-mut): Precancerous lesion from BRCA1 mutation carriers | ||
| Cervix | 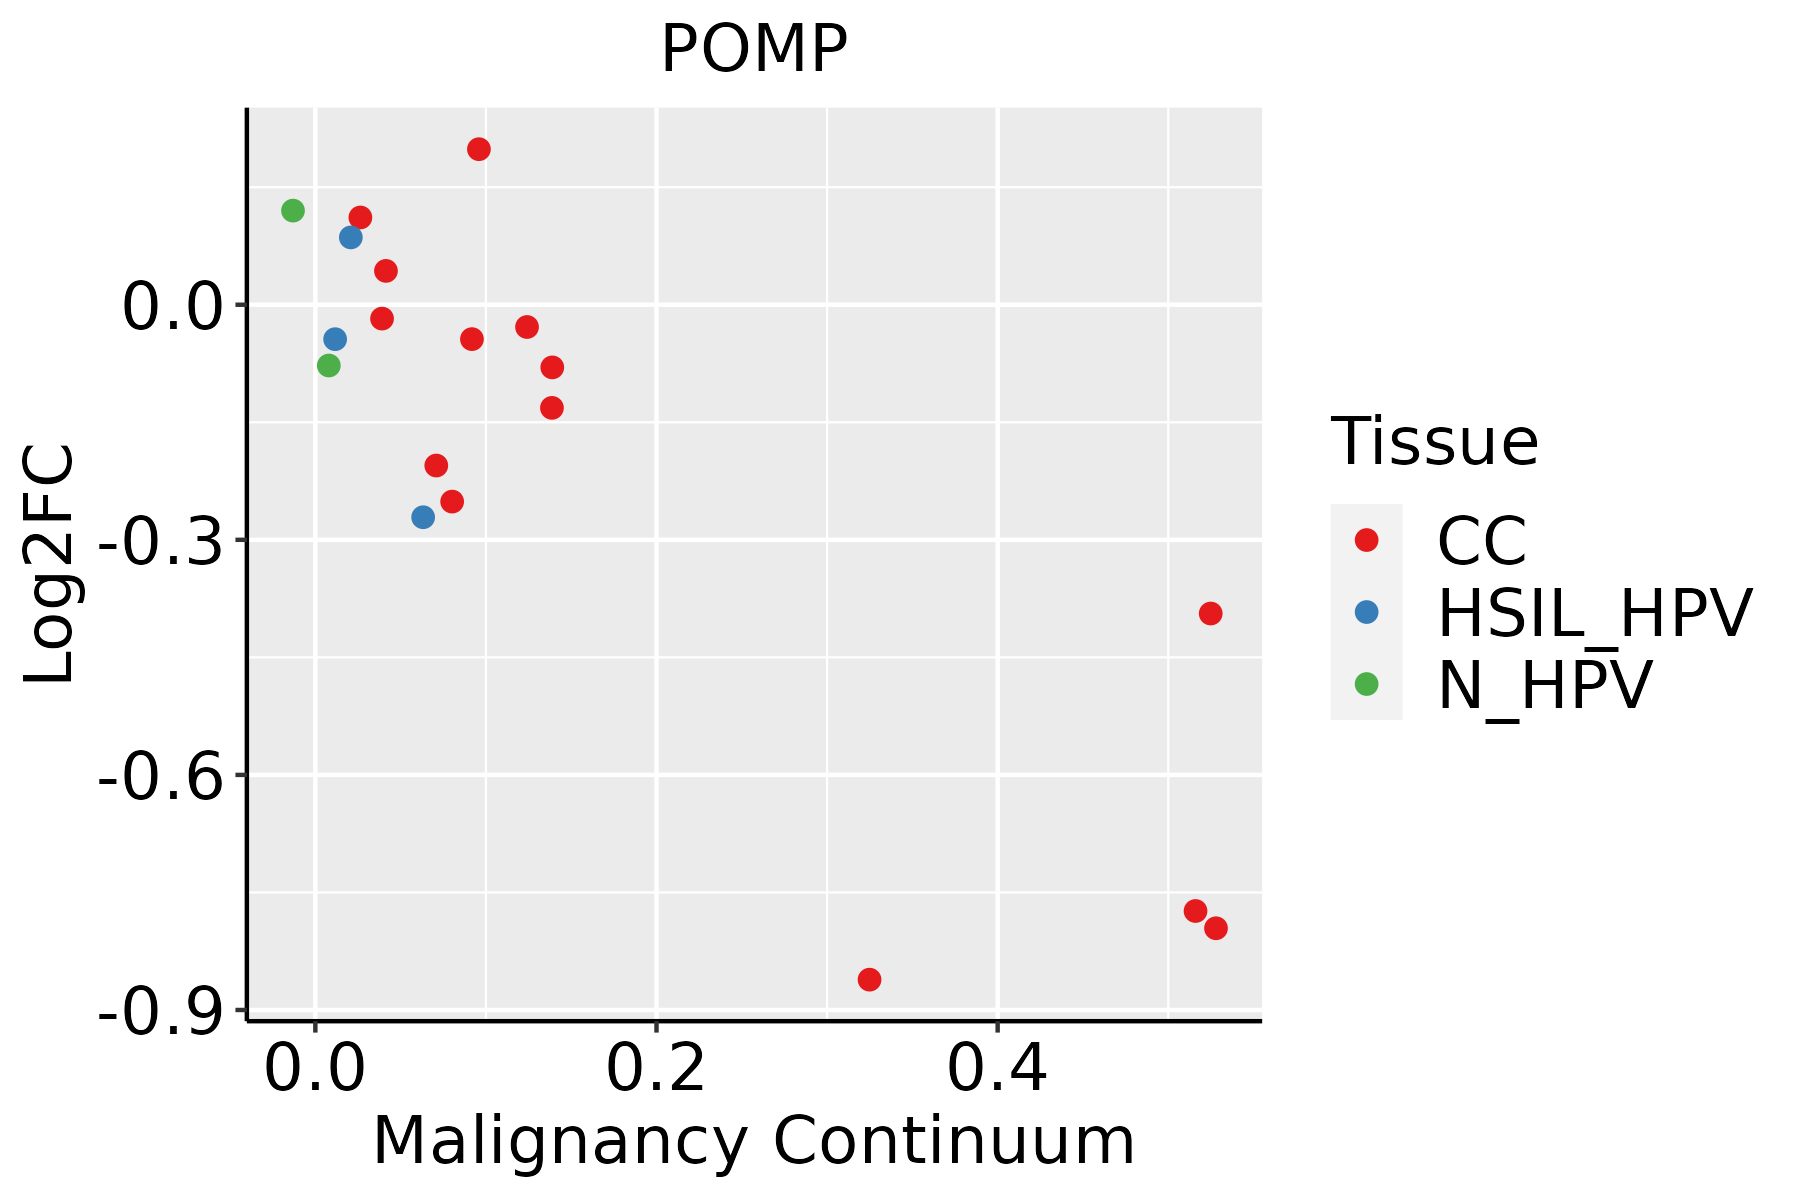 | CC: Cervix cancer |
| HSIL_HPV: HPV-infected high-grade squamous intraepithelial lesions | ||
| N_HPV: HPV-infected normal cervix | ||
| Colorectum (GSE201348) |  | FAP: Familial adenomatous polyposis |
| CRC: Colorectal cancer | ||
| Colorectum (HTA11) |  | AD: Adenomas |
| SER: Sessile serrated lesions | ||
| MSI-H: Microsatellite-high colorectal cancer | ||
| MSS: Microsatellite stable colorectal cancer | ||
| Endometrium | 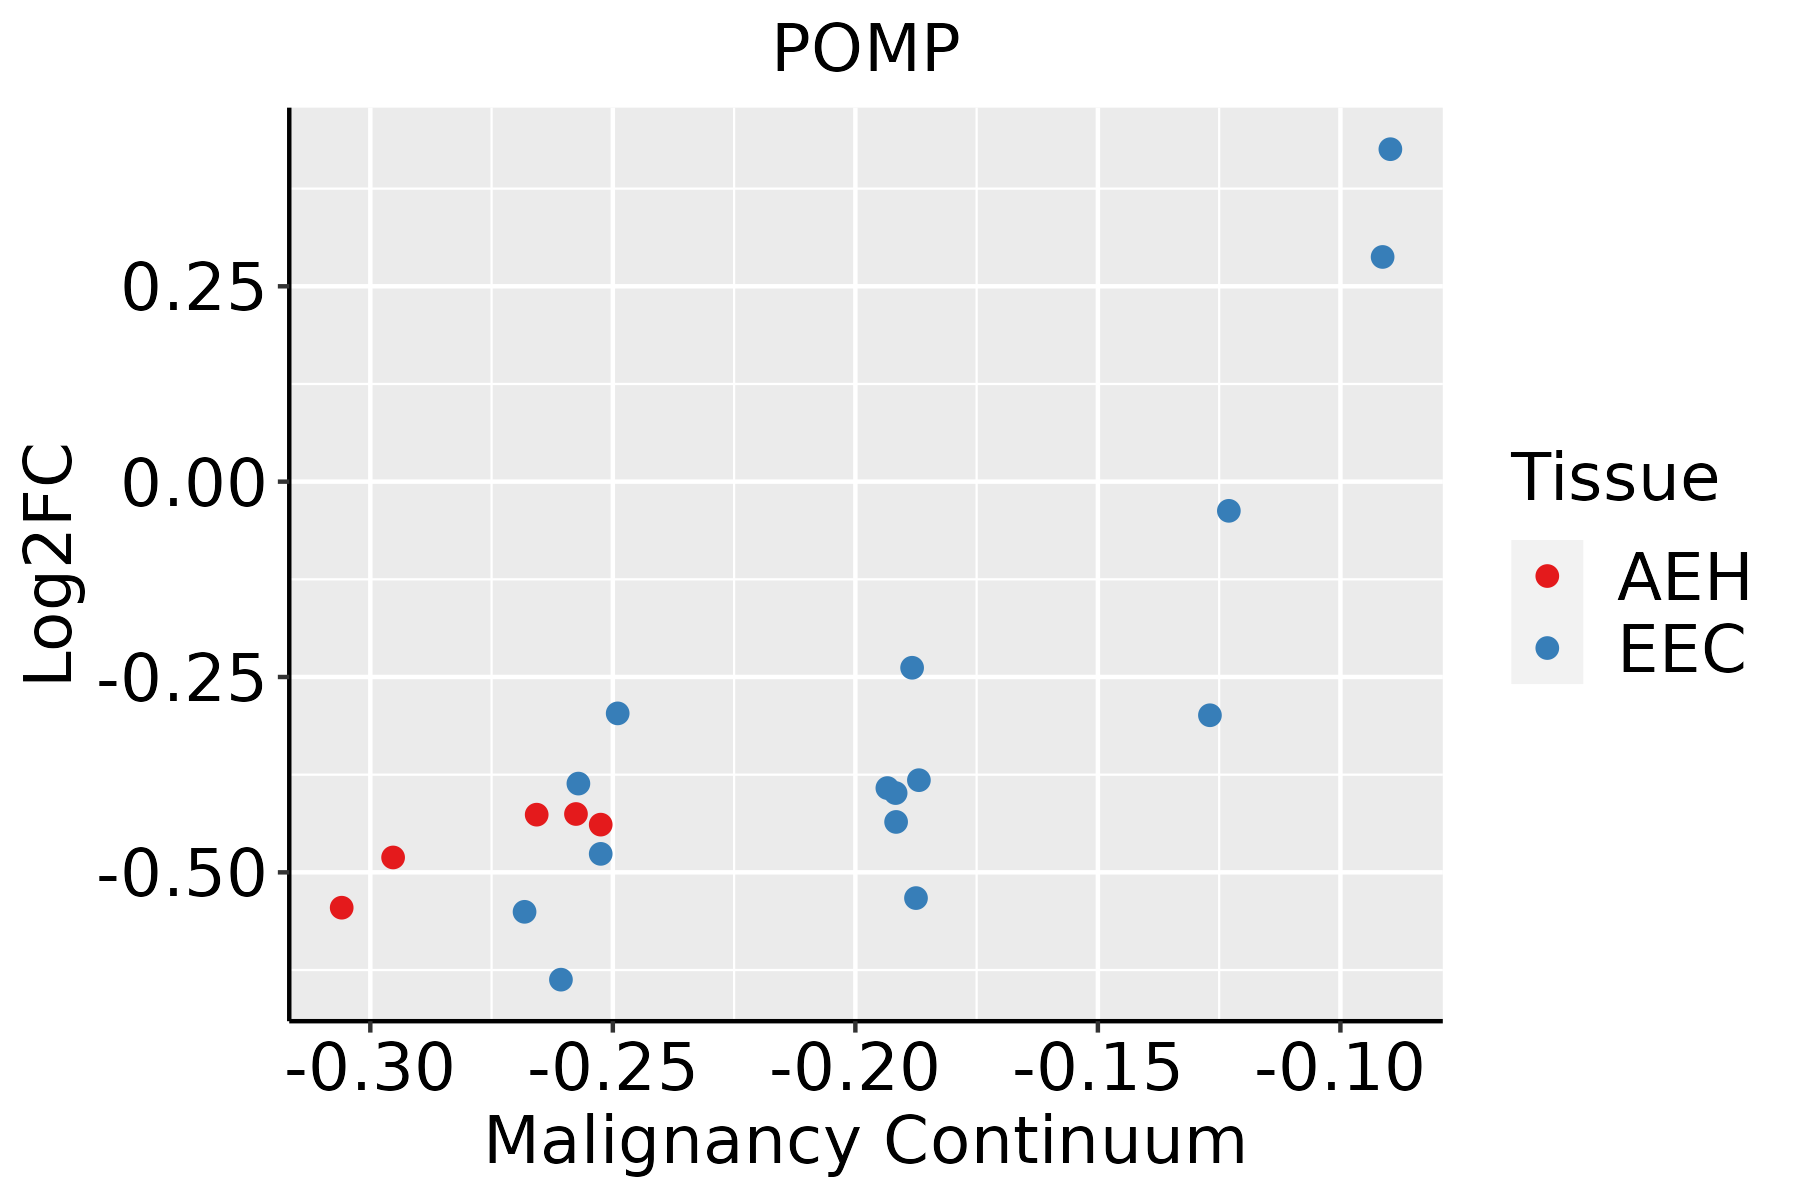 | AEH: Atypical endometrial hyperplasia |
| EEC: Endometrioid Cancer | ||
| Esophagus | 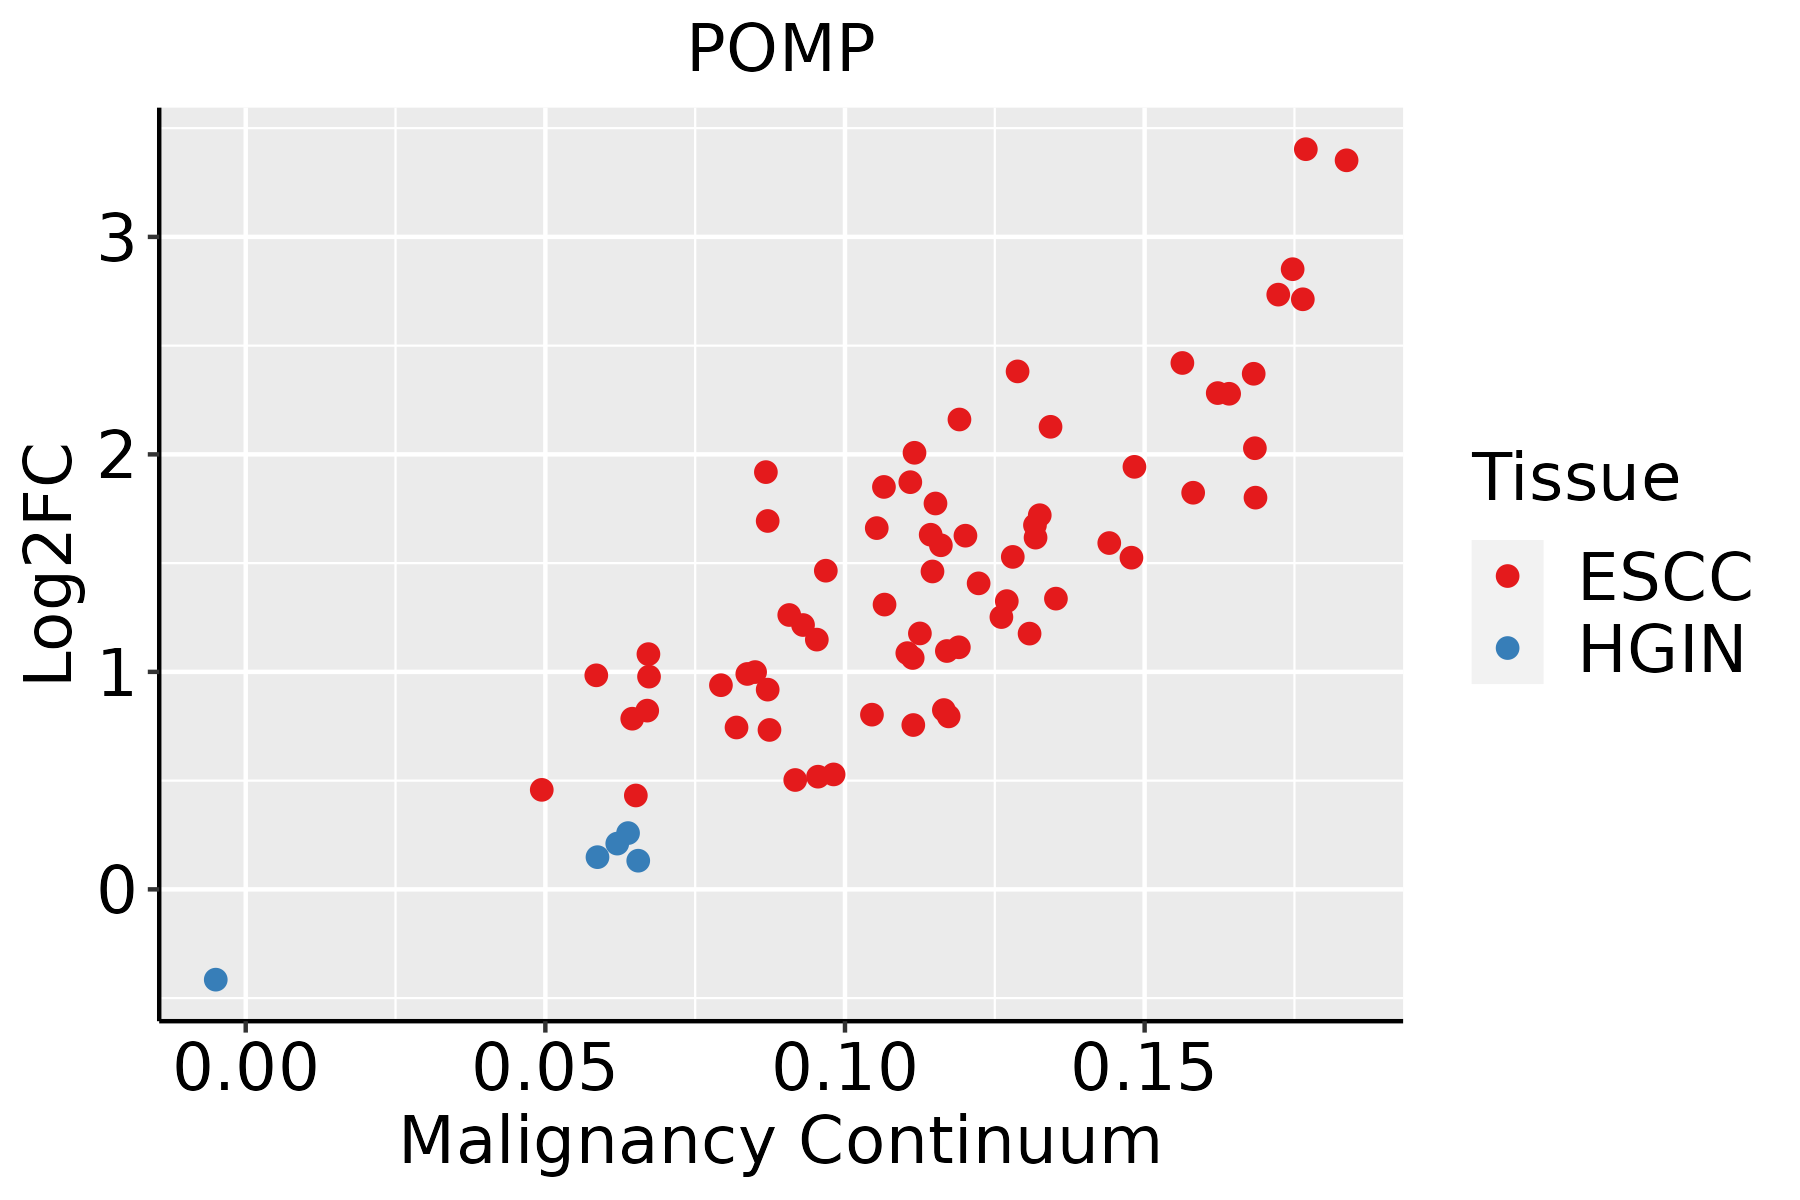 | ESCC: Esophageal squamous cell carcinoma |
| HGIN: High-grade intraepithelial neoplasias | ||
| LGIN: Low-grade intraepithelial neoplasias | ||
| Liver | 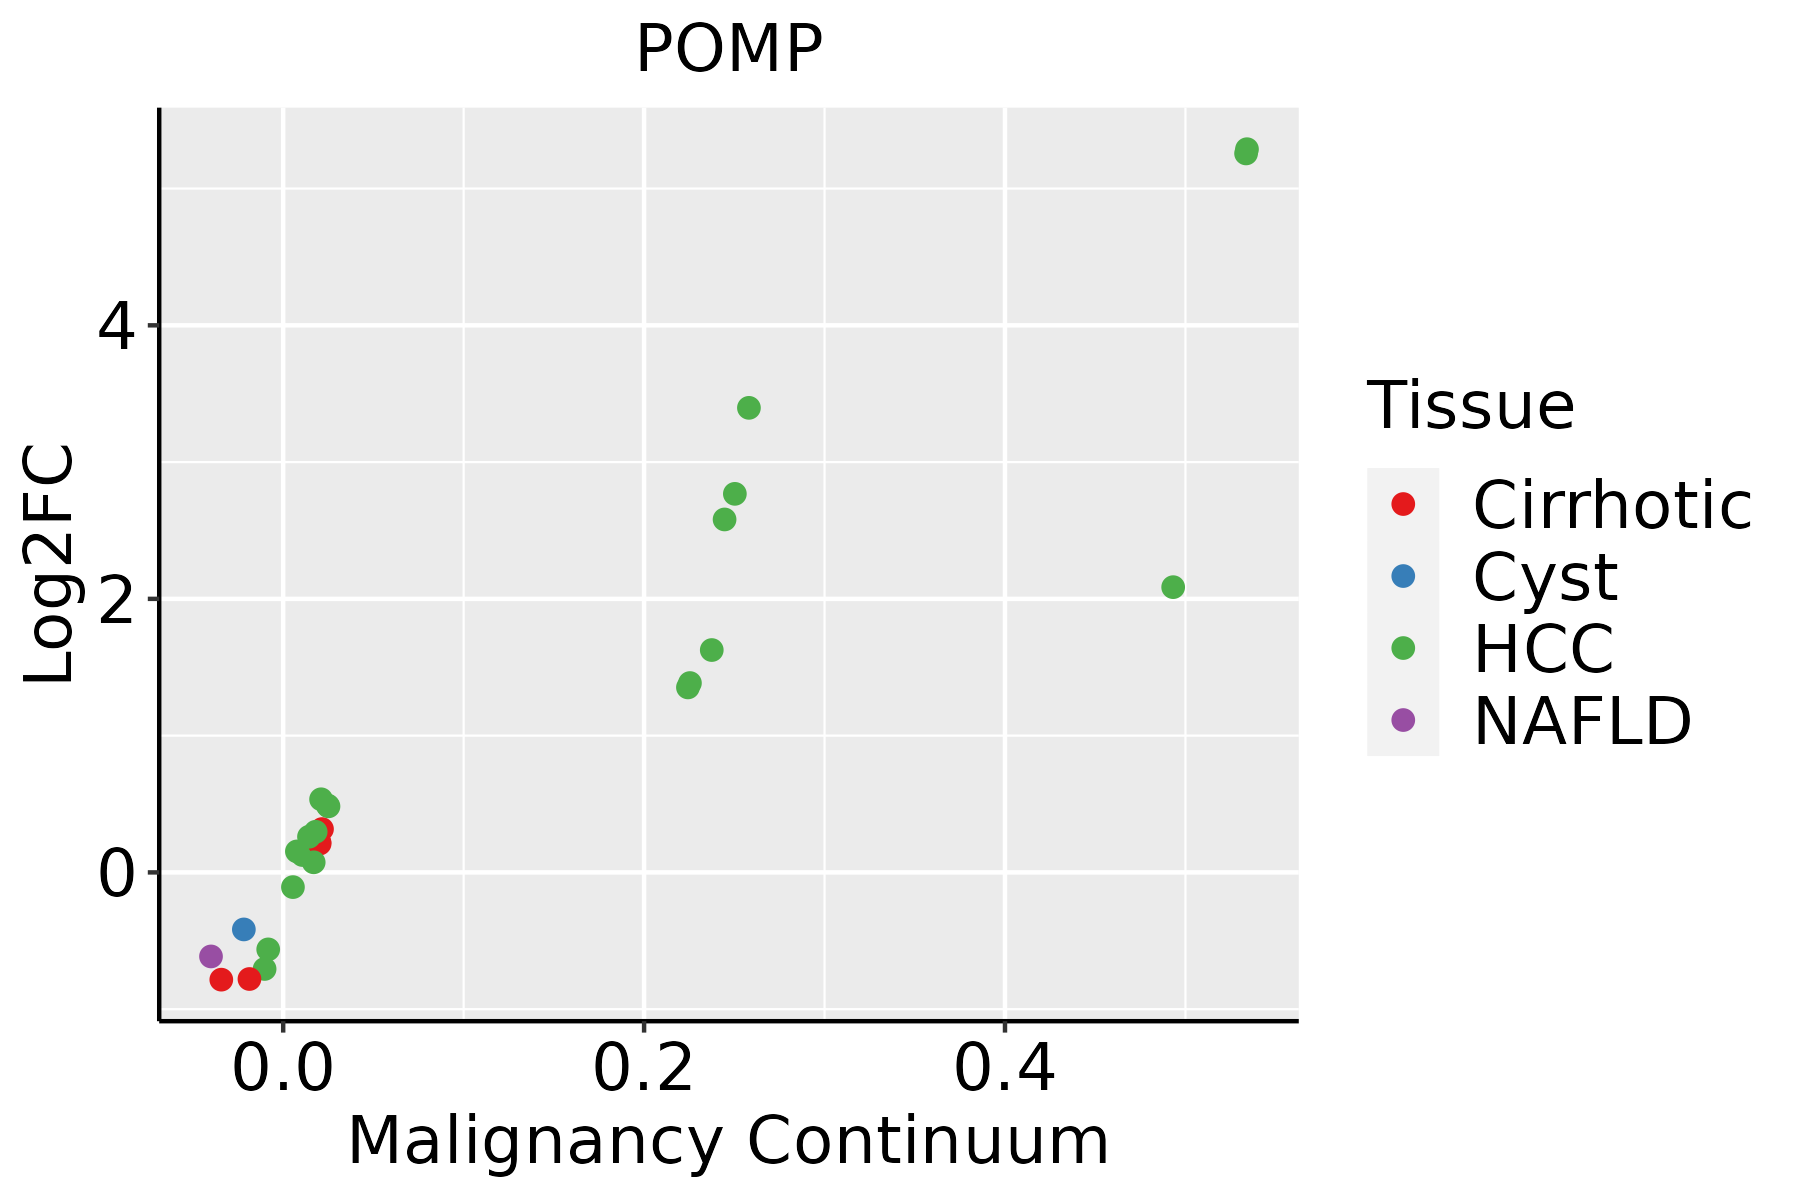 | HCC: Hepatocellular carcinoma |
| NAFLD: Non-alcoholic fatty liver disease | ||
| Oral Cavity | 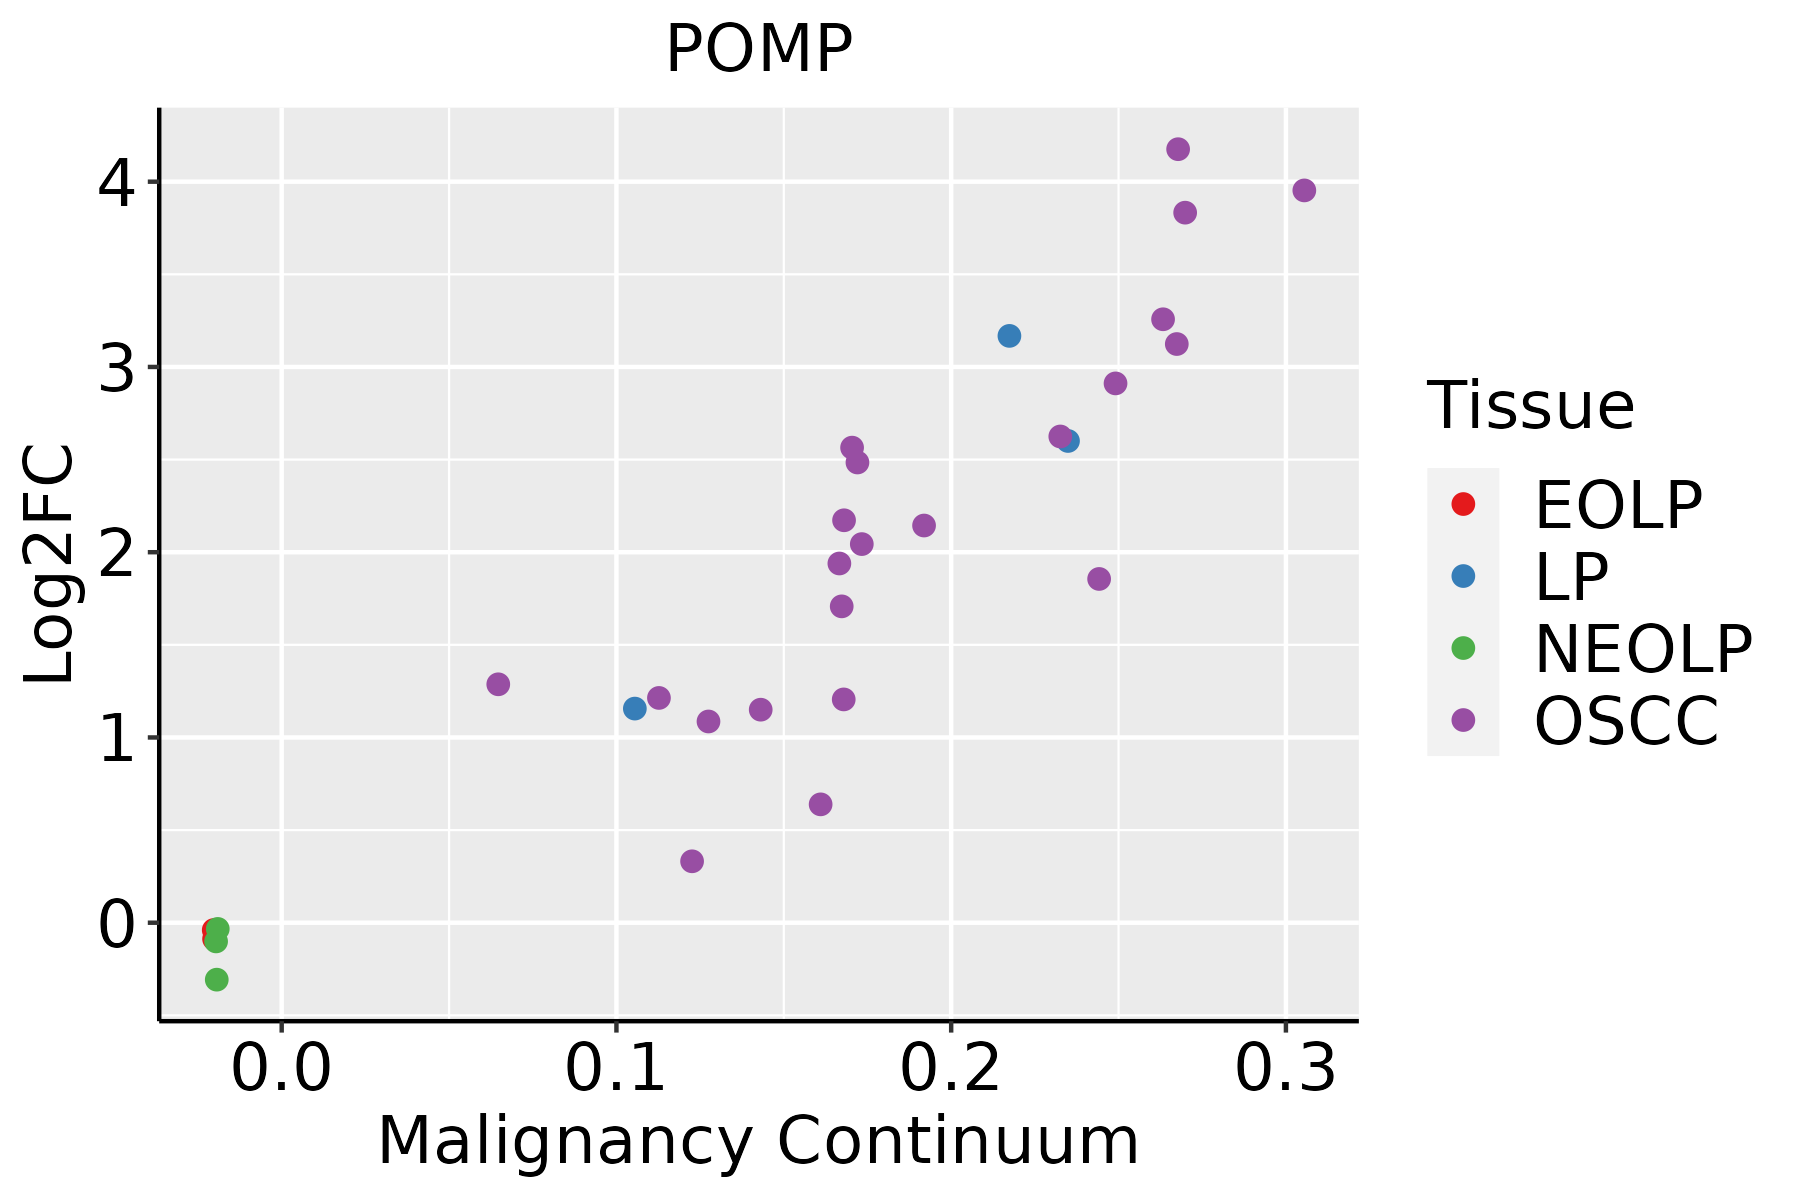 | EOLP: Erosive Oral lichen planus |
| LP: leukoplakia | ||
| NEOLP: Non-erosive oral lichen planus | ||
| OSCC: Oral squamous cell carcinoma | ||
| Prostate | 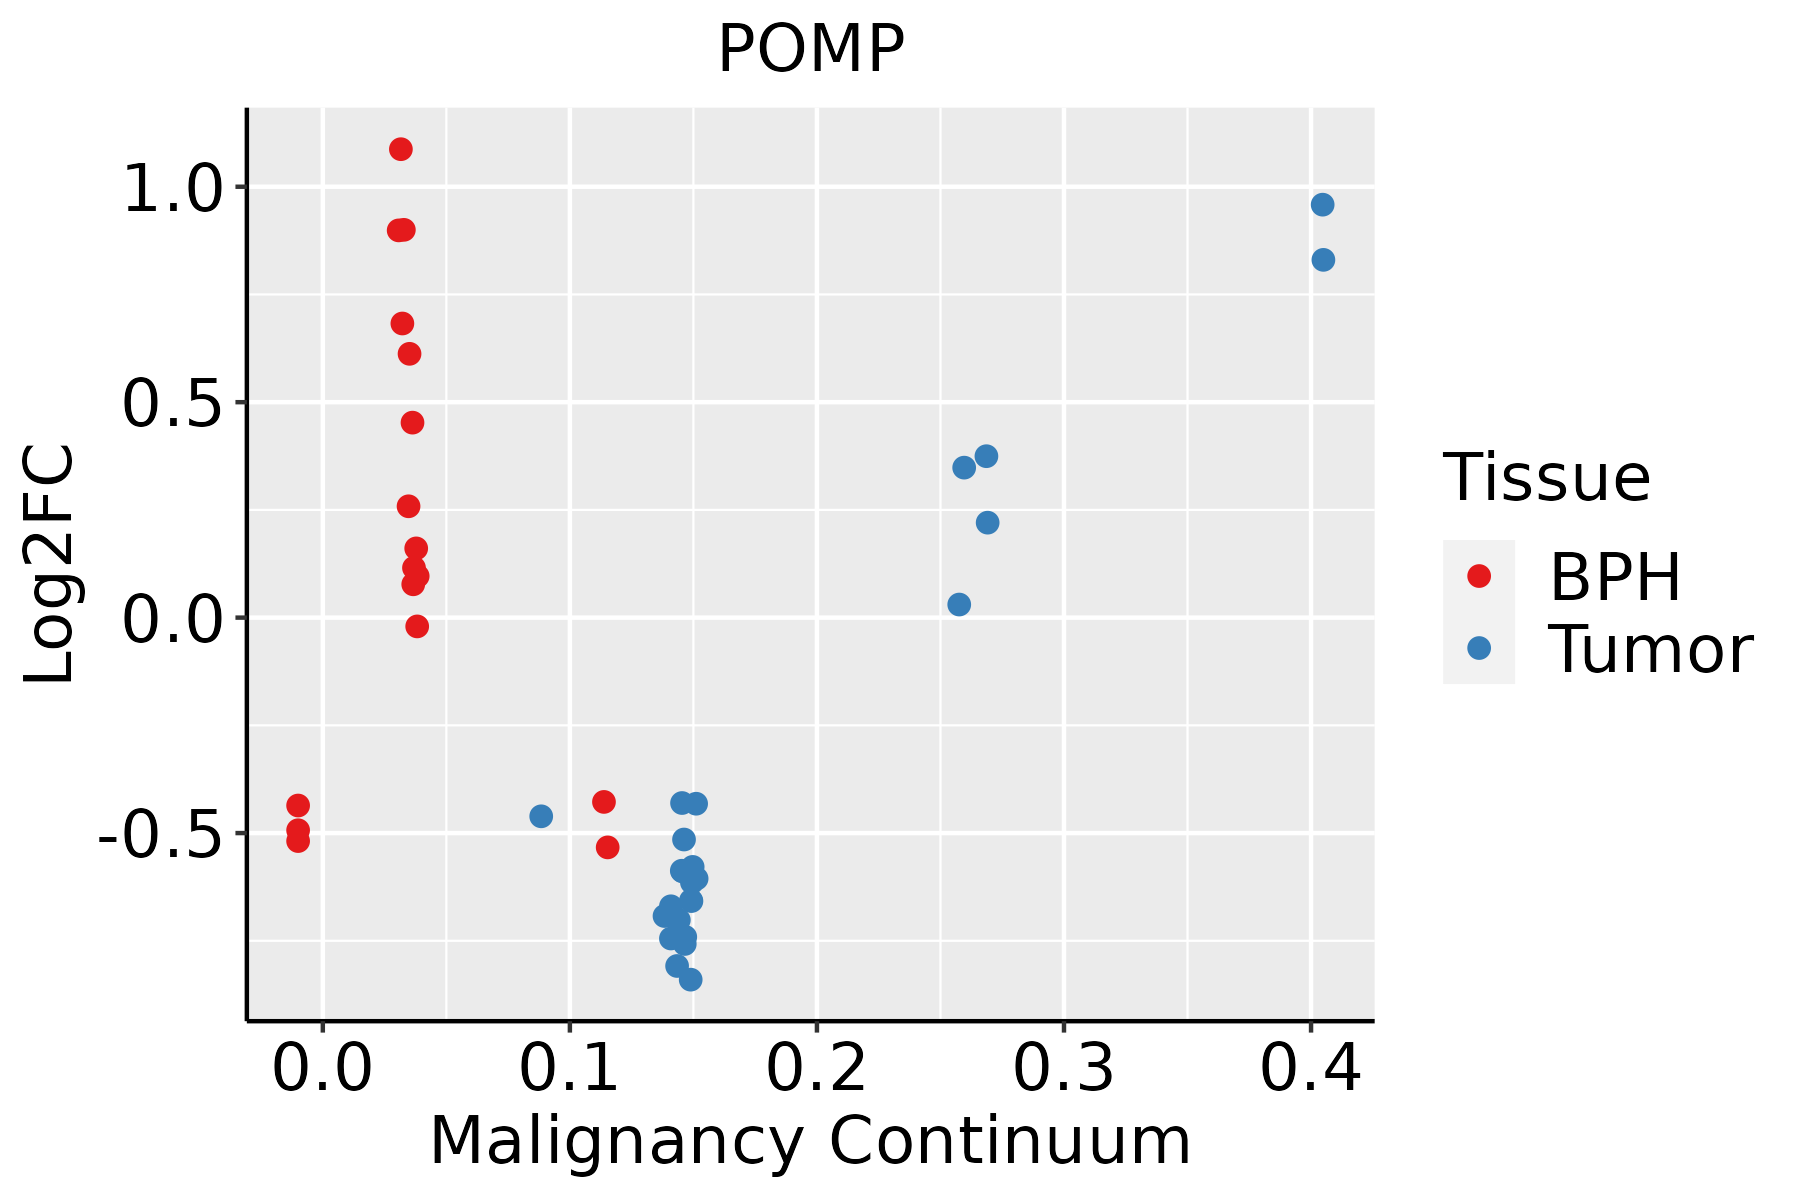 | BPH: Benign Prostatic Hyperplasia |
| Skin |  | AK: Actinic keratosis |
| cSCC: Cutaneous squamous cell carcinoma | ||
| SCCIS:squamous cell carcinoma in situ | ||
| Thyroid |  | ATC: Anaplastic thyroid cancer |
| HT: Hashimoto's thyroiditis | ||
| PTC: Papillary thyroid cancer |
| ∗log2FC in expression of this searched gene in stem-like cells from each diseased tissue sample relative to stem-like cells in normal samples in each tissue plotted against the malignancy continuum. Samples are colored based on if they are from different disease stage. |
Top |
Malignant transformation related pathway analysis |
| Find out the enriched GO biological processes and KEGG pathways involved in transition from healthy to precancer to cancer |
| Tissue | Disease Stage | Enriched GO biological Processes |
| Colorectum | AD |  |
| Colorectum | SER |  |
| Colorectum | MSS |  |
| Colorectum | MSI-H |  |
| Colorectum | FAP |  |
| ∗Top 15 enriched GO BP terms are showed in the bar plot of each disease state in each tissue. Each row represents a significant GO biological process which is colored according to the -log10(p.adjust). |
| Page: 1 2 3 4 5 6 7 8 9 |
| GO ID | Tissue | Disease Stage | Description | Gene Ratio | Bg Ratio | pvalue | p.adjust | Count |
| GO:004324811 | Esophagus | ESCC | proteasome assembly | 11/8552 | 12/18723 | 1.26e-03 | 6.06e-03 | 11 |
| GO:0043248 | Liver | Cirrhotic | proteasome assembly | 9/4634 | 12/18723 | 3.59e-04 | 3.03e-03 | 9 |
| GO:00432481 | Liver | HCC | proteasome assembly | 12/7958 | 12/18723 | 3.46e-05 | 3.45e-04 | 12 |
| GO:00432482 | Oral cavity | OSCC | proteasome assembly | 11/7305 | 12/18723 | 2.45e-04 | 1.57e-03 | 11 |
| GO:00432484 | Skin | cSCC | proteasome assembly | 10/4864 | 12/18723 | 5.36e-05 | 5.38e-04 | 10 |
| Page: 1 |
| Pathway ID | Tissue | Disease Stage | Description | Gene Ratio | Bg Ratio | pvalue | p.adjust | qvalue | Count |
| hsa0305010 | Breast | Precancer | Proteasome | 25/684 | 46/8465 | 4.35e-16 | 9.81e-15 | 7.52e-15 | 25 |
| hsa0305013 | Breast | Precancer | Proteasome | 25/684 | 46/8465 | 4.35e-16 | 9.81e-15 | 7.52e-15 | 25 |
| hsa0305022 | Liver | HCC | Proteasome | 43/4020 | 46/8465 | 2.62e-11 | 4.61e-10 | 2.56e-10 | 43 |
| hsa0305032 | Liver | HCC | Proteasome | 43/4020 | 46/8465 | 2.62e-11 | 4.61e-10 | 2.56e-10 | 43 |
| hsa0305020 | Oral cavity | OSCC | Proteasome | 42/3704 | 46/8465 | 1.32e-11 | 2.01e-10 | 1.02e-10 | 42 |
| hsa03050110 | Oral cavity | OSCC | Proteasome | 42/3704 | 46/8465 | 1.32e-11 | 2.01e-10 | 1.02e-10 | 42 |
| hsa0305026 | Oral cavity | LP | Proteasome | 41/2418 | 46/8465 | 1.05e-17 | 3.17e-16 | 2.05e-16 | 41 |
| hsa0305036 | Oral cavity | LP | Proteasome | 41/2418 | 46/8465 | 1.05e-17 | 3.17e-16 | 2.05e-16 | 41 |
| hsa0305018 | Prostate | BPH | Proteasome | 28/1718 | 46/8465 | 2.01e-09 | 2.89e-08 | 1.79e-08 | 28 |
| hsa0305019 | Prostate | BPH | Proteasome | 28/1718 | 46/8465 | 2.01e-09 | 2.89e-08 | 1.79e-08 | 28 |
| Page: 1 |
Top |
Cell-cell communication analysis |
| Identification of potential cell-cell interactions between two cell types and their ligand-receptor pairs for different disease states |
| Ligand | Receptor | LRpair | Pathway | Tissue | Disease Stage |
| Page: 1 |
Top |
Single-cell gene regulatory network inference analysis |
| Find out the significant the regulons (TFs) and the target genes of each regulon across cell types for different disease states |
| TF | Cell Type | Tissue | Disease Stage | Target Gene | RSS | Regulon Activity |
| ∗The dot plots of a searched regulon are shown for all cell subpopulations in each disease state of each tissue based on the regulon specific score inferred using pySCENIC and by calculating the average expression. |
| Page: 1 |
Top |
Somatic mutation of malignant transformation related genes |
| Annotation of somatic variants for genes involved in malignant transformation |
| Hugo Symbol | Variant Class | Variant Classification | dbSNP RS | HGVSc | HGVSp | HGVSp Short | SWISSPROT | BIOTYPE | SIFT | PolyPhen | Tumor Sample Barcode | Tissue | Histology | Sex | Age | Stage | Therapy Types | Drugs | Outcome |
| POMP | SNV | Missense_Mutation | c.12A>T | p.Arg4Ser | p.R4S | Q9Y244 | protein_coding | tolerated_low_confidence(0.08) | benign(0.073) | TCGA-A8-A09Z-01 | Breast | breast invasive carcinoma | Female | >=65 | I/II | Unknown | Unknown | SD | |
| POMP | SNV | Missense_Mutation | c.396N>C | p.Leu132Phe | p.L132F | Q9Y244 | protein_coding | tolerated(0.05) | benign(0.443) | TCGA-AC-A23H-01 | Breast | breast invasive carcinoma | Female | >=65 | I/II | Unknown | Unknown | PD | |
| POMP | SNV | Missense_Mutation | c.373N>A | p.Glu125Lys | p.E125K | Q9Y244 | protein_coding | deleterious(0) | probably_damaging(0.997) | TCGA-AN-A046-01 | Breast | breast invasive carcinoma | Female | >=65 | I/II | Unknown | Unknown | SD | |
| POMP | SNV | Missense_Mutation | novel | c.34G>T | p.Asp12Tyr | p.D12Y | Q9Y244 | protein_coding | deleterious_low_confidence(0) | possibly_damaging(0.879) | TCGA-VS-A9V4-01 | Cervix | cervical & endocervical cancer | Female | <65 | I/II | Chemotherapy | cisplatin | PD |
| POMP | SNV | Missense_Mutation | rs148838797 | c.112N>C | p.Val38Leu | p.V38L | Q9Y244 | protein_coding | deleterious(0.01) | benign(0.159) | TCGA-AG-A00C-01 | Colorectum | rectum adenocarcinoma | Female | <65 | III/IV | Chemotherapy | 5-fluorouracil | CR |
| POMP | SNV | Missense_Mutation | c.373G>A | p.Glu125Lys | p.E125K | Q9Y244 | protein_coding | deleterious(0) | probably_damaging(0.997) | TCGA-F5-6814-01 | Colorectum | rectum adenocarcinoma | Male | <65 | I/II | Unknown | Unknown | SD | |
| POMP | SNV | Missense_Mutation | c.86N>C | p.Asp29Ala | p.D29A | Q9Y244 | protein_coding | deleterious(0) | possibly_damaging(0.833) | TCGA-AJ-A3EL-01 | Endometrium | uterine corpus endometrioid carcinoma | Female | <65 | I/II | Unknown | Unknown | SD | |
| POMP | SNV | Missense_Mutation | novel | c.392N>T | p.His131Leu | p.H131L | Q9Y244 | protein_coding | deleterious(0.04) | possibly_damaging(0.773) | TCGA-AP-A0LS-01 | Endometrium | uterine corpus endometrioid carcinoma | Female | <65 | I/II | Unknown | Unknown | SD |
| POMP | SNV | Missense_Mutation | c.380N>C | p.Met127Thr | p.M127T | Q9Y244 | protein_coding | deleterious(0) | benign(0.029) | TCGA-B5-A11J-01 | Endometrium | uterine corpus endometrioid carcinoma | Female | <65 | I/II | Unknown | Unknown | SD | |
| POMP | SNV | Missense_Mutation | novel | c.35N>G | p.Asp12Gly | p.D12G | Q9Y244 | protein_coding | tolerated_low_confidence(0.06) | benign(0.283) | TCGA-B5-A3FA-01 | Endometrium | uterine corpus endometrioid carcinoma | Female | >=65 | I/II | Unknown | Unknown | SD |
| Page: 1 2 |
Top |
Related drugs of malignant transformation related genes |
| Identification of chemicals and drugs interact with genes involved in malignant transfromation |
| (DGIdb 4.0) |
| Entrez ID | Symbol | Category | Interaction Types | Drug Claim Name | Drug Name | PMIDs |
| Page: 1 |

Copyright 2023-Present -The University of Texas Health Science Center at Houston |