
|
|||||
|
 | |
| |
| |
| |
| |
| |
|
Gene: POMGNT1 |
Gene summary for POMGNT1 |
| Gene information | Species | Human | Gene symbol | POMGNT1 | Gene ID | 55624 |
| Gene name | protein O-linked mannose N-acetylglucosaminyltransferase 1 (beta 1,2-) | |
| Gene Alias | GNTI.2 | |
| Cytomap | 1p34.1 | |
| Gene Type | protein-coding | GO ID | GO:0006464 | UniProtAcc | B7Z7Q4 |
Top |
Malignant transformation analysis |
| Identification of the aberrant gene expression in precancerous and cancerous lesions by comparing the gene expression of stem-like cells in diseased tissues with normal stem cells |
| Entrez ID | Symbol | Replicates | Species | Organ | Tissue | Adj P-value | Log2FC | Malignancy |
| 55624 | POMGNT1 | LZE8T | Human | Esophagus | ESCC | 1.13e-03 | 8.77e-02 | 0.067 |
| 55624 | POMGNT1 | LZE20T | Human | Esophagus | ESCC | 2.29e-03 | 5.13e-02 | 0.0662 |
| 55624 | POMGNT1 | LZE24T | Human | Esophagus | ESCC | 3.47e-14 | 2.19e-01 | 0.0596 |
| 55624 | POMGNT1 | P1T-E | Human | Esophagus | ESCC | 8.67e-08 | 4.00e-01 | 0.0875 |
| 55624 | POMGNT1 | P2T-E | Human | Esophagus | ESCC | 4.58e-35 | 6.12e-01 | 0.1177 |
| 55624 | POMGNT1 | P4T-E | Human | Esophagus | ESCC | 3.53e-14 | 2.60e-01 | 0.1323 |
| 55624 | POMGNT1 | P5T-E | Human | Esophagus | ESCC | 3.90e-08 | 1.36e-01 | 0.1327 |
| 55624 | POMGNT1 | P8T-E | Human | Esophagus | ESCC | 9.98e-08 | 8.45e-02 | 0.0889 |
| 55624 | POMGNT1 | P9T-E | Human | Esophagus | ESCC | 2.73e-05 | 8.30e-02 | 0.1131 |
| 55624 | POMGNT1 | P10T-E | Human | Esophagus | ESCC | 1.74e-16 | 3.50e-01 | 0.116 |
| 55624 | POMGNT1 | P11T-E | Human | Esophagus | ESCC | 6.73e-15 | 3.99e-01 | 0.1426 |
| 55624 | POMGNT1 | P12T-E | Human | Esophagus | ESCC | 2.55e-08 | 1.25e-01 | 0.1122 |
| 55624 | POMGNT1 | P15T-E | Human | Esophagus | ESCC | 1.44e-12 | 2.05e-01 | 0.1149 |
| 55624 | POMGNT1 | P16T-E | Human | Esophagus | ESCC | 1.30e-08 | 2.00e-01 | 0.1153 |
| 55624 | POMGNT1 | P17T-E | Human | Esophagus | ESCC | 1.88e-10 | 2.50e-01 | 0.1278 |
| 55624 | POMGNT1 | P19T-E | Human | Esophagus | ESCC | 1.24e-03 | 5.69e-01 | 0.1662 |
| 55624 | POMGNT1 | P20T-E | Human | Esophagus | ESCC | 3.45e-14 | 2.89e-01 | 0.1124 |
| 55624 | POMGNT1 | P21T-E | Human | Esophagus | ESCC | 7.19e-20 | 4.49e-01 | 0.1617 |
| 55624 | POMGNT1 | P22T-E | Human | Esophagus | ESCC | 1.12e-07 | 1.74e-01 | 0.1236 |
| 55624 | POMGNT1 | P23T-E | Human | Esophagus | ESCC | 1.10e-16 | 4.18e-01 | 0.108 |
| Page: 1 2 3 4 5 6 |
| Tissue | Expression Dynamics | Abbreviation |
| Esophagus | 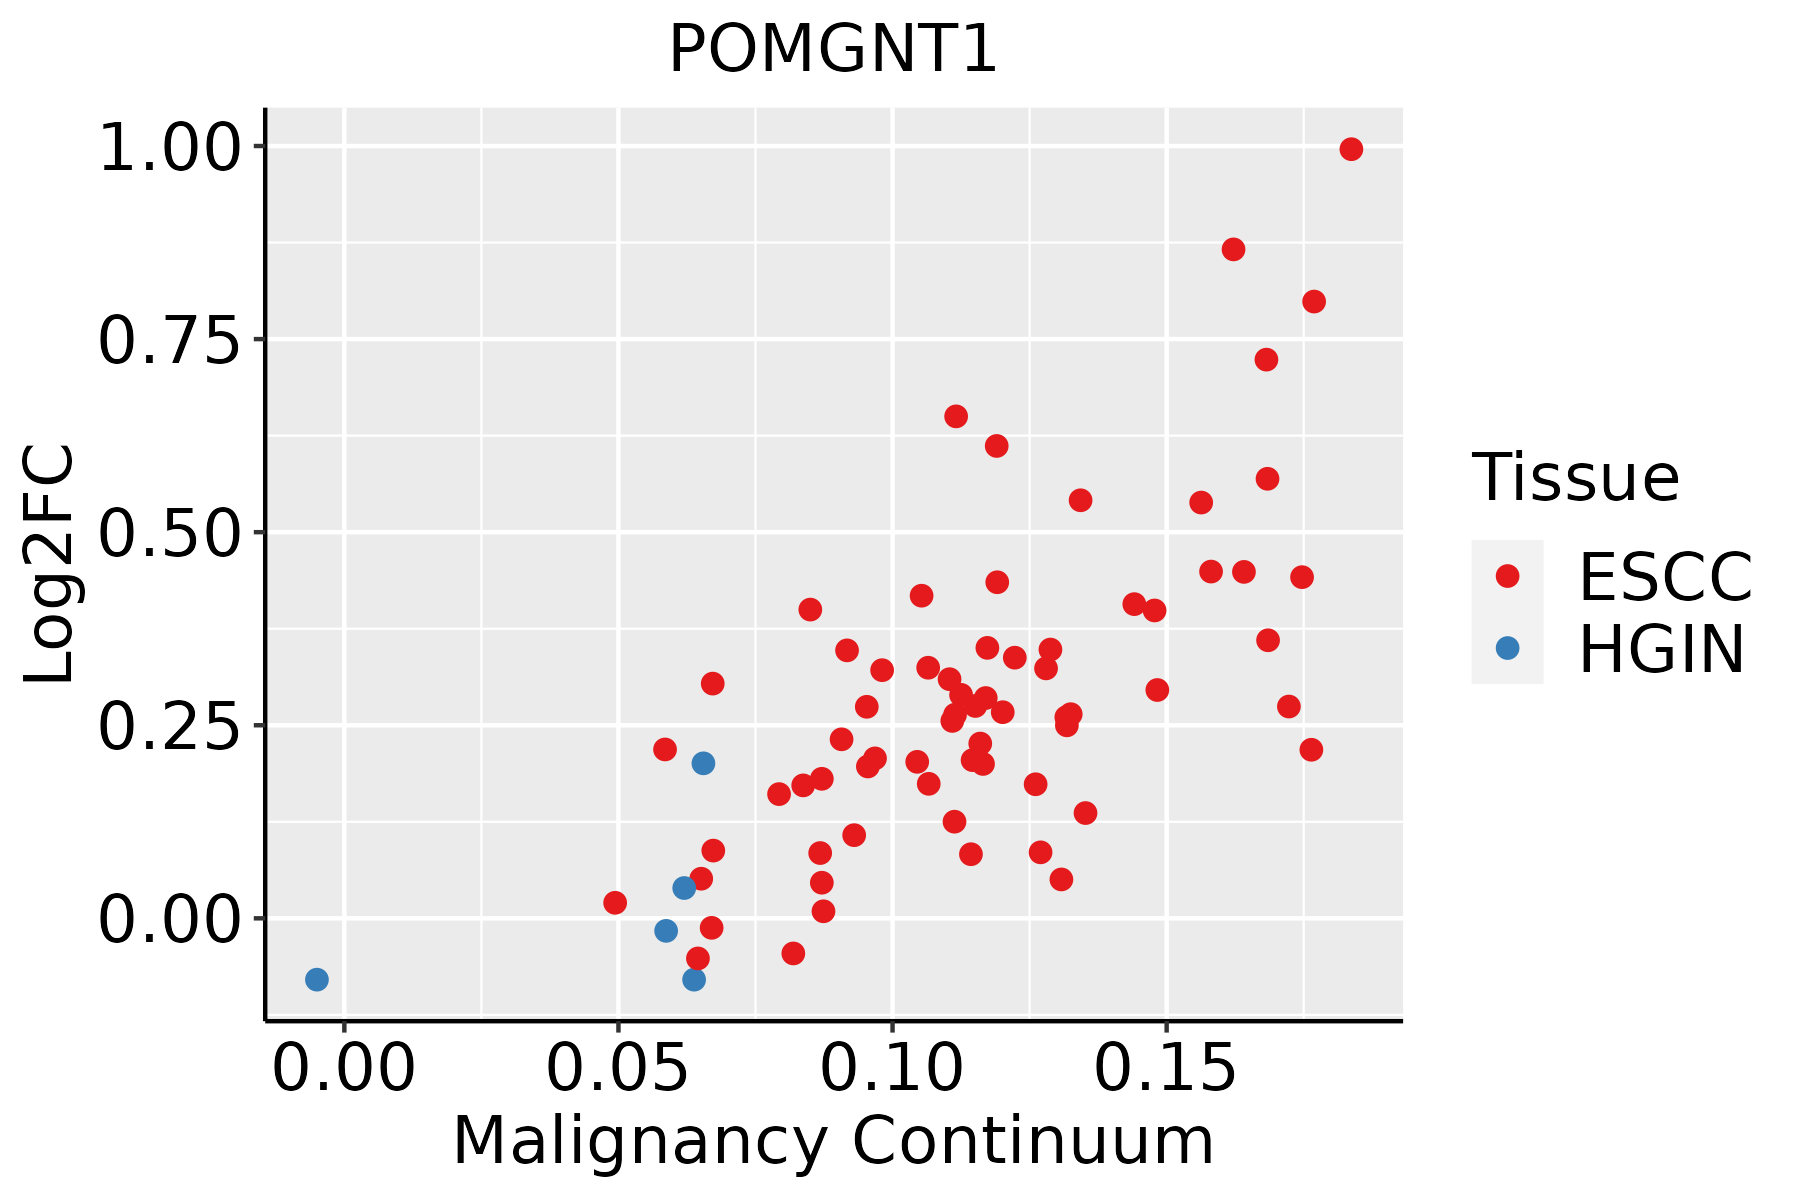 | ESCC: Esophageal squamous cell carcinoma |
| HGIN: High-grade intraepithelial neoplasias | ||
| LGIN: Low-grade intraepithelial neoplasias | ||
| Liver | 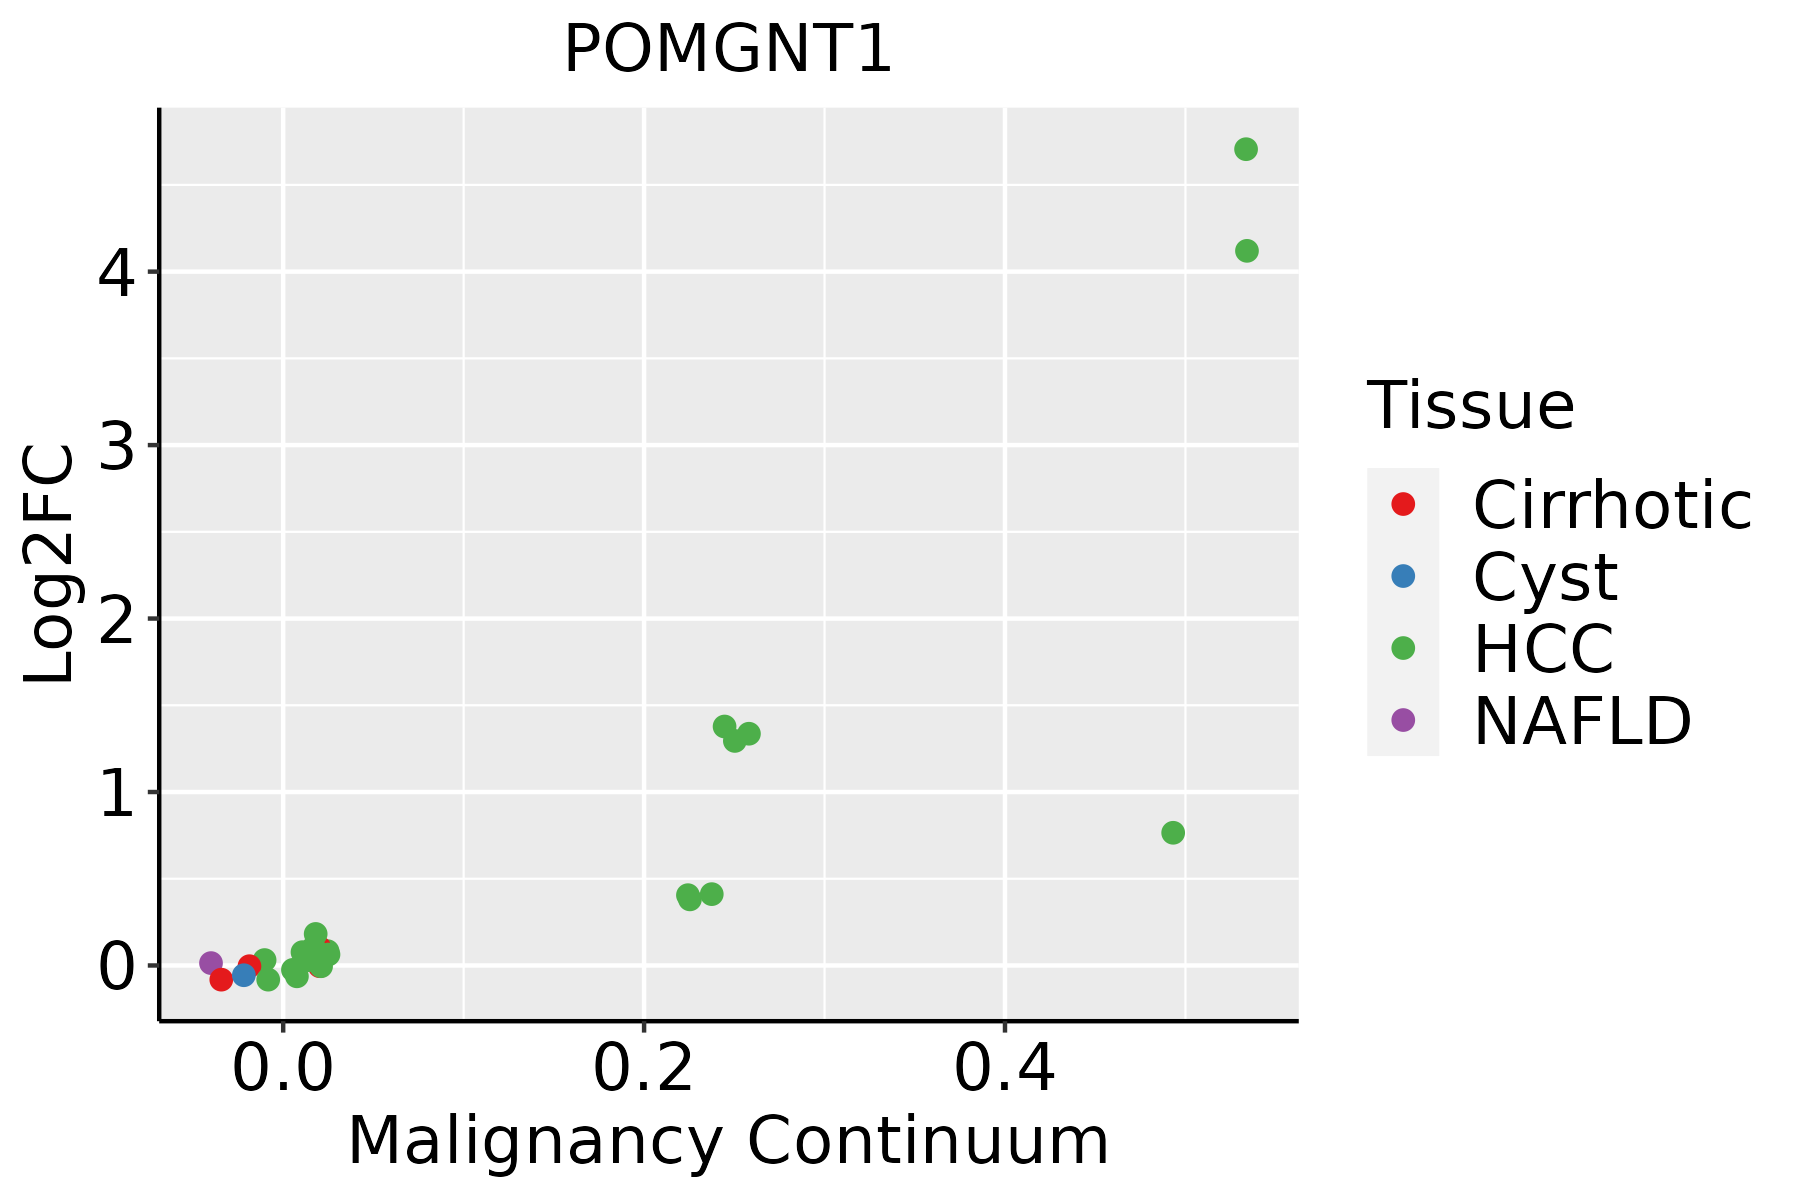 | HCC: Hepatocellular carcinoma |
| NAFLD: Non-alcoholic fatty liver disease | ||
| Oral Cavity | 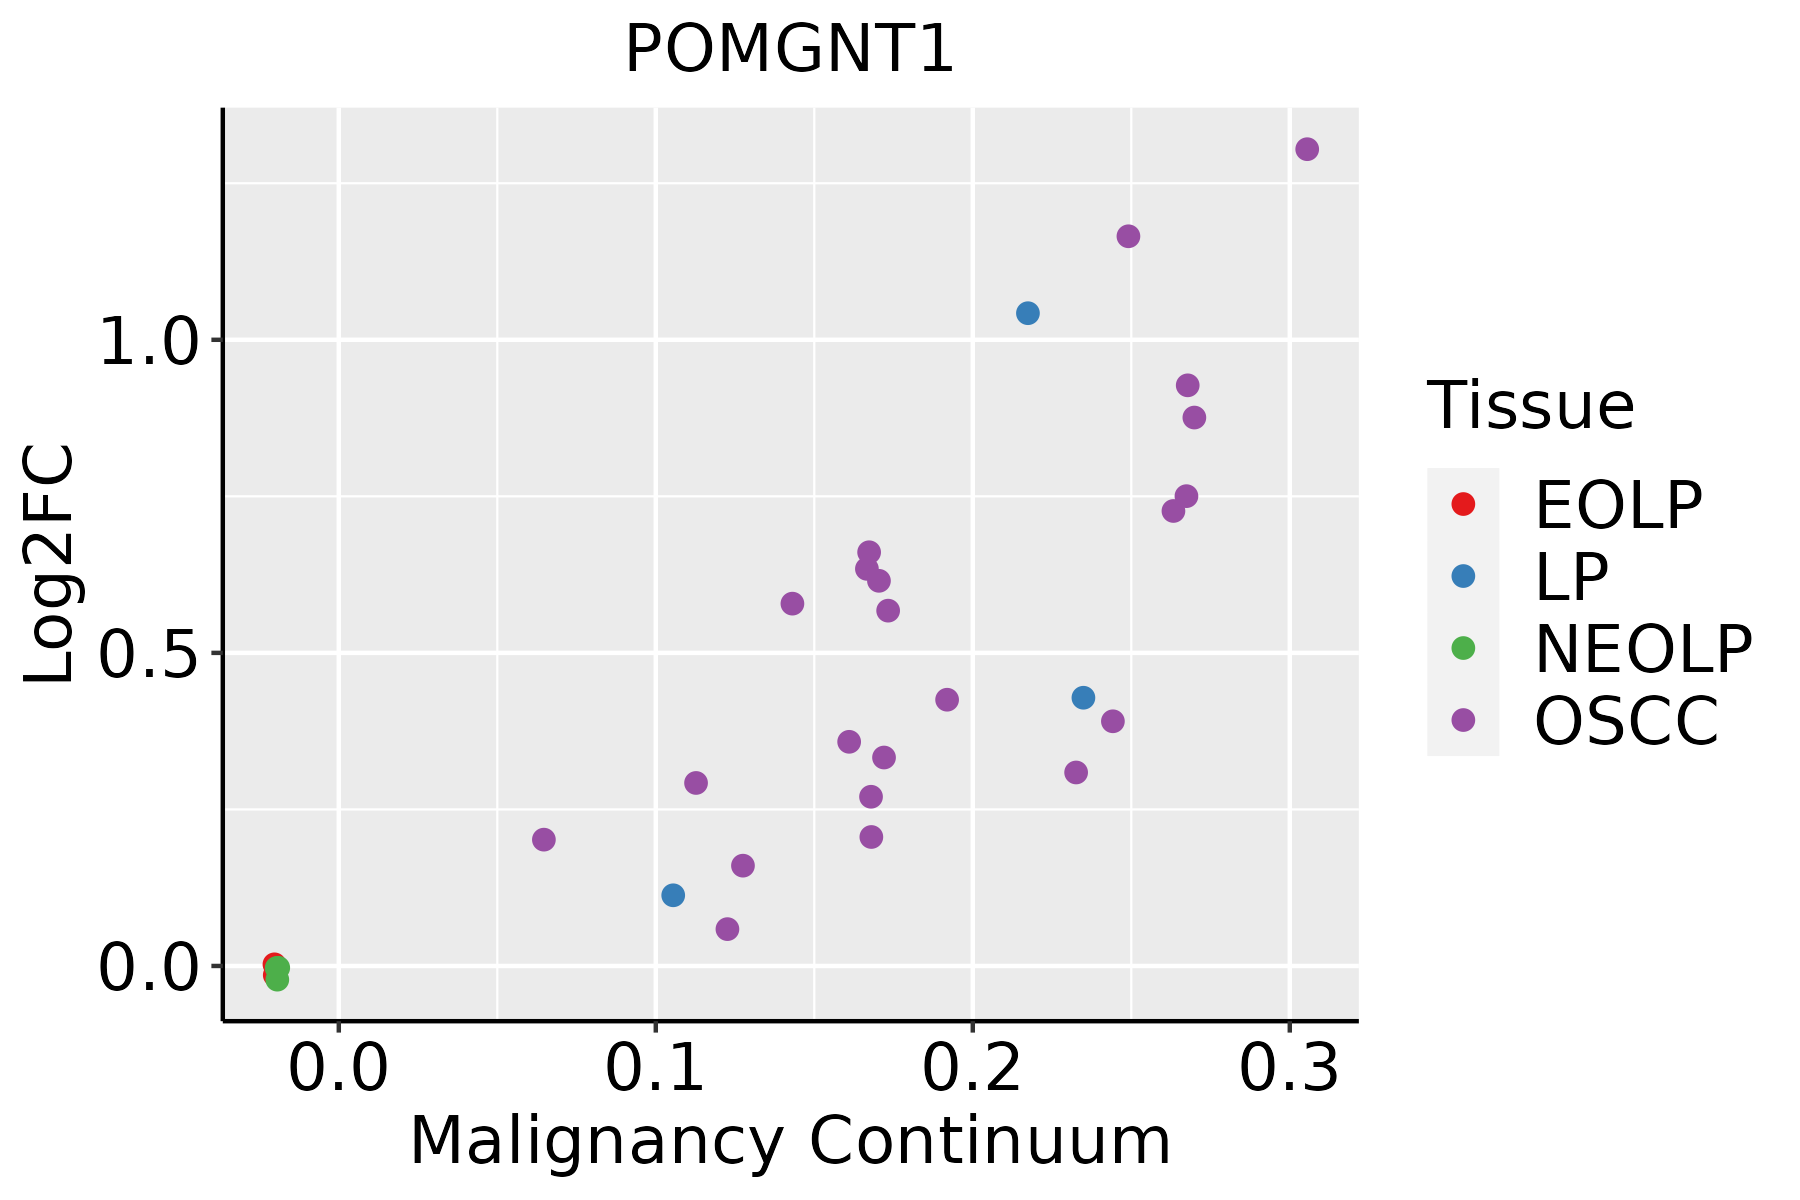 | EOLP: Erosive Oral lichen planus |
| LP: leukoplakia | ||
| NEOLP: Non-erosive oral lichen planus | ||
| OSCC: Oral squamous cell carcinoma | ||
| Skin | 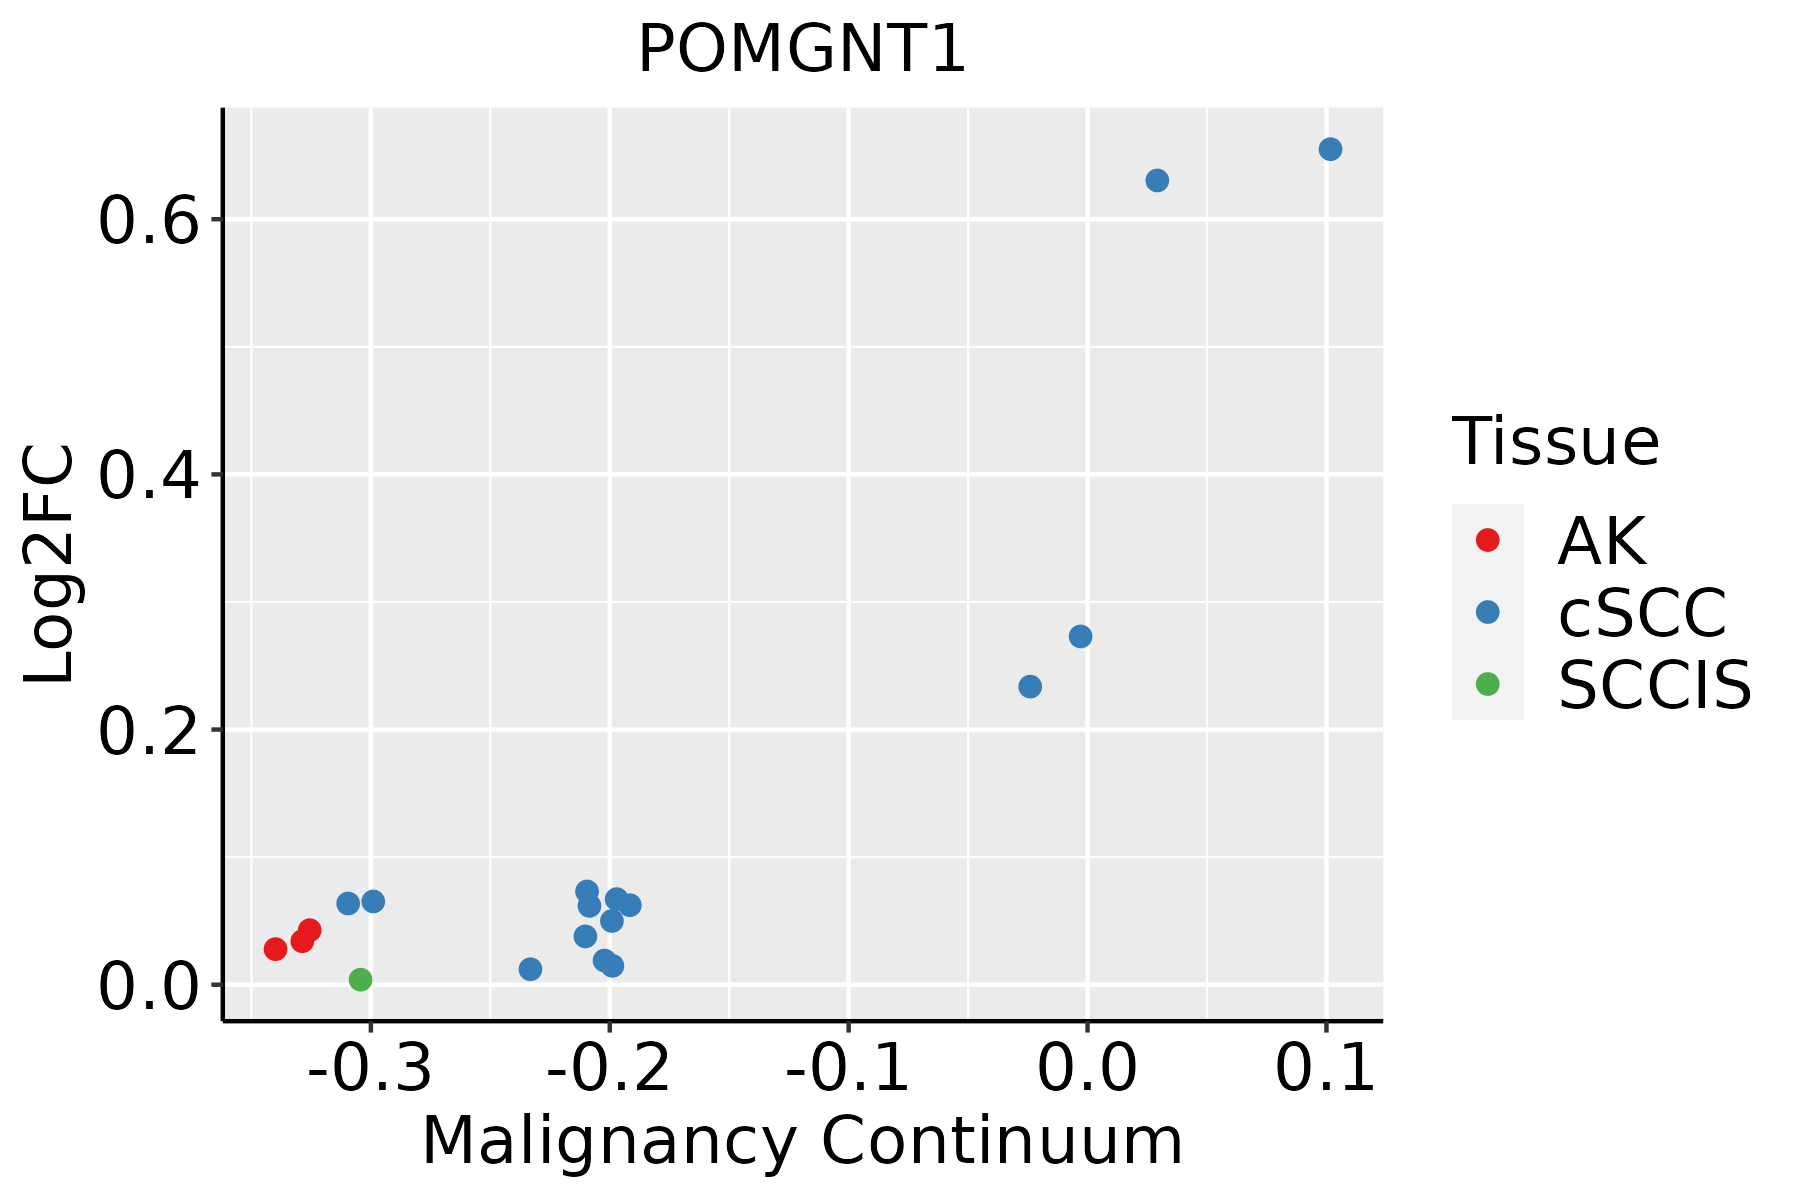 | AK: Actinic keratosis |
| cSCC: Cutaneous squamous cell carcinoma | ||
| SCCIS:squamous cell carcinoma in situ | ||
| Thyroid | 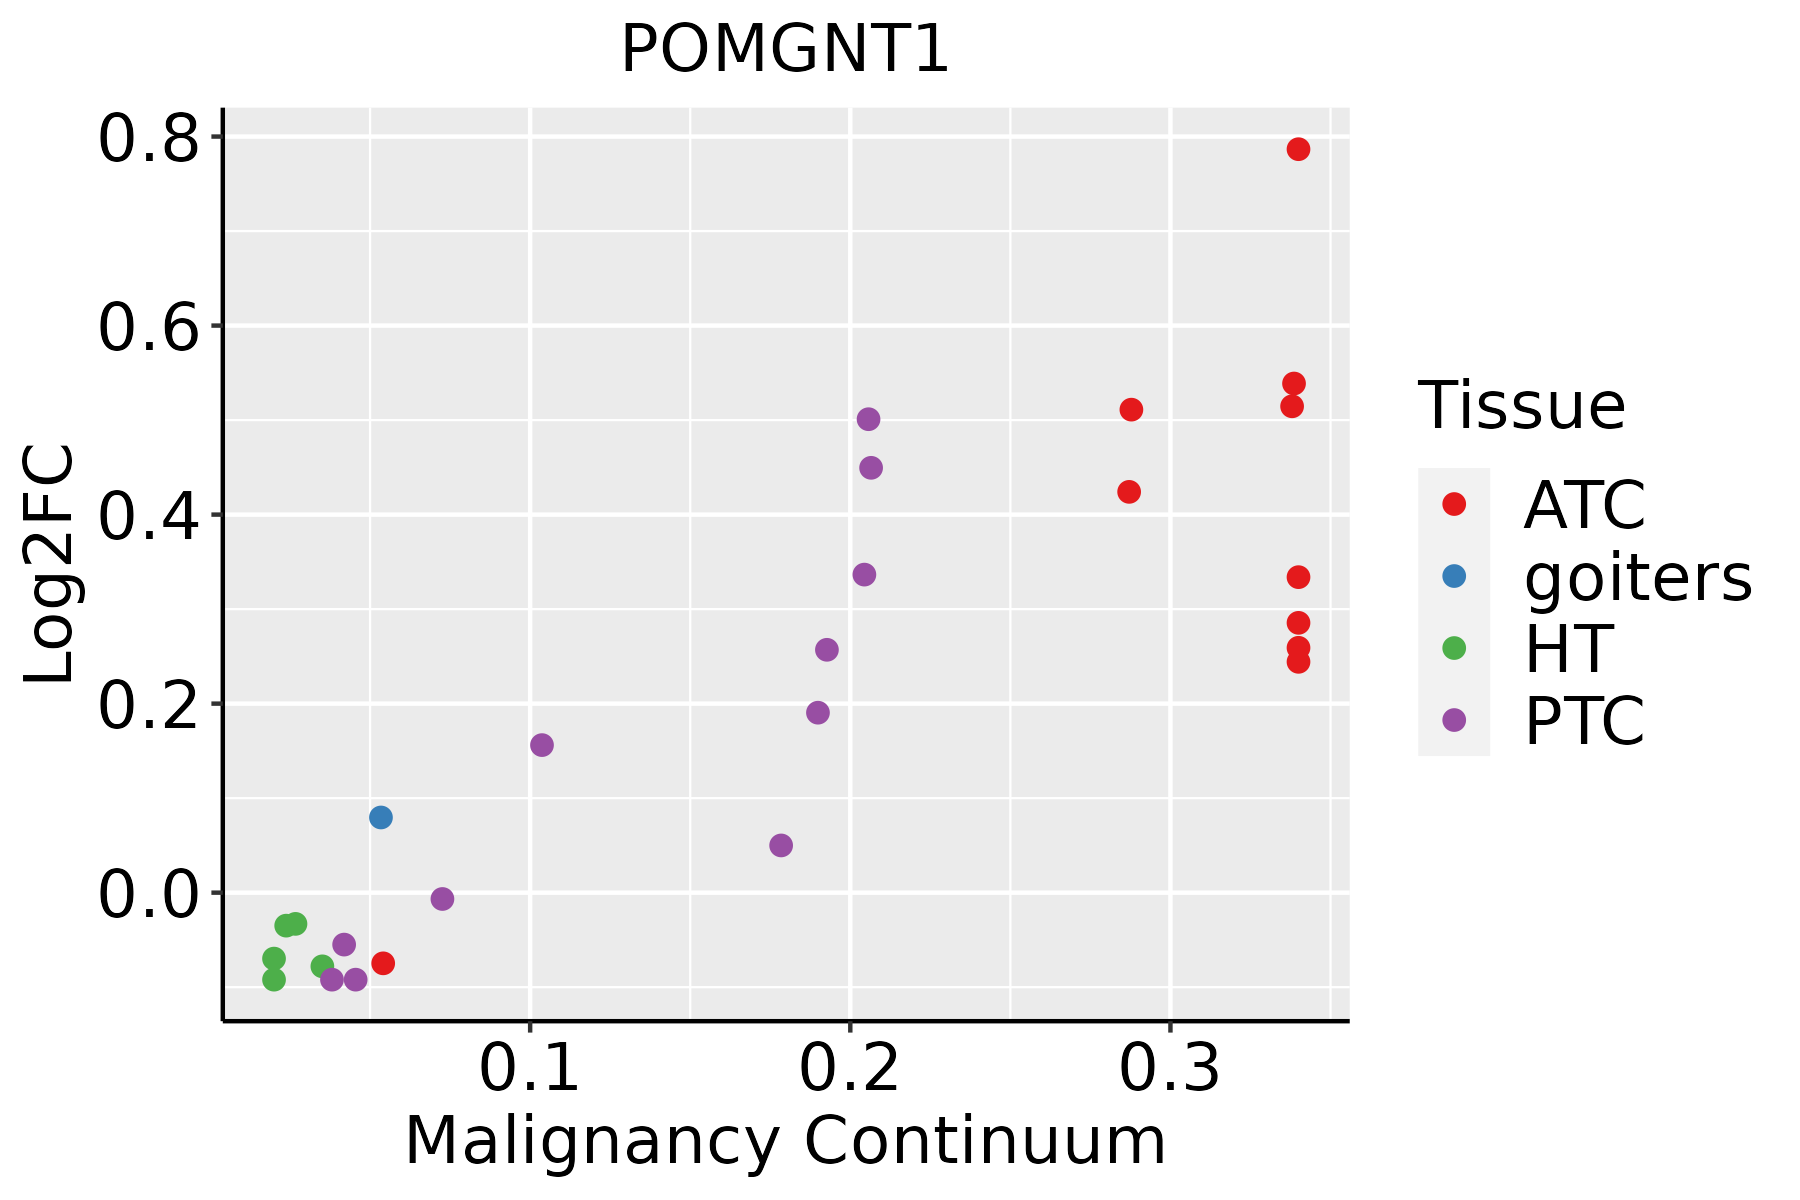 | ATC: Anaplastic thyroid cancer |
| HT: Hashimoto's thyroiditis | ||
| PTC: Papillary thyroid cancer |
| ∗log2FC in expression of this searched gene in stem-like cells from each diseased tissue sample relative to stem-like cells in normal samples in each tissue plotted against the malignancy continuum. Samples are colored based on if they are from different disease stage. |
Top |
Malignant transformation related pathway analysis |
| Find out the enriched GO biological processes and KEGG pathways involved in transition from healthy to precancer to cancer |
| Tissue | Disease Stage | Enriched GO biological Processes |
| Colorectum | AD |  |
| Colorectum | SER |  |
| Colorectum | MSS |  |
| Colorectum | MSI-H |  |
| Colorectum | FAP |  |
| ∗Top 15 enriched GO BP terms are showed in the bar plot of each disease state in each tissue. Each row represents a significant GO biological process which is colored according to the -log10(p.adjust). |
| Page: 1 2 3 4 5 6 7 8 9 |
| GO ID | Tissue | Disease Stage | Description | Gene Ratio | Bg Ratio | pvalue | p.adjust | Count |
| GO:00091002 | Esophagus | ESCC | glycoprotein metabolic process | 226/8552 | 387/18723 | 2.64e-07 | 3.94e-06 | 226 |
| GO:00700854 | Esophagus | ESCC | glycosylation | 144/8552 | 240/18723 | 5.12e-06 | 5.38e-05 | 144 |
| GO:00064865 | Esophagus | ESCC | protein glycosylation | 135/8552 | 226/18723 | 1.36e-05 | 1.24e-04 | 135 |
| GO:00434135 | Esophagus | ESCC | macromolecule glycosylation | 135/8552 | 226/18723 | 1.36e-05 | 1.24e-04 | 135 |
| GO:00091012 | Esophagus | ESCC | glycoprotein biosynthetic process | 181/8552 | 317/18723 | 2.54e-05 | 2.15e-04 | 181 |
| GO:00064931 | Esophagus | ESCC | protein O-linked glycosylation | 51/8552 | 86/18723 | 7.54e-03 | 2.70e-02 | 51 |
| GO:00064862 | Liver | HCC | protein glycosylation | 122/7958 | 226/18723 | 3.11e-04 | 2.21e-03 | 122 |
| GO:00434132 | Liver | HCC | macromolecule glycosylation | 122/7958 | 226/18723 | 3.11e-04 | 2.21e-03 | 122 |
| GO:00700852 | Liver | HCC | glycosylation | 128/7958 | 240/18723 | 4.35e-04 | 2.92e-03 | 128 |
| GO:0009100 | Liver | HCC | glycoprotein metabolic process | 193/7958 | 387/18723 | 1.89e-03 | 9.62e-03 | 193 |
| GO:00091001 | Oral cavity | OSCC | glycoprotein metabolic process | 185/7305 | 387/18723 | 2.37e-04 | 1.54e-03 | 185 |
| GO:00091011 | Oral cavity | OSCC | glycoprotein biosynthetic process | 151/7305 | 317/18723 | 1.01e-03 | 5.26e-03 | 151 |
| GO:00064864 | Oral cavity | OSCC | protein glycosylation | 111/7305 | 226/18723 | 1.22e-03 | 6.10e-03 | 111 |
| GO:00434134 | Oral cavity | OSCC | macromolecule glycosylation | 111/7305 | 226/18723 | 1.22e-03 | 6.10e-03 | 111 |
| GO:00700853 | Oral cavity | OSCC | glycosylation | 117/7305 | 240/18723 | 1.29e-03 | 6.42e-03 | 117 |
| GO:007008511 | Oral cavity | LP | glycosylation | 77/4623 | 240/18723 | 5.60e-03 | 3.38e-02 | 77 |
| GO:000648611 | Oral cavity | LP | protein glycosylation | 73/4623 | 226/18723 | 5.72e-03 | 3.44e-02 | 73 |
| GO:004341311 | Oral cavity | LP | macromolecule glycosylation | 73/4623 | 226/18723 | 5.72e-03 | 3.44e-02 | 73 |
| GO:00064866 | Thyroid | PTC | protein glycosylation | 94/5968 | 226/18723 | 1.25e-03 | 7.13e-03 | 94 |
| GO:00434136 | Thyroid | PTC | macromolecule glycosylation | 94/5968 | 226/18723 | 1.25e-03 | 7.13e-03 | 94 |
| Page: 1 2 |
| Pathway ID | Tissue | Disease Stage | Description | Gene Ratio | Bg Ratio | pvalue | p.adjust | qvalue | Count |
| Page: 1 |
Top |
Cell-cell communication analysis |
| Identification of potential cell-cell interactions between two cell types and their ligand-receptor pairs for different disease states |
| Ligand | Receptor | LRpair | Pathway | Tissue | Disease Stage |
| Page: 1 |
Top |
Single-cell gene regulatory network inference analysis |
| Find out the significant the regulons (TFs) and the target genes of each regulon across cell types for different disease states |
| TF | Cell Type | Tissue | Disease Stage | Target Gene | RSS | Regulon Activity |
| ∗The dot plots of a searched regulon are shown for all cell subpopulations in each disease state of each tissue based on the regulon specific score inferred using pySCENIC and by calculating the average expression. |
| Page: 1 |
Top |
Somatic mutation of malignant transformation related genes |
| Annotation of somatic variants for genes involved in malignant transformation |
| Hugo Symbol | Variant Class | Variant Classification | dbSNP RS | HGVSc | HGVSp | HGVSp Short | SWISSPROT | BIOTYPE | SIFT | PolyPhen | Tumor Sample Barcode | Tissue | Histology | Sex | Age | Stage | Therapy Types | Drugs | Outcome |
| POMGNT1 | SNV | Missense_Mutation | novel | c.1313N>T | p.Ala438Val | p.A438V | Q8WZA1 | protein_coding | possibly_damaging(0.524) | TCGA-3C-AALI-01 | Breast | breast invasive carcinoma | Female | <65 | I/II | Unspecific | Poly E | Complete Response | |
| POMGNT1 | SNV | Missense_Mutation | c.2120N>T | p.Ala707Val | p.A707V | Q8WZA1 | protein_coding | benign(0.076) | TCGA-AN-A0AK-01 | Breast | breast invasive carcinoma | Female | >=65 | I/II | Unknown | Unknown | SD | ||
| POMGNT1 | SNV | Missense_Mutation | novel | c.1540G>C | p.Glu514Gln | p.E514Q | Q8WZA1 | protein_coding | possibly_damaging(0.707) | TCGA-C8-A3M7-01 | Breast | breast invasive carcinoma | Female | <65 | III/IV | Unknown | Unknown | PD | |
| POMGNT1 | SNV | Missense_Mutation | c.455A>G | p.Tyr152Cys | p.Y152C | Q8WZA1 | protein_coding | probably_damaging(0.997) | TCGA-A6-2686-01 | Colorectum | colon adenocarcinoma | Female | >=65 | I/II | Unknown | Unknown | SD | ||
| POMGNT1 | SNV | Missense_Mutation | rs778179887 | c.1157C>T | p.Ala386Val | p.A386V | Q8WZA1 | protein_coding | probably_damaging(0.997) | TCGA-A6-5665-01 | Colorectum | colon adenocarcinoma | Female | >=65 | I/II | Unknown | Unknown | PD | |
| POMGNT1 | SNV | Missense_Mutation | c.1247N>G | p.Asp416Gly | p.D416G | Q8WZA1 | protein_coding | probably_damaging(0.997) | TCGA-AA-3715-01 | Colorectum | colon adenocarcinoma | Male | >=65 | I/II | Unknown | Unknown | PD | ||
| POMGNT1 | SNV | Missense_Mutation | c.1184N>G | p.Asp395Gly | p.D395G | Q8WZA1 | protein_coding | probably_damaging(1) | TCGA-AA-3966-01 | Colorectum | colon adenocarcinoma | Female | >=65 | I/II | Unknown | Unknown | SD | ||
| POMGNT1 | SNV | Missense_Mutation | c.2009N>G | p.Phe670Cys | p.F670C | Q8WZA1 | protein_coding | probably_damaging(0.971) | TCGA-AA-A010-01 | Colorectum | colon adenocarcinoma | Female | <65 | I/II | Chemotherapy | folinic | CR | ||
| POMGNT1 | SNV | Missense_Mutation | c.589G>T | p.Gly197Cys | p.G197C | Q8WZA1 | protein_coding | probably_damaging(1) | TCGA-CK-4951-01 | Colorectum | colon adenocarcinoma | Female | >=65 | I/II | Unknown | Unknown | PD | ||
| POMGNT1 | SNV | Missense_Mutation | rs756234628 | c.800N>A | p.Arg267His | p.R267H | Q8WZA1 | protein_coding | benign(0.36) | TCGA-D5-6930-01 | Colorectum | colon adenocarcinoma | Male | >=65 | I/II | Unknown | Unknown | SD |
| Page: 1 2 3 4 5 6 7 |
Top |
Related drugs of malignant transformation related genes |
| Identification of chemicals and drugs interact with genes involved in malignant transfromation |
| (DGIdb 4.0) |
| Entrez ID | Symbol | Category | Interaction Types | Drug Claim Name | Drug Name | PMIDs |
| Page: 1 |

Copyright 2023-Present -The University of Texas Health Science Center at Houston |