
|
|||||
|
 | |
| |
| |
| |
| |
| |
|
Gene: POLR3K |
Gene summary for POLR3K |
| Gene information | Species | Human | Gene symbol | POLR3K | Gene ID | 51728 |
| Gene name | RNA polymerase III subunit K | |
| Gene Alias | C11 | |
| Cytomap | 16p13.3 | |
| Gene Type | protein-coding | GO ID | GO:0002376 | UniProtAcc | Q9Y2Y1 |
Top |
Malignant transformation analysis |
| Identification of the aberrant gene expression in precancerous and cancerous lesions by comparing the gene expression of stem-like cells in diseased tissues with normal stem cells |
| Entrez ID | Symbol | Replicates | Species | Organ | Tissue | Adj P-value | Log2FC | Malignancy |
| 51728 | POLR3K | GSM4909282 | Human | Breast | IDC | 7.33e-04 | 2.54e-01 | -0.0288 |
| 51728 | POLR3K | GSM4909290 | Human | Breast | IDC | 7.47e-05 | 2.91e-01 | 0.2096 |
| 51728 | POLR3K | GSM4909293 | Human | Breast | IDC | 2.10e-06 | 1.61e-01 | 0.1581 |
| 51728 | POLR3K | GSM4909298 | Human | Breast | IDC | 2.00e-06 | 2.22e-01 | 0.1551 |
| 51728 | POLR3K | GSM4909301 | Human | Breast | IDC | 4.88e-06 | 2.58e-01 | 0.1577 |
| 51728 | POLR3K | GSM4909304 | Human | Breast | IDC | 3.06e-09 | 3.32e-01 | 0.1636 |
| 51728 | POLR3K | GSM4909305 | Human | Breast | IDC | 1.99e-04 | 2.73e-01 | 0.0436 |
| 51728 | POLR3K | GSM4909306 | Human | Breast | IDC | 1.30e-25 | 5.76e-01 | 0.1564 |
| 51728 | POLR3K | GSM4909307 | Human | Breast | IDC | 1.01e-06 | 3.19e-01 | 0.1569 |
| 51728 | POLR3K | GSM4909308 | Human | Breast | IDC | 8.99e-20 | 4.74e-01 | 0.158 |
| 51728 | POLR3K | GSM4909319 | Human | Breast | IDC | 1.89e-05 | 9.64e-02 | 0.1563 |
| 51728 | POLR3K | M5 | Human | Breast | IDC | 1.91e-03 | 5.08e-01 | 0.1598 |
| 51728 | POLR3K | NCCBC5 | Human | Breast | DCIS | 1.40e-02 | 1.62e-01 | 0.2046 |
| 51728 | POLR3K | DCIS2 | Human | Breast | DCIS | 1.87e-22 | 3.97e-02 | 0.0085 |
| 51728 | POLR3K | LZE4T | Human | Esophagus | ESCC | 2.35e-07 | 2.53e-01 | 0.0811 |
| 51728 | POLR3K | LZE5T | Human | Esophagus | ESCC | 5.11e-04 | 4.83e-01 | 0.0514 |
| 51728 | POLR3K | LZE7T | Human | Esophagus | ESCC | 4.18e-10 | 5.77e-01 | 0.0667 |
| 51728 | POLR3K | LZE8T | Human | Esophagus | ESCC | 8.72e-05 | 2.91e-01 | 0.067 |
| 51728 | POLR3K | LZE20T | Human | Esophagus | ESCC | 1.67e-12 | 3.81e-01 | 0.0662 |
| 51728 | POLR3K | LZE24T | Human | Esophagus | ESCC | 7.50e-23 | 5.00e-01 | 0.0596 |
| Page: 1 2 3 4 5 6 |
| Tissue | Expression Dynamics | Abbreviation |
| Breast |  | IDC: Invasive ductal carcinoma |
| DCIS: Ductal carcinoma in situ | ||
| Precancer(BRCA1-mut): Precancerous lesion from BRCA1 mutation carriers | ||
| Esophagus | 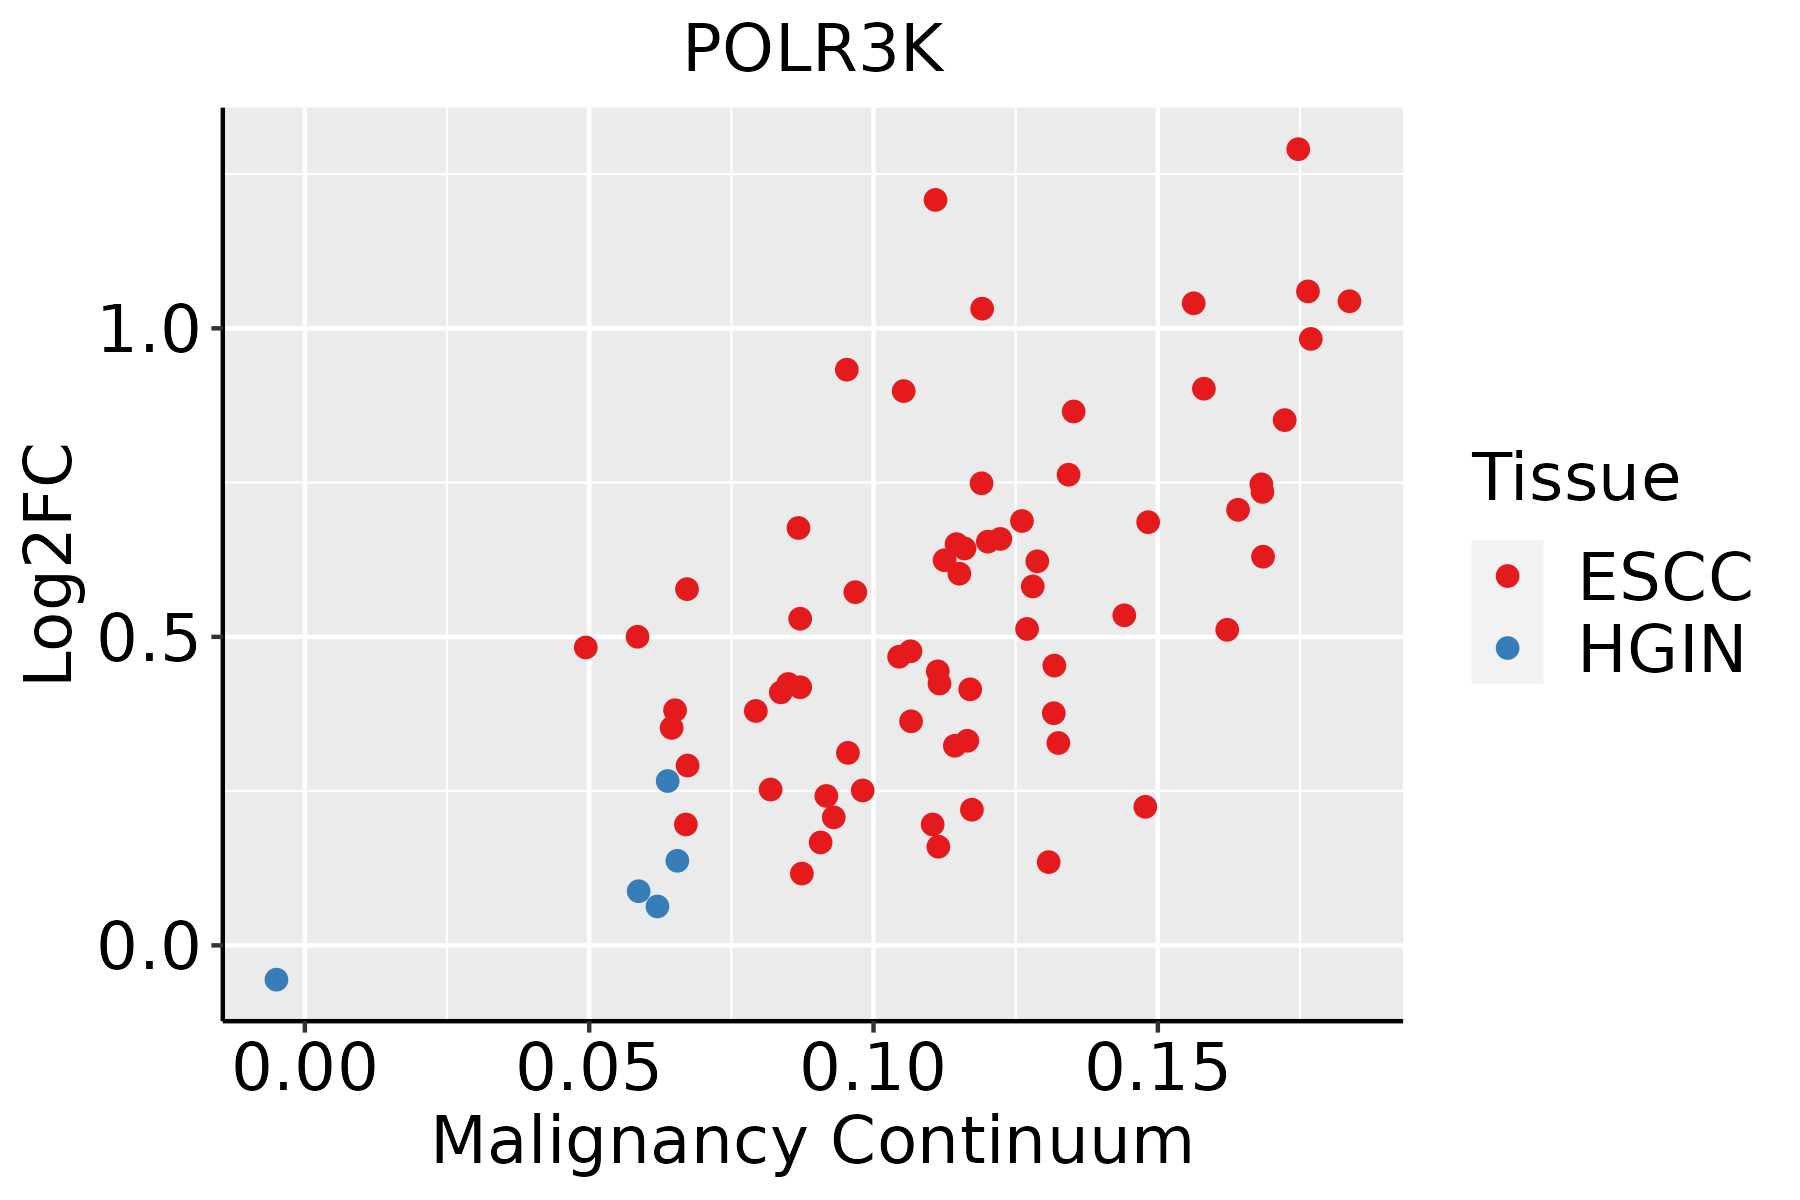 | ESCC: Esophageal squamous cell carcinoma |
| HGIN: High-grade intraepithelial neoplasias | ||
| LGIN: Low-grade intraepithelial neoplasias | ||
| Liver | 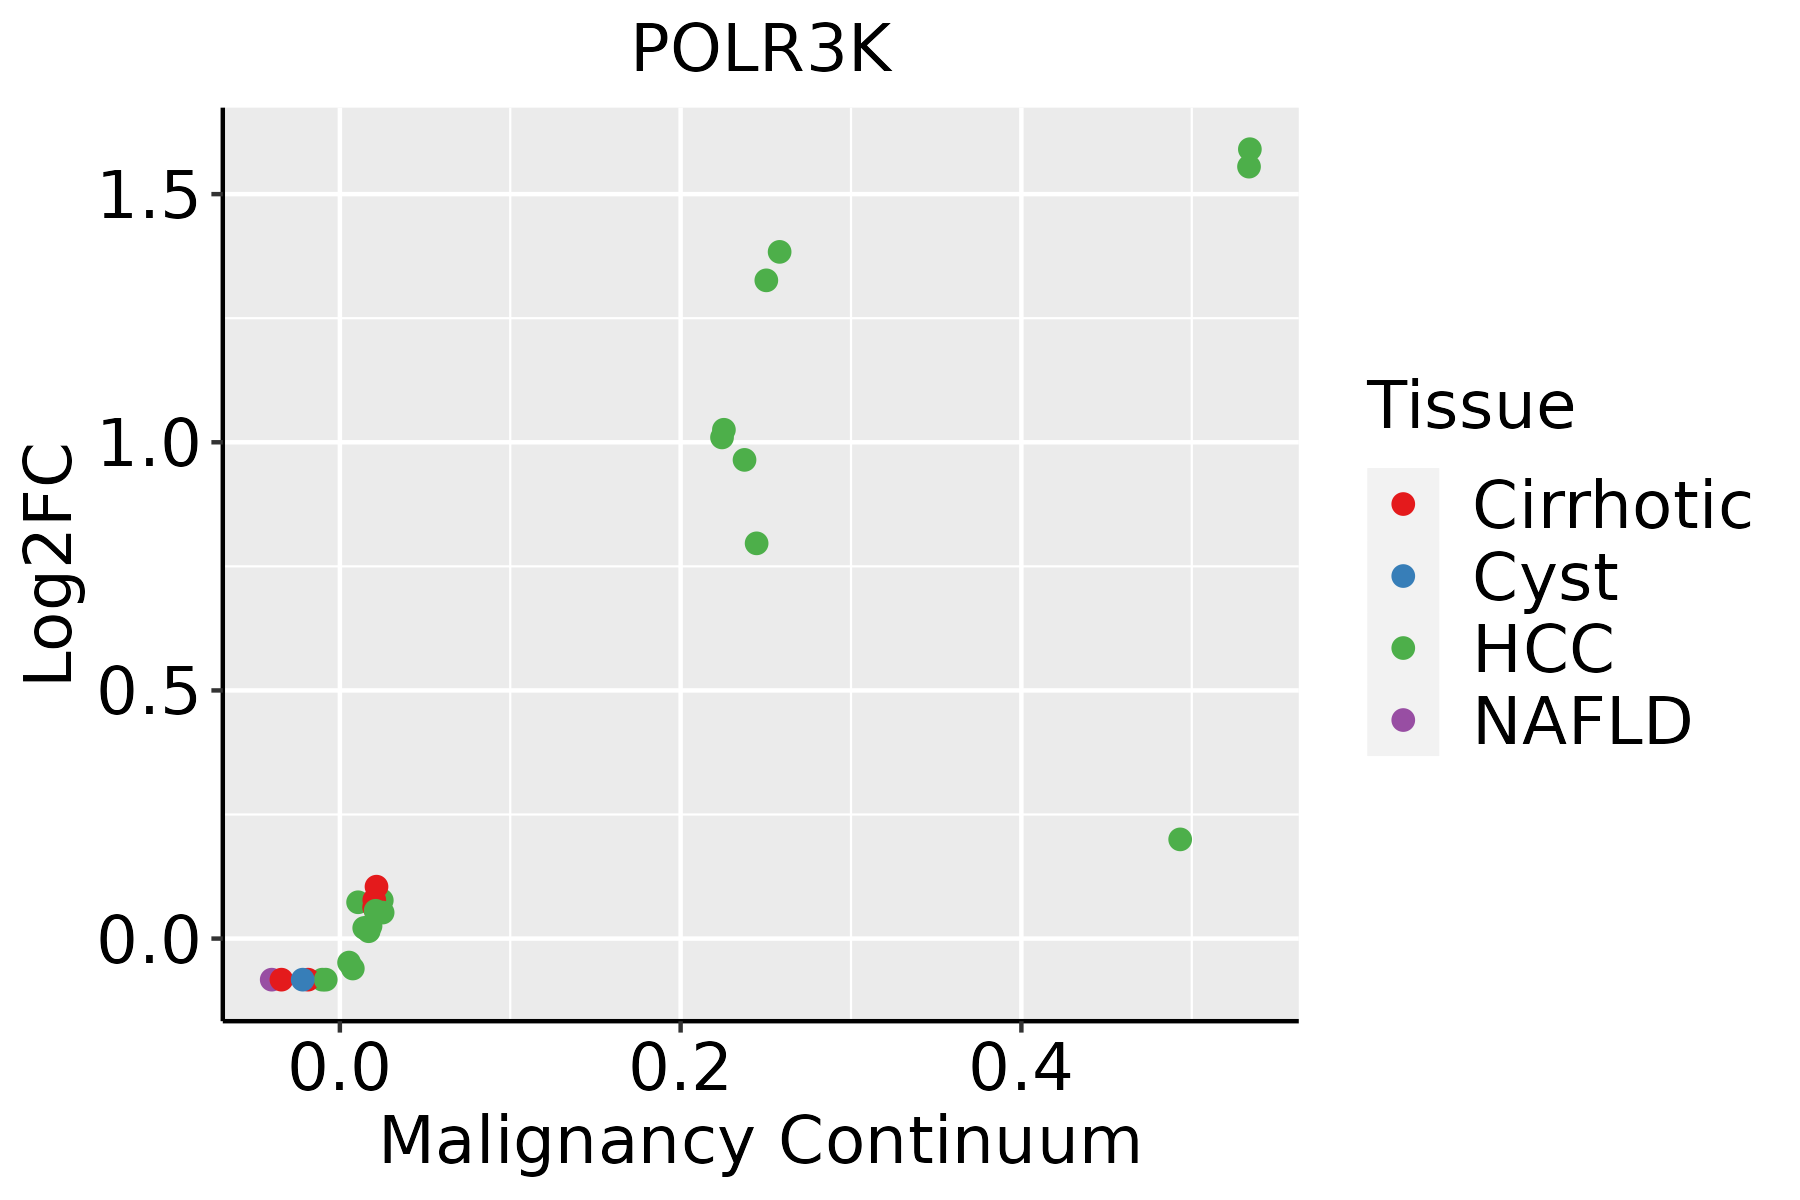 | HCC: Hepatocellular carcinoma |
| NAFLD: Non-alcoholic fatty liver disease | ||
| Oral Cavity | 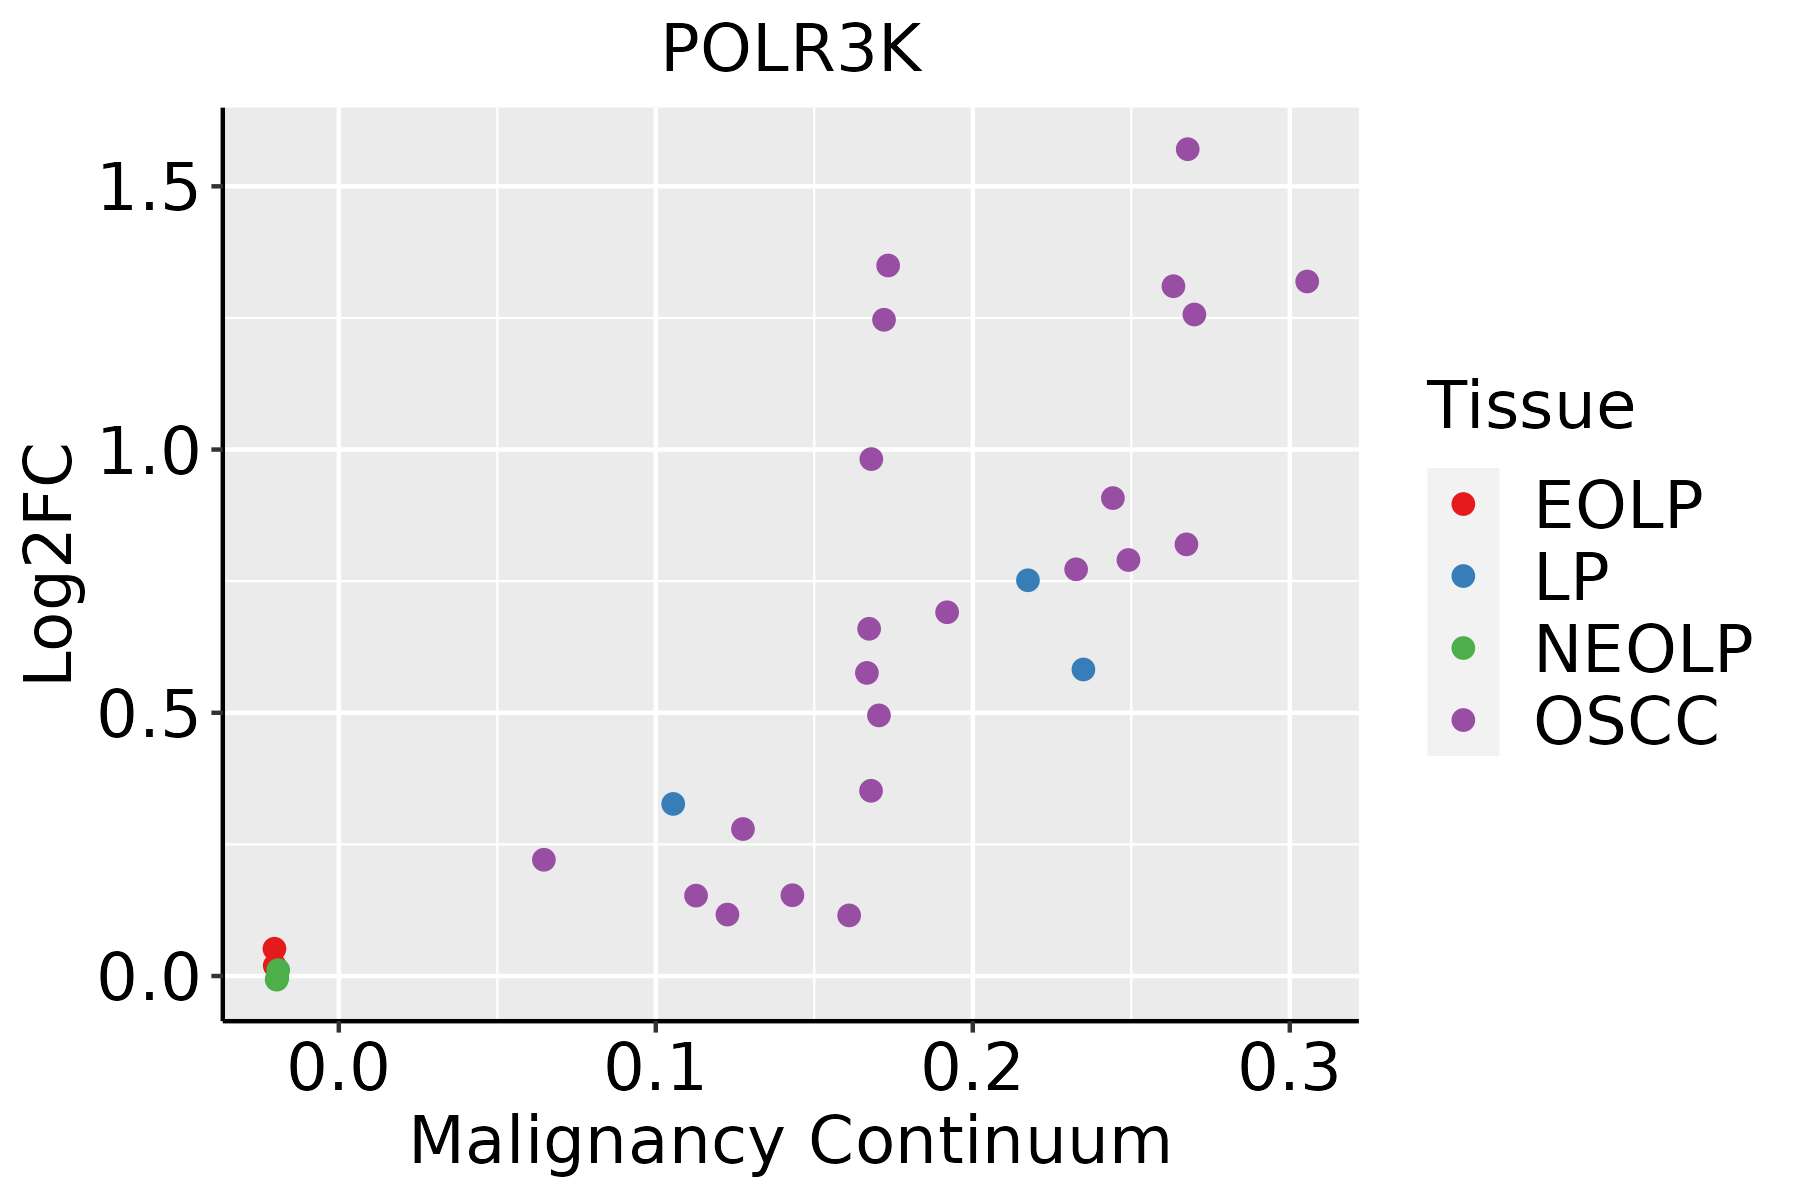 | EOLP: Erosive Oral lichen planus |
| LP: leukoplakia | ||
| NEOLP: Non-erosive oral lichen planus | ||
| OSCC: Oral squamous cell carcinoma | ||
| Skin |  | AK: Actinic keratosis |
| cSCC: Cutaneous squamous cell carcinoma | ||
| SCCIS:squamous cell carcinoma in situ |
| ∗log2FC in expression of this searched gene in stem-like cells from each diseased tissue sample relative to stem-like cells in normal samples in each tissue plotted against the malignancy continuum. Samples are colored based on if they are from different disease stage. |
Top |
Malignant transformation related pathway analysis |
| Find out the enriched GO biological processes and KEGG pathways involved in transition from healthy to precancer to cancer |
| Tissue | Disease Stage | Enriched GO biological Processes |
| Colorectum | AD |  |
| Colorectum | SER |  |
| Colorectum | MSS |  |
| Colorectum | MSI-H |  |
| Colorectum | FAP |  |
| ∗Top 15 enriched GO BP terms are showed in the bar plot of each disease state in each tissue. Each row represents a significant GO biological process which is colored according to the -log10(p.adjust). |
| Page: 1 2 3 4 5 6 7 8 9 |
| GO ID | Tissue | Disease Stage | Description | Gene Ratio | Bg Ratio | pvalue | p.adjust | Count |
| GO:00096157 | Breast | IDC | response to virus | 47/1434 | 367/18723 | 3.53e-04 | 5.16e-03 | 47 |
| GO:000961512 | Breast | DCIS | response to virus | 45/1390 | 367/18723 | 6.16e-04 | 7.82e-03 | 45 |
| GO:003447011 | Breast | DCIS | ncRNA processing | 44/1390 | 395/18723 | 4.56e-03 | 3.49e-02 | 44 |
| GO:003447015 | Esophagus | ESCC | ncRNA processing | 300/8552 | 395/18723 | 3.09e-35 | 3.26e-32 | 300 |
| GO:003466012 | Esophagus | ESCC | ncRNA metabolic process | 346/8552 | 485/18723 | 4.35e-31 | 2.51e-28 | 346 |
| GO:000961518 | Esophagus | ESCC | response to virus | 238/8552 | 367/18723 | 6.65e-14 | 3.32e-12 | 238 |
| GO:00905013 | Esophagus | ESCC | RNA phosphodiester bond hydrolysis | 110/8552 | 152/18723 | 1.95e-11 | 6.81e-10 | 110 |
| GO:00516075 | Esophagus | ESCC | defense response to virus | 171/8552 | 265/18723 | 3.91e-10 | 1.05e-08 | 171 |
| GO:01405465 | Esophagus | ESCC | defense response to symbiont | 171/8552 | 265/18723 | 3.91e-10 | 1.05e-08 | 171 |
| GO:00063833 | Esophagus | ESCC | transcription by RNA polymerase III | 41/8552 | 46/18723 | 7.69e-10 | 1.90e-08 | 41 |
| GO:00080333 | Esophagus | ESCC | tRNA processing | 92/8552 | 127/18723 | 7.83e-10 | 1.93e-08 | 92 |
| GO:00063992 | Esophagus | ESCC | tRNA metabolic process | 122/8552 | 179/18723 | 9.03e-10 | 2.19e-08 | 122 |
| GO:00903053 | Esophagus | ESCC | nucleic acid phosphodiester bond hydrolysis | 163/8552 | 261/18723 | 3.07e-08 | 5.73e-07 | 163 |
| GO:00311233 | Esophagus | ESCC | RNA 3'-end processing | 76/8552 | 116/18723 | 1.25e-05 | 1.15e-04 | 76 |
| GO:00063532 | Esophagus | ESCC | DNA-templated transcription, termination | 15/8552 | 21/18723 | 1.54e-02 | 4.96e-02 | 15 |
| GO:00344702 | Liver | HCC | ncRNA processing | 293/7958 | 395/18723 | 4.26e-38 | 6.76e-35 | 293 |
| GO:00346601 | Liver | HCC | ncRNA metabolic process | 332/7958 | 485/18723 | 1.48e-31 | 7.80e-29 | 332 |
| GO:00905011 | Liver | HCC | RNA phosphodiester bond hydrolysis | 101/7958 | 152/18723 | 1.99e-09 | 5.63e-08 | 101 |
| GO:00311231 | Liver | HCC | RNA 3'-end processing | 81/7958 | 116/18723 | 2.27e-09 | 6.32e-08 | 81 |
| GO:0008033 | Liver | HCC | tRNA processing | 87/7958 | 127/18723 | 2.66e-09 | 7.23e-08 | 87 |
| Page: 1 2 3 |
| Pathway ID | Tissue | Disease Stage | Description | Gene Ratio | Bg Ratio | pvalue | p.adjust | qvalue | Count |
| hsa0302021 | Esophagus | ESCC | RNA polymerase | 28/4205 | 34/8465 | 8.19e-05 | 3.35e-04 | 1.71e-04 | 28 |
| hsa046234 | Esophagus | ESCC | Cytosolic DNA-sensing pathway | 49/4205 | 75/8465 | 4.35e-03 | 1.12e-02 | 5.74e-03 | 49 |
| hsa0302031 | Esophagus | ESCC | RNA polymerase | 28/4205 | 34/8465 | 8.19e-05 | 3.35e-04 | 1.71e-04 | 28 |
| hsa0462311 | Esophagus | ESCC | Cytosolic DNA-sensing pathway | 49/4205 | 75/8465 | 4.35e-03 | 1.12e-02 | 5.74e-03 | 49 |
| hsa030204 | Oral cavity | OSCC | RNA polymerase | 25/3704 | 34/8465 | 4.12e-04 | 1.27e-03 | 6.45e-04 | 25 |
| hsa04623 | Oral cavity | OSCC | Cytosolic DNA-sensing pathway | 44/3704 | 75/8465 | 6.44e-03 | 1.51e-02 | 7.68e-03 | 44 |
| hsa0302011 | Oral cavity | OSCC | RNA polymerase | 25/3704 | 34/8465 | 4.12e-04 | 1.27e-03 | 6.45e-04 | 25 |
| hsa046231 | Oral cavity | OSCC | Cytosolic DNA-sensing pathway | 44/3704 | 75/8465 | 6.44e-03 | 1.51e-02 | 7.68e-03 | 44 |
| hsa046232 | Oral cavity | LP | Cytosolic DNA-sensing pathway | 31/2418 | 75/8465 | 1.17e-02 | 3.91e-02 | 2.52e-02 | 31 |
| hsa046233 | Oral cavity | LP | Cytosolic DNA-sensing pathway | 31/2418 | 75/8465 | 1.17e-02 | 3.91e-02 | 2.52e-02 | 31 |
| Page: 1 |
Top |
Cell-cell communication analysis |
| Identification of potential cell-cell interactions between two cell types and their ligand-receptor pairs for different disease states |
| Ligand | Receptor | LRpair | Pathway | Tissue | Disease Stage |
| Page: 1 |
Top |
Single-cell gene regulatory network inference analysis |
| Find out the significant the regulons (TFs) and the target genes of each regulon across cell types for different disease states |
| TF | Cell Type | Tissue | Disease Stage | Target Gene | RSS | Regulon Activity |
| ∗The dot plots of a searched regulon are shown for all cell subpopulations in each disease state of each tissue based on the regulon specific score inferred using pySCENIC and by calculating the average expression. |
| Page: 1 |
Top |
Somatic mutation of malignant transformation related genes |
| Annotation of somatic variants for genes involved in malignant transformation |
| Hugo Symbol | Variant Class | Variant Classification | dbSNP RS | HGVSc | HGVSp | HGVSp Short | SWISSPROT | BIOTYPE | SIFT | PolyPhen | Tumor Sample Barcode | Tissue | Histology | Sex | Age | Stage | Therapy Types | Drugs | Outcome |
| POLR3K | SNV | Missense_Mutation | rs144406744 | c.226N>T | p.Arg76Cys | p.R76C | Q9Y2Y1 | protein_coding | deleterious(0.03) | benign(0.111) | TCGA-A8-A06P-01 | Breast | breast invasive carcinoma | Female | <65 | III/IV | Unspecific | SD | |
| POLR3K | SNV | Missense_Mutation | rs182344447 | c.314N>A | p.Arg105His | p.R105H | Q9Y2Y1 | protein_coding | deleterious(0.03) | benign(0.038) | TCGA-CM-6162-01 | Colorectum | colon adenocarcinoma | Female | <65 | III/IV | Chemotherapy | oxaliplatin | SD |
| POLR3K | SNV | Missense_Mutation | rs867241220 | c.203N>T | p.Ser68Leu | p.S68L | Q9Y2Y1 | protein_coding | tolerated(0.26) | benign(0.015) | TCGA-AG-A002-01 | Colorectum | rectum adenocarcinoma | Male | <65 | I/II | Unknown | Unknown | SD |
| POLR3K | SNV | Missense_Mutation | rs763310172 | c.227G>A | p.Arg76His | p.R76H | Q9Y2Y1 | protein_coding | tolerated(0.06) | benign(0.16) | TCGA-A5-A2K5-01 | Endometrium | uterine corpus endometrioid carcinoma | Female | >=65 | I/II | Unknown | Unknown | SD |
| POLR3K | SNV | Missense_Mutation | rs745993040 | c.254N>A | p.Arg85His | p.R85H | Q9Y2Y1 | protein_coding | deleterious(0) | benign(0.2) | TCGA-EO-A3B0-01 | Endometrium | uterine corpus endometrioid carcinoma | Female | <65 | III/IV | Unknown | Unknown | SD |
| POLR3K | SNV | Missense_Mutation | c.46N>A | p.Glu16Lys | p.E16K | Q9Y2Y1 | protein_coding | tolerated(0.29) | benign(0.162) | TCGA-55-7995-01 | Lung | lung adenocarcinoma | Female | >=65 | I/II | Chemotherapy | carboplatin | CR | |
| POLR3K | SNV | Missense_Mutation | novel | c.148G>C | p.Asp50His | p.D50H | Q9Y2Y1 | protein_coding | deleterious(0.02) | benign(0.36) | TCGA-86-6851-01 | Lung | lung adenocarcinoma | Female | >=65 | I/II | Unknown | Unknown | SD |
| POLR3K | SNV | Missense_Mutation | rs144406744 | c.226C>T | p.Arg76Cys | p.R76C | Q9Y2Y1 | protein_coding | deleterious(0.03) | benign(0.111) | TCGA-BR-6852-01 | Stomach | stomach adenocarcinoma | Female | <65 | I/II | Unknown | Unknown | SD |
| Page: 1 |
Top |
Related drugs of malignant transformation related genes |
| Identification of chemicals and drugs interact with genes involved in malignant transfromation |
| (DGIdb 4.0) |
| Entrez ID | Symbol | Category | Interaction Types | Drug Claim Name | Drug Name | PMIDs |
| Page: 1 |

Copyright 2023-Present -The University of Texas Health Science Center at Houston |