
|
|||||
|
 | |
| |
| |
| |
| |
| |
|
Gene: POLR3GL |
Gene summary for POLR3GL |
| Gene information | Species | Human | Gene symbol | POLR3GL | Gene ID | 84265 |
| Gene name | RNA polymerase III subunit GL | |
| Gene Alias | RPC32HOM | |
| Cytomap | 1q21.1 | |
| Gene Type | protein-coding | GO ID | GO:0006139 | UniProtAcc | A6NGX6 |
Top |
Malignant transformation analysis |
| Identification of the aberrant gene expression in precancerous and cancerous lesions by comparing the gene expression of stem-like cells in diseased tissues with normal stem cells |
| Entrez ID | Symbol | Replicates | Species | Organ | Tissue | Adj P-value | Log2FC | Malignancy |
| 84265 | POLR3GL | LZE2T | Human | Esophagus | ESCC | 3.23e-06 | 5.08e-01 | 0.082 |
| 84265 | POLR3GL | LZE4T | Human | Esophagus | ESCC | 5.05e-16 | 3.82e-01 | 0.0811 |
| 84265 | POLR3GL | LZE5T | Human | Esophagus | ESCC | 3.42e-04 | 2.08e-01 | 0.0514 |
| 84265 | POLR3GL | LZE7T | Human | Esophagus | ESCC | 2.29e-11 | 4.78e-01 | 0.0667 |
| 84265 | POLR3GL | LZE8T | Human | Esophagus | ESCC | 5.21e-10 | 1.86e-01 | 0.067 |
| 84265 | POLR3GL | LZE20T | Human | Esophagus | ESCC | 2.89e-06 | 2.12e-01 | 0.0662 |
| 84265 | POLR3GL | LZE22D1 | Human | Esophagus | HGIN | 1.92e-06 | 2.09e-01 | 0.0595 |
| 84265 | POLR3GL | LZE22T | Human | Esophagus | ESCC | 7.37e-04 | 5.08e-01 | 0.068 |
| 84265 | POLR3GL | LZE24T | Human | Esophagus | ESCC | 1.99e-30 | 8.06e-01 | 0.0596 |
| 84265 | POLR3GL | LZE6T | Human | Esophagus | ESCC | 3.83e-12 | 3.78e-01 | 0.0845 |
| 84265 | POLR3GL | P1T-E | Human | Esophagus | ESCC | 1.43e-10 | 5.42e-01 | 0.0875 |
| 84265 | POLR3GL | P2T-E | Human | Esophagus | ESCC | 2.50e-33 | 6.20e-01 | 0.1177 |
| 84265 | POLR3GL | P4T-E | Human | Esophagus | ESCC | 8.49e-30 | 6.42e-01 | 0.1323 |
| 84265 | POLR3GL | P5T-E | Human | Esophagus | ESCC | 2.80e-15 | 2.98e-01 | 0.1327 |
| 84265 | POLR3GL | P8T-E | Human | Esophagus | ESCC | 1.05e-28 | 4.42e-01 | 0.0889 |
| 84265 | POLR3GL | P9T-E | Human | Esophagus | ESCC | 5.18e-13 | 4.00e-01 | 0.1131 |
| 84265 | POLR3GL | P10T-E | Human | Esophagus | ESCC | 5.40e-28 | 4.97e-01 | 0.116 |
| 84265 | POLR3GL | P11T-E | Human | Esophagus | ESCC | 1.32e-14 | 5.19e-01 | 0.1426 |
| 84265 | POLR3GL | P12T-E | Human | Esophagus | ESCC | 2.02e-25 | 4.93e-01 | 0.1122 |
| 84265 | POLR3GL | P15T-E | Human | Esophagus | ESCC | 8.02e-20 | 5.21e-01 | 0.1149 |
| Page: 1 2 3 4 5 6 |
| Tissue | Expression Dynamics | Abbreviation |
| Esophagus | 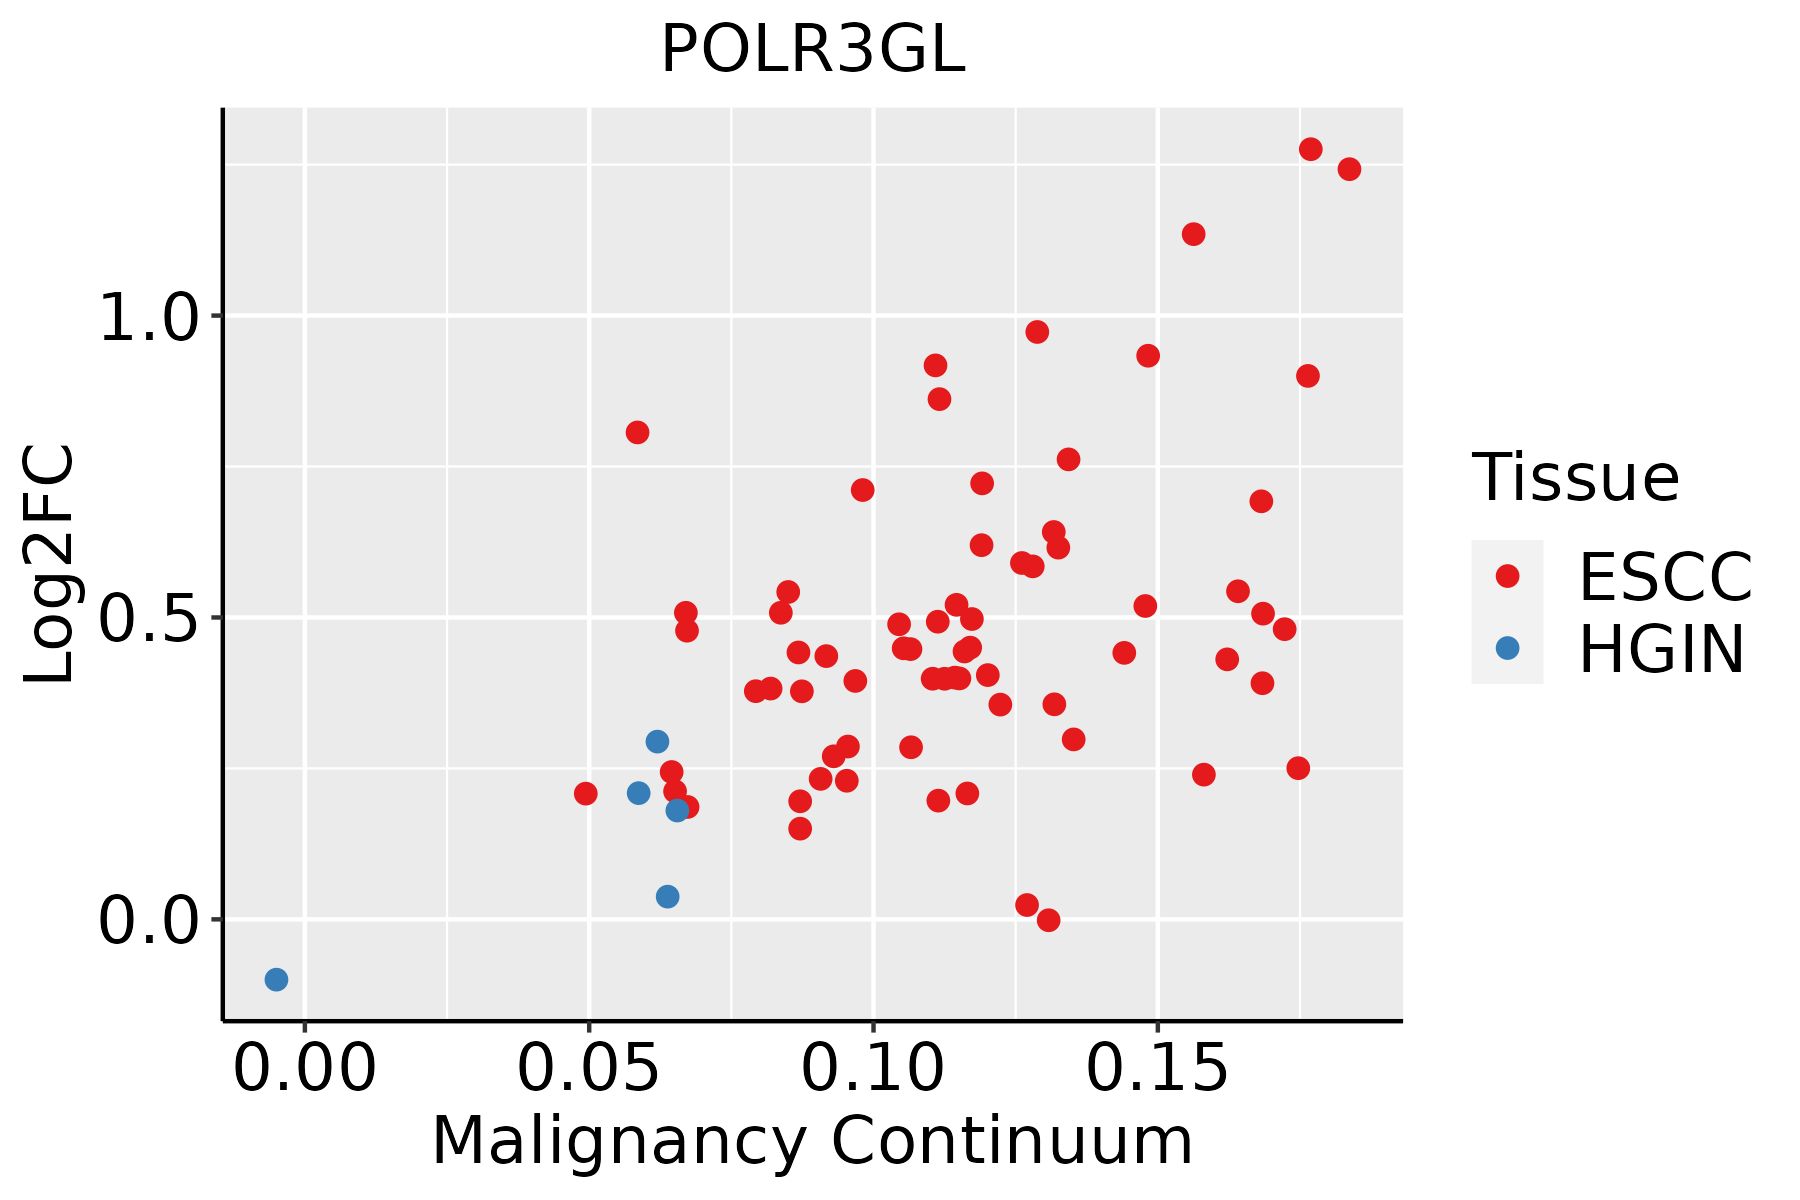 | ESCC: Esophageal squamous cell carcinoma |
| HGIN: High-grade intraepithelial neoplasias | ||
| LGIN: Low-grade intraepithelial neoplasias | ||
| Liver | 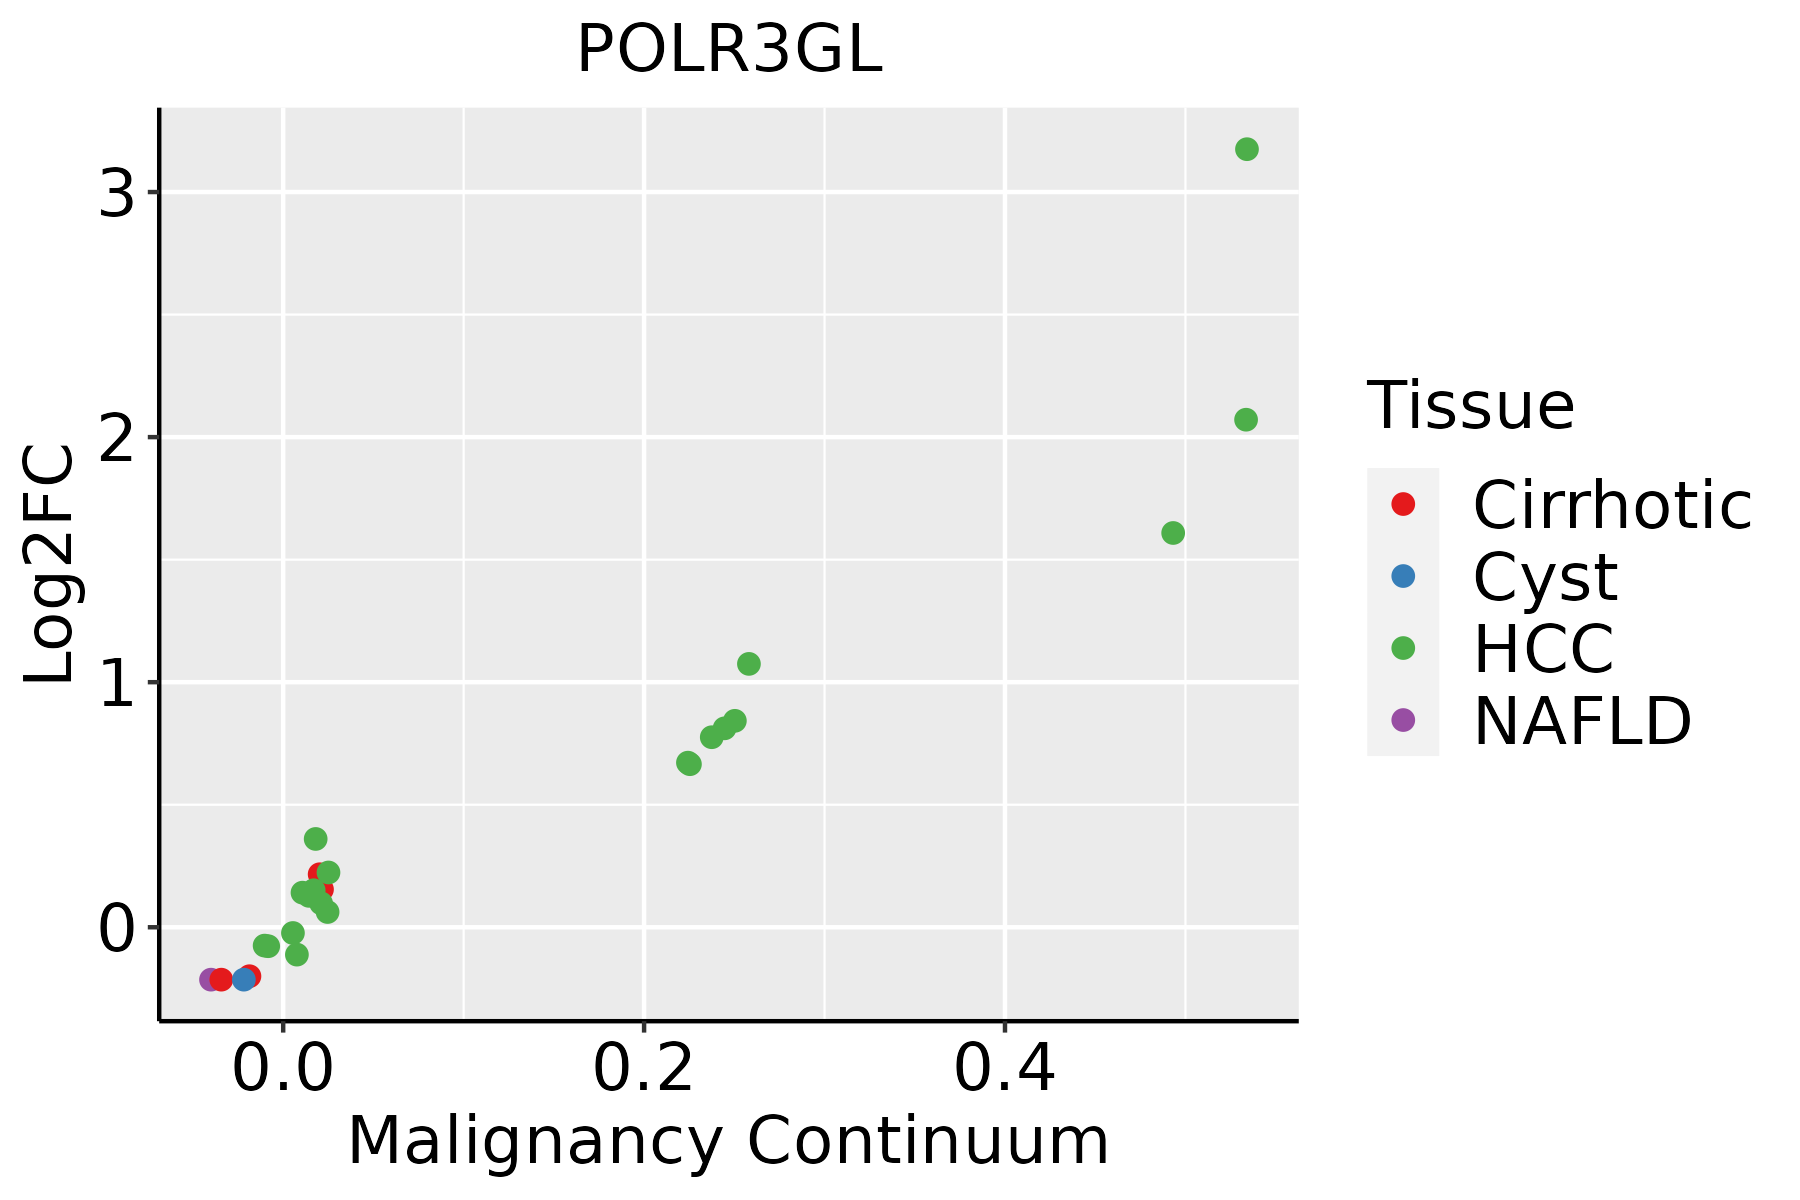 | HCC: Hepatocellular carcinoma |
| NAFLD: Non-alcoholic fatty liver disease | ||
| Oral Cavity |  | EOLP: Erosive Oral lichen planus |
| LP: leukoplakia | ||
| NEOLP: Non-erosive oral lichen planus | ||
| OSCC: Oral squamous cell carcinoma | ||
| Thyroid | 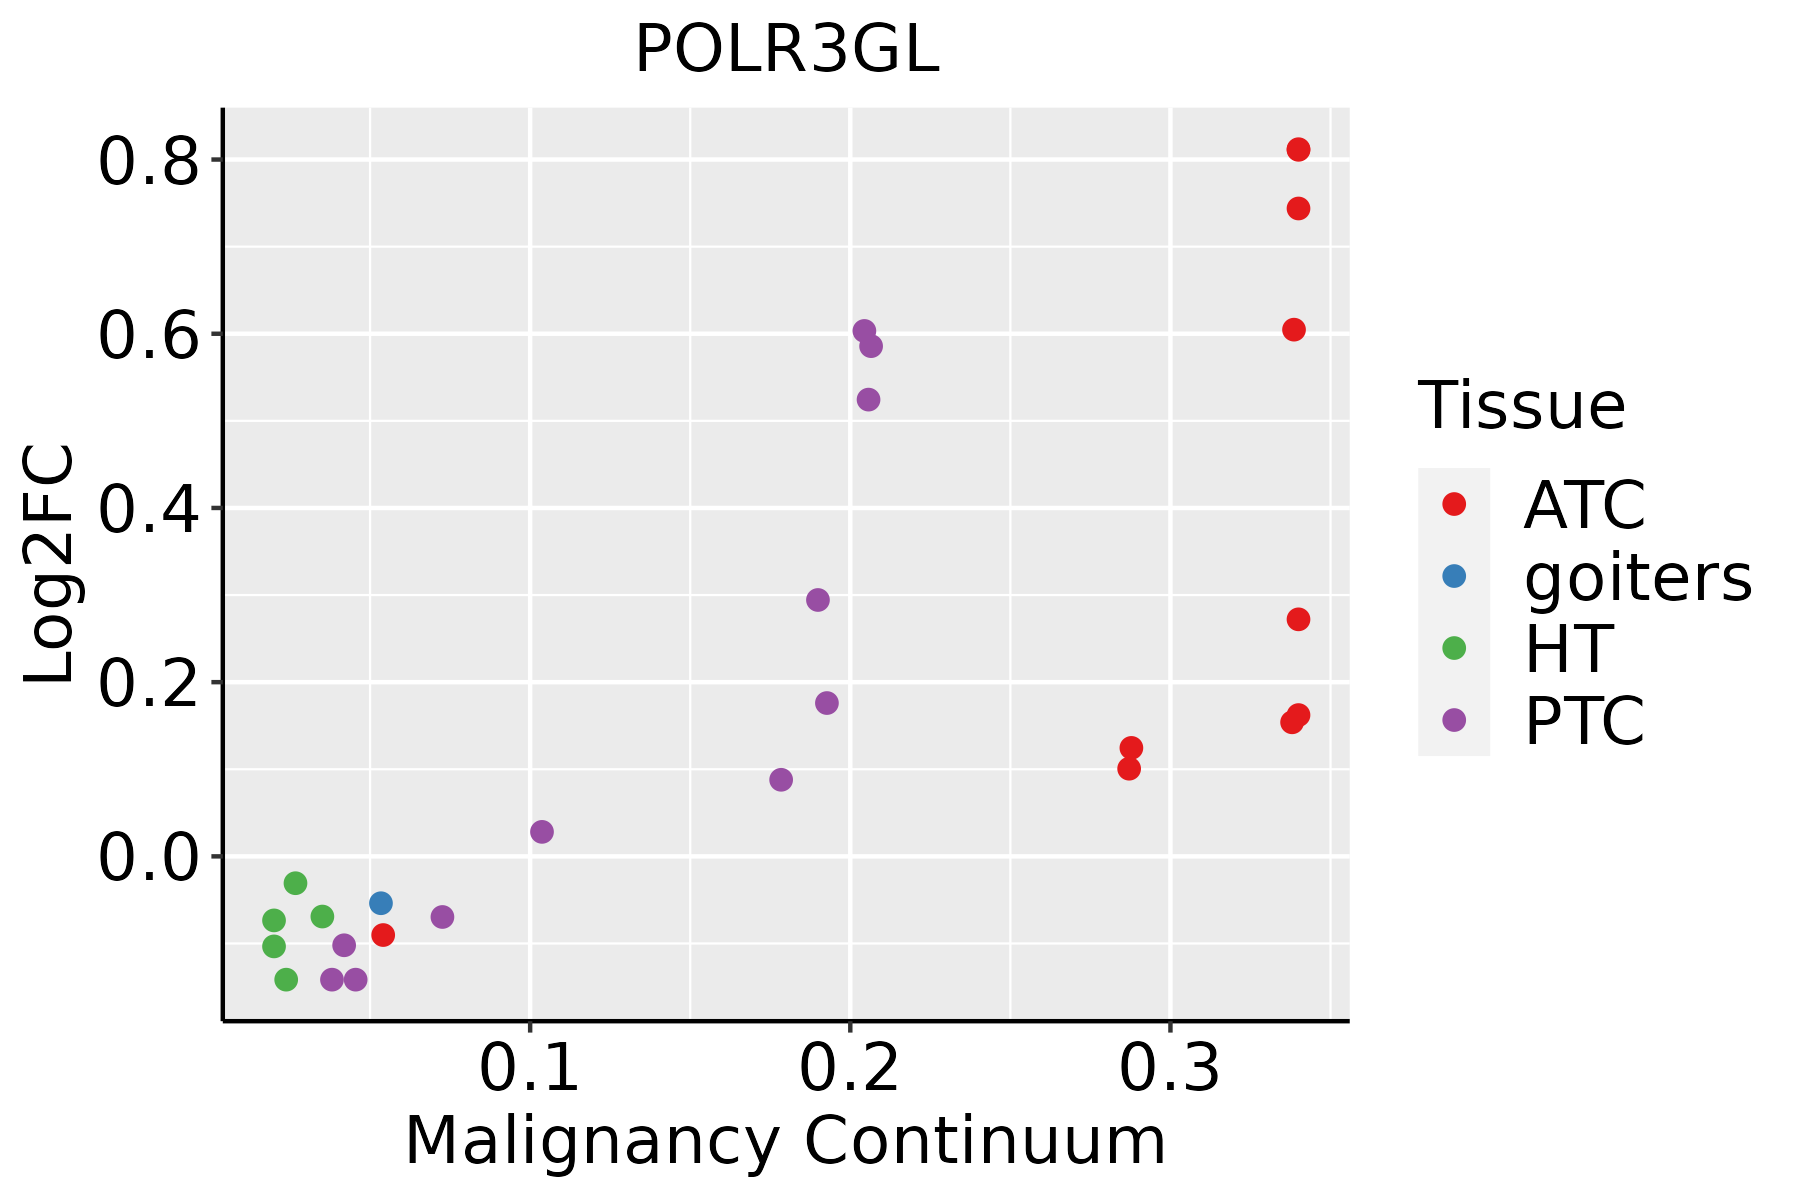 | ATC: Anaplastic thyroid cancer |
| HT: Hashimoto's thyroiditis | ||
| PTC: Papillary thyroid cancer |
| ∗log2FC in expression of this searched gene in stem-like cells from each diseased tissue sample relative to stem-like cells in normal samples in each tissue plotted against the malignancy continuum. Samples are colored based on if they are from different disease stage. |
Top |
Malignant transformation related pathway analysis |
| Find out the enriched GO biological processes and KEGG pathways involved in transition from healthy to precancer to cancer |
| Tissue | Disease Stage | Enriched GO biological Processes |
| Colorectum | AD |  |
| Colorectum | SER |  |
| Colorectum | MSS |  |
| Colorectum | MSI-H |  |
| Colorectum | FAP |  |
| ∗Top 15 enriched GO BP terms are showed in the bar plot of each disease state in each tissue. Each row represents a significant GO biological process which is colored according to the -log10(p.adjust). |
| Page: 1 2 3 4 5 6 7 8 9 |
| GO ID | Tissue | Disease Stage | Description | Gene Ratio | Bg Ratio | pvalue | p.adjust | Count |
| GO:00063833 | Esophagus | ESCC | transcription by RNA polymerase III | 41/8552 | 46/18723 | 7.69e-10 | 1.90e-08 | 41 |
| GO:0006383 | Liver | HCC | transcription by RNA polymerase III | 31/7958 | 46/18723 | 5.67e-04 | 3.61e-03 | 31 |
| GO:00063832 | Oral cavity | OSCC | transcription by RNA polymerase III | 34/7305 | 46/18723 | 1.61e-06 | 2.11e-05 | 34 |
| GO:00063831 | Oral cavity | LP | transcription by RNA polymerase III | 20/4623 | 46/18723 | 4.03e-03 | 2.61e-02 | 20 |
| GO:00063835 | Thyroid | PTC | transcription by RNA polymerase III | 23/5968 | 46/18723 | 7.89e-03 | 3.33e-02 | 23 |
| Page: 1 |
| Pathway ID | Tissue | Disease Stage | Description | Gene Ratio | Bg Ratio | pvalue | p.adjust | qvalue | Count |
| hsa030205 | Esophagus | HGIN | RNA polymerase | 12/1383 | 34/8465 | 5.62e-03 | 3.99e-02 | 3.17e-02 | 12 |
| hsa0302012 | Esophagus | HGIN | RNA polymerase | 12/1383 | 34/8465 | 5.62e-03 | 3.99e-02 | 3.17e-02 | 12 |
| hsa0302021 | Esophagus | ESCC | RNA polymerase | 28/4205 | 34/8465 | 8.19e-05 | 3.35e-04 | 1.71e-04 | 28 |
| hsa046234 | Esophagus | ESCC | Cytosolic DNA-sensing pathway | 49/4205 | 75/8465 | 4.35e-03 | 1.12e-02 | 5.74e-03 | 49 |
| hsa0302031 | Esophagus | ESCC | RNA polymerase | 28/4205 | 34/8465 | 8.19e-05 | 3.35e-04 | 1.71e-04 | 28 |
| hsa0462311 | Esophagus | ESCC | Cytosolic DNA-sensing pathway | 49/4205 | 75/8465 | 4.35e-03 | 1.12e-02 | 5.74e-03 | 49 |
| hsa03020 | Liver | HCC | RNA polymerase | 24/4020 | 34/8465 | 5.40e-03 | 1.57e-02 | 8.75e-03 | 24 |
| hsa030201 | Liver | HCC | RNA polymerase | 24/4020 | 34/8465 | 5.40e-03 | 1.57e-02 | 8.75e-03 | 24 |
| hsa030204 | Oral cavity | OSCC | RNA polymerase | 25/3704 | 34/8465 | 4.12e-04 | 1.27e-03 | 6.45e-04 | 25 |
| hsa04623 | Oral cavity | OSCC | Cytosolic DNA-sensing pathway | 44/3704 | 75/8465 | 6.44e-03 | 1.51e-02 | 7.68e-03 | 44 |
| hsa0302011 | Oral cavity | OSCC | RNA polymerase | 25/3704 | 34/8465 | 4.12e-04 | 1.27e-03 | 6.45e-04 | 25 |
| hsa046231 | Oral cavity | OSCC | Cytosolic DNA-sensing pathway | 44/3704 | 75/8465 | 6.44e-03 | 1.51e-02 | 7.68e-03 | 44 |
| hsa030202 | Oral cavity | LP | RNA polymerase | 18/2418 | 34/8465 | 2.35e-03 | 1.03e-02 | 6.63e-03 | 18 |
| hsa046232 | Oral cavity | LP | Cytosolic DNA-sensing pathway | 31/2418 | 75/8465 | 1.17e-02 | 3.91e-02 | 2.52e-02 | 31 |
| hsa030203 | Oral cavity | LP | RNA polymerase | 18/2418 | 34/8465 | 2.35e-03 | 1.03e-02 | 6.63e-03 | 18 |
| hsa046233 | Oral cavity | LP | Cytosolic DNA-sensing pathway | 31/2418 | 75/8465 | 1.17e-02 | 3.91e-02 | 2.52e-02 | 31 |
| Page: 1 |
Top |
Cell-cell communication analysis |
| Identification of potential cell-cell interactions between two cell types and their ligand-receptor pairs for different disease states |
| Ligand | Receptor | LRpair | Pathway | Tissue | Disease Stage |
| Page: 1 |
Top |
Single-cell gene regulatory network inference analysis |
| Find out the significant the regulons (TFs) and the target genes of each regulon across cell types for different disease states |
| TF | Cell Type | Tissue | Disease Stage | Target Gene | RSS | Regulon Activity |
| ∗The dot plots of a searched regulon are shown for all cell subpopulations in each disease state of each tissue based on the regulon specific score inferred using pySCENIC and by calculating the average expression. |
| Page: 1 |
Top |
Somatic mutation of malignant transformation related genes |
| Annotation of somatic variants for genes involved in malignant transformation |
| Hugo Symbol | Variant Class | Variant Classification | dbSNP RS | HGVSc | HGVSp | HGVSp Short | SWISSPROT | BIOTYPE | SIFT | PolyPhen | Tumor Sample Barcode | Tissue | Histology | Sex | Age | Stage | Therapy Types | Drugs | Outcome |
| POLR3GL | SNV | Missense_Mutation | c.325N>C | p.Asp109His | p.D109H | Q9BT43 | protein_coding | deleterious(0) | probably_damaging(0.999) | TCGA-A8-A07R-01 | Breast | breast invasive carcinoma | Female | >=65 | III/IV | Ancillary | zoledronic | SD | |
| POLR3GL | SNV | Missense_Mutation | c.266G>A | p.Arg89His | p.R89H | Q9BT43 | protein_coding | deleterious(0.02) | benign(0.083) | TCGA-AN-A0FN-01 | Breast | breast invasive carcinoma | Female | <65 | I/II | Unknown | Unknown | SD | |
| POLR3GL | SNV | Missense_Mutation | c.645N>T | p.Glu215Asp | p.E215D | Q9BT43 | protein_coding | deleterious(0) | probably_damaging(0.983) | TCGA-AR-A24R-01 | Breast | breast invasive carcinoma | Female | <65 | III/IV | Chemotherapy | cytoxan | SD | |
| POLR3GL | SNV | Missense_Mutation | c.348N>T | p.Glu116Asp | p.E116D | Q9BT43 | protein_coding | deleterious(0.02) | probably_damaging(0.995) | TCGA-E9-A1RF-01 | Breast | breast invasive carcinoma | Female | >=65 | III/IV | Hormone Therapy | tamoxiphen | SD | |
| POLR3GL | SNV | Missense_Mutation | novel | c.335N>A | p.Arg112His | p.R112H | Q9BT43 | protein_coding | deleterious(0.02) | possibly_damaging(0.871) | TCGA-EA-A410-01 | Cervix | cervical & endocervical cancer | Female | <65 | I/II | Unknown | Unknown | SD |
| POLR3GL | SNV | Missense_Mutation | c.256N>A | p.Asp86Asn | p.D86N | Q9BT43 | protein_coding | deleterious(0) | probably_damaging(0.998) | TCGA-G4-6310-01 | Colorectum | colon adenocarcinoma | Male | >=65 | III/IV | Chemotherapy | 5-fu | SD | |
| POLR3GL | SNV | Missense_Mutation | novel | c.28N>T | p.Arg10Cys | p.R10C | Q9BT43 | protein_coding | deleterious(0) | possibly_damaging(0.589) | TCGA-AJ-A3OJ-01 | Endometrium | uterine corpus endometrioid carcinoma | Female | <65 | I/II | Chemotherapy | carboplatin | CR |
| POLR3GL | SNV | Missense_Mutation | c.313N>A | p.Asp105Asn | p.D105N | Q9BT43 | protein_coding | deleterious(0.01) | benign(0.257) | TCGA-AP-A0LM-01 | Endometrium | uterine corpus endometrioid carcinoma | Female | <65 | III/IV | Chemotherapy | cisplatin | SD | |
| POLR3GL | SNV | Missense_Mutation | c.546N>T | p.Glu182Asp | p.E182D | Q9BT43 | protein_coding | tolerated(0.28) | benign(0.001) | TCGA-AX-A0J1-01 | Endometrium | uterine corpus endometrioid carcinoma | Female | >=65 | I/II | Unknown | Unknown | SD | |
| POLR3GL | SNV | Missense_Mutation | c.323C>T | p.Pro108Leu | p.P108L | Q9BT43 | protein_coding | deleterious(0.03) | probably_damaging(0.985) | TCGA-AX-A2HD-01 | Endometrium | uterine corpus endometrioid carcinoma | Female | >=65 | III/IV | Unknown | Unknown | SD |
| Page: 1 2 |
Top |
Related drugs of malignant transformation related genes |
| Identification of chemicals and drugs interact with genes involved in malignant transfromation |
| (DGIdb 4.0) |
| Entrez ID | Symbol | Category | Interaction Types | Drug Claim Name | Drug Name | PMIDs |
| Page: 1 |

Copyright 2023-Present -The University of Texas Health Science Center at Houston |