
|
|||||
|
 | |
| |
| |
| |
| |
| |
|
Gene: POLR3G |
Gene summary for POLR3G |
| Gene information | Species | Human | Gene symbol | POLR3G | Gene ID | 10622 |
| Gene name | RNA polymerase III subunit G | |
| Gene Alias | C31 | |
| Cytomap | 5q14.3 | |
| Gene Type | protein-coding | GO ID | GO:0001816 | UniProtAcc | A0A024RAM1 |
Top |
Malignant transformation analysis |
| Identification of the aberrant gene expression in precancerous and cancerous lesions by comparing the gene expression of stem-like cells in diseased tissues with normal stem cells |
| Entrez ID | Symbol | Replicates | Species | Organ | Tissue | Adj P-value | Log2FC | Malignancy |
| 10622 | POLR3G | LZE7T | Human | Esophagus | ESCC | 1.62e-02 | 2.40e-01 | 0.0667 |
| 10622 | POLR3G | P2T-E | Human | Esophagus | ESCC | 2.47e-02 | 1.06e-01 | 0.1177 |
| 10622 | POLR3G | P4T-E | Human | Esophagus | ESCC | 6.46e-13 | 2.39e-01 | 0.1323 |
| 10622 | POLR3G | P5T-E | Human | Esophagus | ESCC | 3.17e-07 | 2.25e-01 | 0.1327 |
| 10622 | POLR3G | P9T-E | Human | Esophagus | ESCC | 1.28e-10 | 1.73e-01 | 0.1131 |
| 10622 | POLR3G | P19T-E | Human | Esophagus | ESCC | 1.34e-04 | 7.59e-01 | 0.1662 |
| 10622 | POLR3G | P20T-E | Human | Esophagus | ESCC | 2.13e-04 | 1.93e-01 | 0.1124 |
| 10622 | POLR3G | P21T-E | Human | Esophagus | ESCC | 3.31e-17 | 4.22e-01 | 0.1617 |
| 10622 | POLR3G | P23T-E | Human | Esophagus | ESCC | 3.01e-05 | 1.76e-01 | 0.108 |
| 10622 | POLR3G | P24T-E | Human | Esophagus | ESCC | 9.27e-09 | 1.73e-01 | 0.1287 |
| 10622 | POLR3G | P26T-E | Human | Esophagus | ESCC | 5.67e-07 | 1.90e-01 | 0.1276 |
| 10622 | POLR3G | P28T-E | Human | Esophagus | ESCC | 5.87e-07 | 1.62e-01 | 0.1149 |
| 10622 | POLR3G | P31T-E | Human | Esophagus | ESCC | 2.74e-04 | 1.23e-01 | 0.1251 |
| 10622 | POLR3G | P32T-E | Human | Esophagus | ESCC | 1.38e-15 | 3.33e-01 | 0.1666 |
| 10622 | POLR3G | P37T-E | Human | Esophagus | ESCC | 5.55e-09 | 3.65e-01 | 0.1371 |
| 10622 | POLR3G | P38T-E | Human | Esophagus | ESCC | 1.39e-03 | 2.82e-01 | 0.127 |
| 10622 | POLR3G | P39T-E | Human | Esophagus | ESCC | 2.94e-02 | 4.64e-02 | 0.0894 |
| 10622 | POLR3G | P52T-E | Human | Esophagus | ESCC | 6.35e-09 | 2.88e-01 | 0.1555 |
| 10622 | POLR3G | P62T-E | Human | Esophagus | ESCC | 4.72e-03 | 9.65e-02 | 0.1302 |
| 10622 | POLR3G | P74T-E | Human | Esophagus | ESCC | 1.92e-03 | 2.67e-01 | 0.1479 |
| Page: 1 2 |
| Tissue | Expression Dynamics | Abbreviation |
| Esophagus |  | ESCC: Esophageal squamous cell carcinoma |
| HGIN: High-grade intraepithelial neoplasias | ||
| LGIN: Low-grade intraepithelial neoplasias | ||
| Skin | 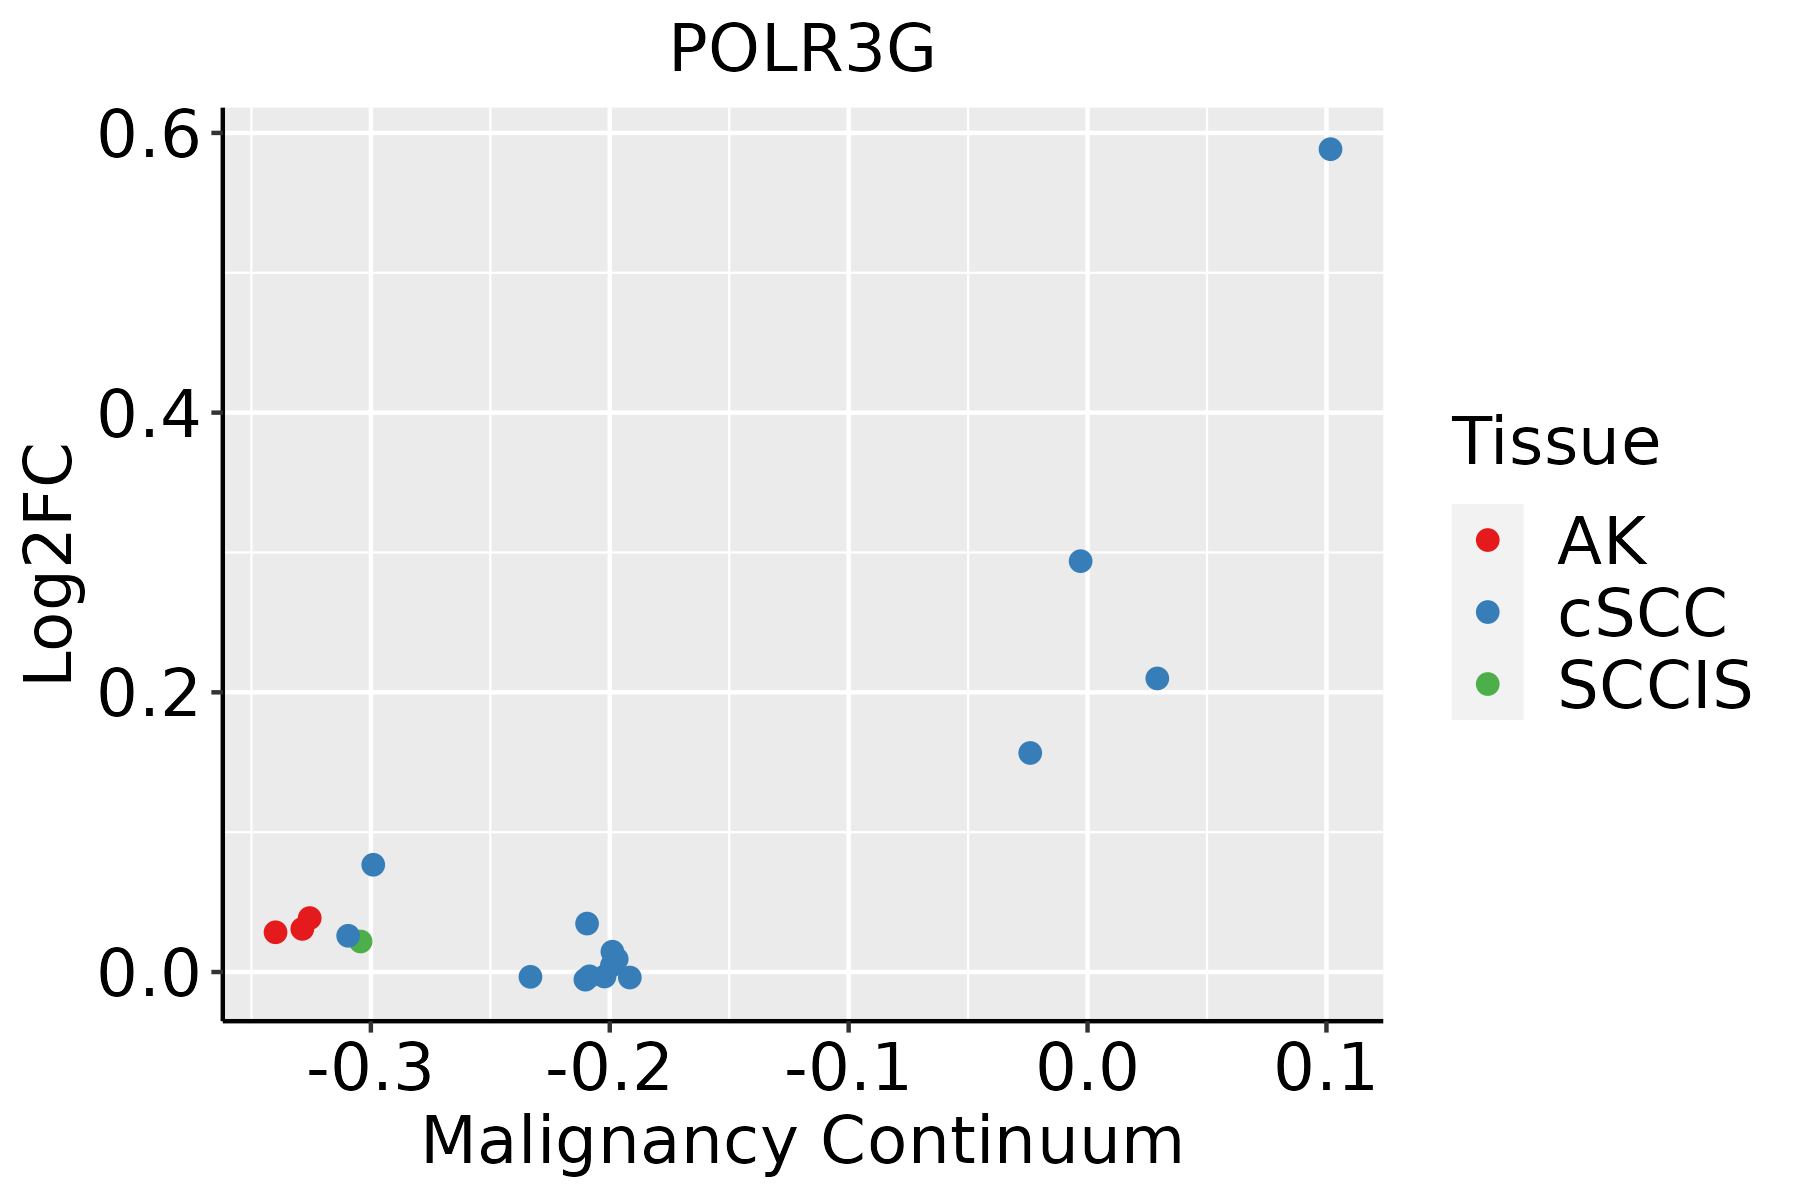 | AK: Actinic keratosis |
| cSCC: Cutaneous squamous cell carcinoma | ||
| SCCIS:squamous cell carcinoma in situ |
| ∗log2FC in expression of this searched gene in stem-like cells from each diseased tissue sample relative to stem-like cells in normal samples in each tissue plotted against the malignancy continuum. Samples are colored based on if they are from different disease stage. |
Top |
Malignant transformation related pathway analysis |
| Find out the enriched GO biological processes and KEGG pathways involved in transition from healthy to precancer to cancer |
| Tissue | Disease Stage | Enriched GO biological Processes |
| Colorectum | AD |  |
| Colorectum | SER |  |
| Colorectum | MSS |  |
| Colorectum | MSI-H |  |
| Colorectum | FAP |  |
| ∗Top 15 enriched GO BP terms are showed in the bar plot of each disease state in each tissue. Each row represents a significant GO biological process which is colored according to the -log10(p.adjust). |
| Page: 1 2 3 4 5 6 7 8 9 |
| GO ID | Tissue | Disease Stage | Description | Gene Ratio | Bg Ratio | pvalue | p.adjust | Count |
| GO:000961518 | Esophagus | ESCC | response to virus | 238/8552 | 367/18723 | 6.65e-14 | 3.32e-12 | 238 |
| GO:00516075 | Esophagus | ESCC | defense response to virus | 171/8552 | 265/18723 | 3.91e-10 | 1.05e-08 | 171 |
| GO:01405465 | Esophagus | ESCC | defense response to symbiont | 171/8552 | 265/18723 | 3.91e-10 | 1.05e-08 | 171 |
| GO:00063833 | Esophagus | ESCC | transcription by RNA polymerase III | 41/8552 | 46/18723 | 7.69e-10 | 1.90e-08 | 41 |
| GO:00028318 | Esophagus | ESCC | regulation of response to biotic stimulus | 191/8552 | 327/18723 | 2.12e-06 | 2.45e-05 | 191 |
| GO:003248112 | Esophagus | ESCC | positive regulation of type I interferon production | 42/8552 | 58/18723 | 3.27e-05 | 2.70e-04 | 42 |
| GO:00326084 | Esophagus | ESCC | interferon-beta production | 40/8552 | 56/18723 | 8.36e-05 | 6.08e-04 | 40 |
| GO:00326484 | Esophagus | ESCC | regulation of interferon-beta production | 40/8552 | 56/18723 | 8.36e-05 | 6.08e-04 | 40 |
| GO:0006359 | Esophagus | ESCC | regulation of transcription by RNA polymerase III | 19/8552 | 22/18723 | 9.52e-05 | 6.78e-04 | 19 |
| GO:003247912 | Esophagus | ESCC | regulation of type I interferon production | 61/8552 | 95/18723 | 2.05e-04 | 1.29e-03 | 61 |
| GO:003260612 | Esophagus | ESCC | type I interferon production | 61/8552 | 95/18723 | 2.05e-04 | 1.29e-03 | 61 |
| GO:00327284 | Esophagus | ESCC | positive regulation of interferon-beta production | 29/8552 | 39/18723 | 2.59e-04 | 1.58e-03 | 29 |
| GO:00450885 | Esophagus | ESCC | regulation of innate immune response | 125/8552 | 218/18723 | 3.34e-04 | 1.96e-03 | 125 |
| GO:000181916 | Esophagus | ESCC | positive regulation of cytokine production | 244/8552 | 467/18723 | 2.29e-03 | 1.01e-02 | 244 |
| GO:0006383 | Liver | HCC | transcription by RNA polymerase III | 31/7958 | 46/18723 | 5.67e-04 | 3.61e-03 | 31 |
| GO:00063832 | Oral cavity | OSCC | transcription by RNA polymerase III | 34/7305 | 46/18723 | 1.61e-06 | 2.11e-05 | 34 |
| GO:00063831 | Oral cavity | LP | transcription by RNA polymerase III | 20/4623 | 46/18723 | 4.03e-03 | 2.61e-02 | 20 |
| GO:000961522 | Skin | cSCC | response to virus | 152/4864 | 367/18723 | 5.88e-11 | 2.75e-09 | 152 |
| GO:00516076 | Skin | cSCC | defense response to virus | 107/4864 | 265/18723 | 1.84e-07 | 4.02e-06 | 107 |
| GO:01405466 | Skin | cSCC | defense response to symbiont | 107/4864 | 265/18723 | 1.84e-07 | 4.02e-06 | 107 |
| Page: 1 2 |
| Pathway ID | Tissue | Disease Stage | Description | Gene Ratio | Bg Ratio | pvalue | p.adjust | qvalue | Count |
| hsa046234 | Esophagus | ESCC | Cytosolic DNA-sensing pathway | 49/4205 | 75/8465 | 4.35e-03 | 1.12e-02 | 5.74e-03 | 49 |
| hsa0462311 | Esophagus | ESCC | Cytosolic DNA-sensing pathway | 49/4205 | 75/8465 | 4.35e-03 | 1.12e-02 | 5.74e-03 | 49 |
| Page: 1 |
Top |
Cell-cell communication analysis |
| Identification of potential cell-cell interactions between two cell types and their ligand-receptor pairs for different disease states |
| Ligand | Receptor | LRpair | Pathway | Tissue | Disease Stage |
| Page: 1 |
Top |
Single-cell gene regulatory network inference analysis |
| Find out the significant the regulons (TFs) and the target genes of each regulon across cell types for different disease states |
| TF | Cell Type | Tissue | Disease Stage | Target Gene | RSS | Regulon Activity |
| POLR3G | CT | Colorectum | AD | GAL,RP11-1020A11.2,STEAP1, etc. | 1.43e-02 |  |
| POLR3G | STM | Colorectum | MSI-H | GAL,RP11-1020A11.2,STEAP1, etc. | 1.80e-02 |  |
| POLR3G | CT | Colorectum | SER | GAL,RP11-1020A11.2,STEAP1, etc. | 2.74e-02 |  |
| POLR3G | SSC | Colorectum | SER | GAL,RP11-1020A11.2,STEAP1, etc. | 2.57e-03 | |
| POLR3G | KER | Esophagus | ESCC | ERVMER34-1,SMOC1,EIF5A, etc. | 3.64e-01 |  |
| POLR3G | SPI | Oral cavity | LP | F12,S100A2,NDUFAF2, etc. | 3.40e-01 |  |
| POLR3G | SPI | Oral cavity | OSCC | F12,S100A2,NDUFAF2, etc. | 4.43e-01 |  |
| POLR3G | PVA | Pancreas | Healthy | AMY2B,CELA2A,AMY2A, etc. | 5.71e-02 |  |
| ∗The dot plots of a searched regulon are shown for all cell subpopulations in each disease state of each tissue based on the regulon specific score inferred using pySCENIC and by calculating the average expression. |
| Page: 1 |
Top |
Somatic mutation of malignant transformation related genes |
| Annotation of somatic variants for genes involved in malignant transformation |
| Hugo Symbol | Variant Class | Variant Classification | dbSNP RS | HGVSc | HGVSp | HGVSp Short | SWISSPROT | BIOTYPE | SIFT | PolyPhen | Tumor Sample Barcode | Tissue | Histology | Sex | Age | Stage | Therapy Types | Drugs | Outcome |
| POLR3G | SNV | Missense_Mutation | rs375576885 | c.547N>A | p.Ala183Thr | p.A183T | O15318 | protein_coding | tolerated(0.65) | possibly_damaging(0.649) | TCGA-AN-A046-01 | Breast | breast invasive carcinoma | Female | >=65 | I/II | Unknown | Unknown | SD |
| POLR3G | SNV | Missense_Mutation | c.49N>C | p.Glu17Gln | p.E17Q | O15318 | protein_coding | tolerated(0.05) | possibly_damaging(0.752) | TCGA-EA-A43B-01 | Cervix | cervical & endocervical cancer | Female | <65 | I/II | Chemotherapy | cisplatin | CR | |
| POLR3G | SNV | Missense_Mutation | c.472G>A | p.Asp158Asn | p.D158N | O15318 | protein_coding | tolerated(0.08) | possibly_damaging(0.62) | TCGA-FU-A23K-01 | Cervix | cervical & endocervical cancer | Female | <65 | III/IV | Unknown | Unknown | SD | |
| POLR3G | SNV | Missense_Mutation | novel | c.52N>A | p.Ala18Thr | p.A18T | O15318 | protein_coding | deleterious(0.03) | probably_damaging(0.985) | TCGA-AZ-4315-01 | Colorectum | colon adenocarcinoma | Male | <65 | I/II | Unknown | Unknown | SD |
| POLR3G | SNV | Missense_Mutation | c.635C>T | p.Ala212Val | p.A212V | O15318 | protein_coding | tolerated(0.09) | benign(0.006) | TCGA-G4-6628-01 | Colorectum | colon adenocarcinoma | Male | >=65 | I/II | Unknown | Unknown | SD | |
| POLR3G | SNV | Missense_Mutation | rs373941949 | c.25C>T | p.Arg9Cys | p.R9C | O15318 | protein_coding | tolerated(0.1) | benign(0.391) | TCGA-AP-A0LM-01 | Endometrium | uterine corpus endometrioid carcinoma | Female | <65 | III/IV | Chemotherapy | cisplatin | SD |
| POLR3G | SNV | Missense_Mutation | c.650N>C | p.Asn217Thr | p.N217T | O15318 | protein_coding | deleterious(0) | probably_damaging(0.992) | TCGA-AX-A05Z-01 | Endometrium | uterine corpus endometrioid carcinoma | Female | <65 | III/IV | Chemotherapy | adriamycin | SD | |
| POLR3G | SNV | Missense_Mutation | novel | c.407C>T | p.Thr136Ile | p.T136I | O15318 | protein_coding | tolerated(0.34) | benign(0.006) | TCGA-AX-A2HC-01 | Endometrium | uterine corpus endometrioid carcinoma | Female | <65 | III/IV | Chemotherapy | paclitaxel | PD |
| POLR3G | SNV | Missense_Mutation | c.269N>T | p.Arg90Ile | p.R90I | O15318 | protein_coding | deleterious(0) | possibly_damaging(0.469) | TCGA-B5-A0JY-01 | Endometrium | uterine corpus endometrioid carcinoma | Female | <65 | III/IV | Chemotherapy | doxorubicin | SD | |
| POLR3G | SNV | Missense_Mutation | rs140910392 | c.538N>A | p.Asp180Asn | p.D180N | O15318 | protein_coding | tolerated(0.24) | benign(0.175) | TCGA-BG-A187-01 | Endometrium | uterine corpus endometrioid carcinoma | Female | >=65 | I/II | Unknown | Unknown | SD |
| Page: 1 2 3 |
Top |
Related drugs of malignant transformation related genes |
| Identification of chemicals and drugs interact with genes involved in malignant transfromation |
| (DGIdb 4.0) |
| Entrez ID | Symbol | Category | Interaction Types | Drug Claim Name | Drug Name | PMIDs |
| 10622 | POLR3G | NA | nevirapine | NEVIRAPINE | 21810746 |
| Page: 1 |

Copyright 2023-Present -The University of Texas Health Science Center at Houston |