
|
|||||
|
 | |
| |
| |
| |
| |
| |
|
Gene: POLR3D |
Gene summary for POLR3D |
| Gene information | Species | Human | Gene symbol | POLR3D | Gene ID | 661 |
| Gene name | RNA polymerase III subunit D | |
| Gene Alias | BN51T | |
| Cytomap | 8p21.3 | |
| Gene Type | protein-coding | GO ID | GO:0001816 | UniProtAcc | P05423 |
Top |
Malignant transformation analysis |
| Identification of the aberrant gene expression in precancerous and cancerous lesions by comparing the gene expression of stem-like cells in diseased tissues with normal stem cells |
| Entrez ID | Symbol | Replicates | Species | Organ | Tissue | Adj P-value | Log2FC | Malignancy |
| 661 | POLR3D | LZE4T | Human | Esophagus | ESCC | 8.47e-04 | 8.60e-02 | 0.0811 |
| 661 | POLR3D | LZE8T | Human | Esophagus | ESCC | 5.21e-03 | 1.66e-01 | 0.067 |
| 661 | POLR3D | LZE20T | Human | Esophagus | ESCC | 3.03e-06 | 1.30e-01 | 0.0662 |
| 661 | POLR3D | LZE22T | Human | Esophagus | ESCC | 1.52e-03 | 2.06e-01 | 0.068 |
| 661 | POLR3D | LZE24T | Human | Esophagus | ESCC | 1.63e-11 | 3.64e-01 | 0.0596 |
| 661 | POLR3D | LZE21T | Human | Esophagus | ESCC | 4.73e-03 | 2.08e-01 | 0.0655 |
| 661 | POLR3D | P1T-E | Human | Esophagus | ESCC | 4.35e-07 | 2.50e-01 | 0.0875 |
| 661 | POLR3D | P2T-E | Human | Esophagus | ESCC | 8.93e-25 | 4.24e-01 | 0.1177 |
| 661 | POLR3D | P4T-E | Human | Esophagus | ESCC | 2.52e-19 | 4.41e-01 | 0.1323 |
| 661 | POLR3D | P5T-E | Human | Esophagus | ESCC | 6.25e-08 | 1.64e-01 | 0.1327 |
| 661 | POLR3D | P8T-E | Human | Esophagus | ESCC | 1.05e-10 | 1.91e-01 | 0.0889 |
| 661 | POLR3D | P9T-E | Human | Esophagus | ESCC | 7.62e-10 | 2.39e-01 | 0.1131 |
| 661 | POLR3D | P10T-E | Human | Esophagus | ESCC | 1.10e-22 | 4.39e-01 | 0.116 |
| 661 | POLR3D | P11T-E | Human | Esophagus | ESCC | 8.20e-07 | 3.44e-01 | 0.1426 |
| 661 | POLR3D | P12T-E | Human | Esophagus | ESCC | 6.20e-15 | 2.59e-01 | 0.1122 |
| 661 | POLR3D | P15T-E | Human | Esophagus | ESCC | 1.62e-04 | 1.35e-01 | 0.1149 |
| 661 | POLR3D | P16T-E | Human | Esophagus | ESCC | 1.87e-12 | 3.51e-01 | 0.1153 |
| 661 | POLR3D | P17T-E | Human | Esophagus | ESCC | 6.75e-09 | 4.11e-01 | 0.1278 |
| 661 | POLR3D | P19T-E | Human | Esophagus | ESCC | 1.61e-06 | 5.27e-01 | 0.1662 |
| 661 | POLR3D | P20T-E | Human | Esophagus | ESCC | 6.49e-18 | 3.66e-01 | 0.1124 |
| Page: 1 2 3 4 5 |
| Tissue | Expression Dynamics | Abbreviation |
| Esophagus |  | ESCC: Esophageal squamous cell carcinoma |
| HGIN: High-grade intraepithelial neoplasias | ||
| LGIN: Low-grade intraepithelial neoplasias | ||
| Oral Cavity | 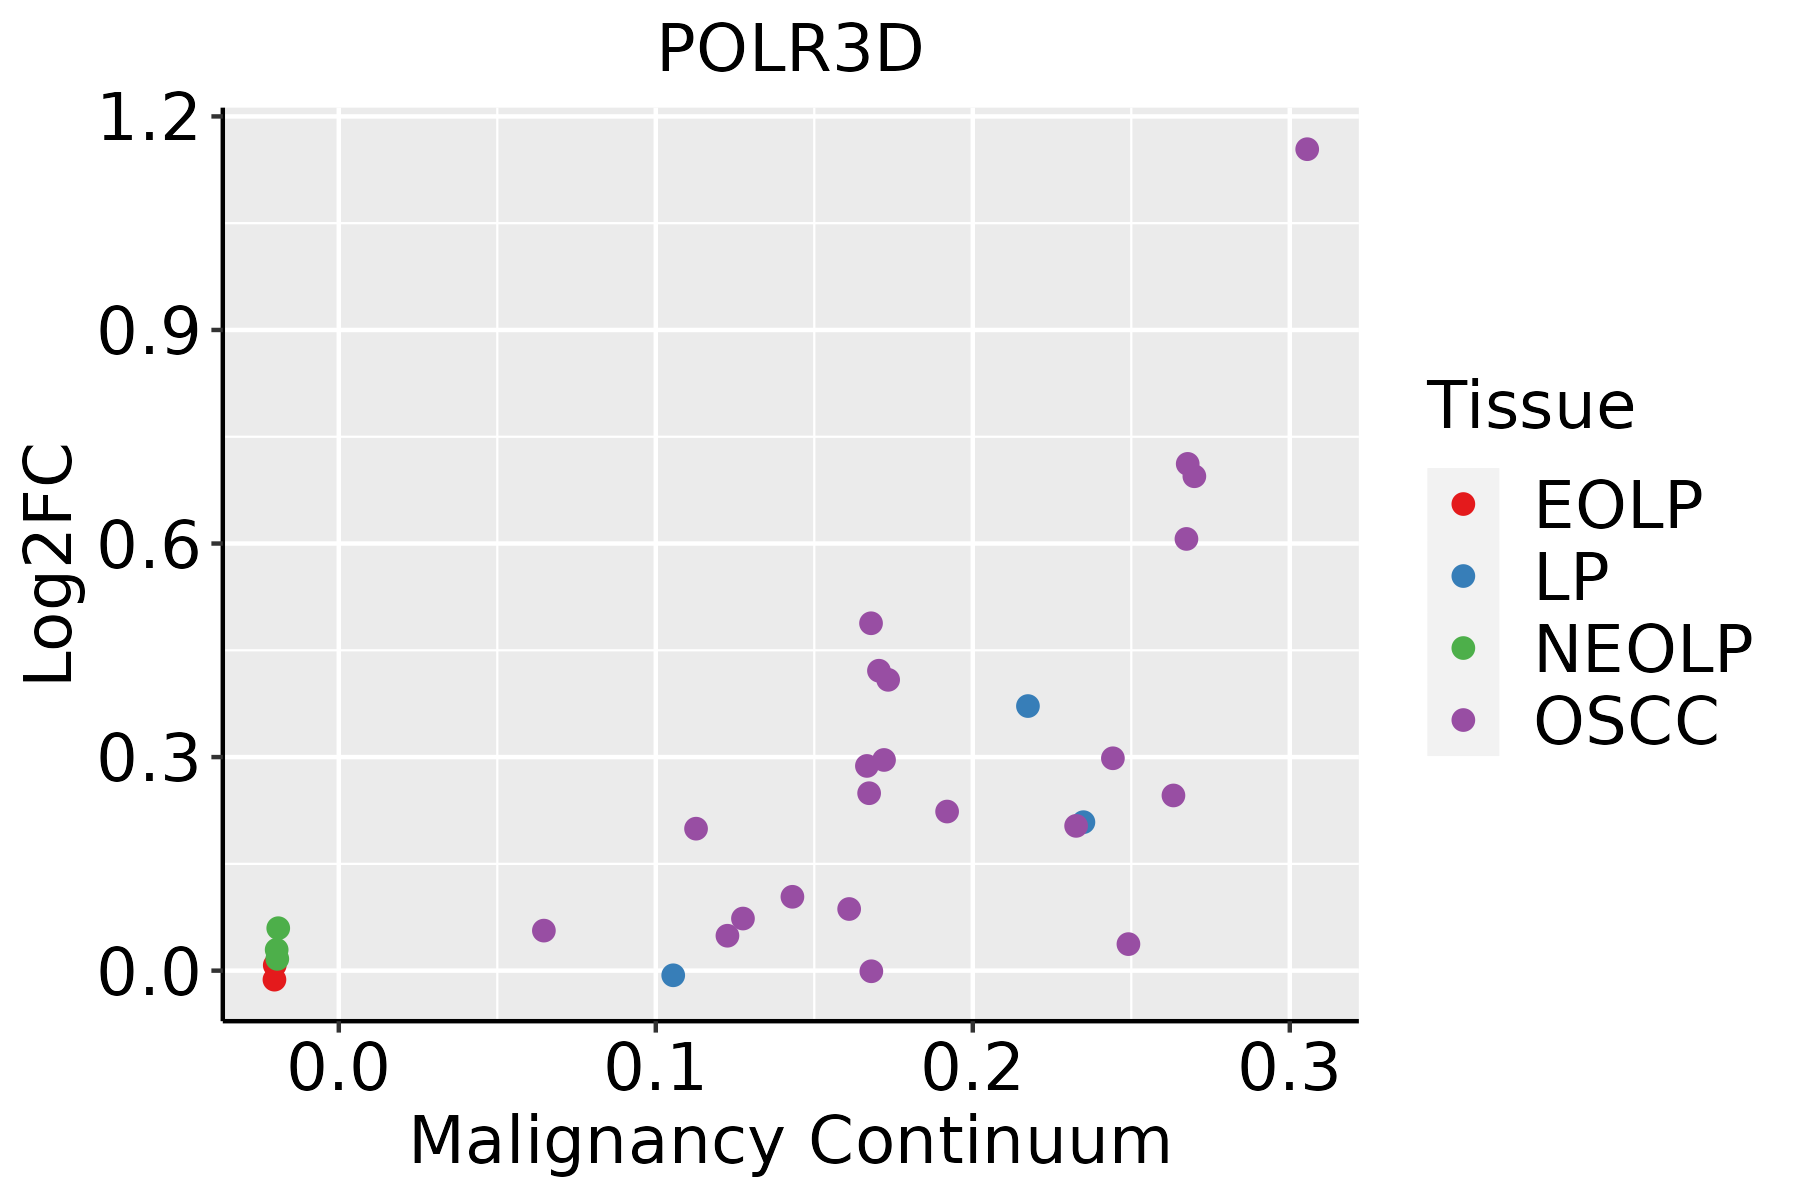 | EOLP: Erosive Oral lichen planus |
| LP: leukoplakia | ||
| NEOLP: Non-erosive oral lichen planus | ||
| OSCC: Oral squamous cell carcinoma | ||
| Thyroid |  | ATC: Anaplastic thyroid cancer |
| HT: Hashimoto's thyroiditis | ||
| PTC: Papillary thyroid cancer |
| ∗log2FC in expression of this searched gene in stem-like cells from each diseased tissue sample relative to stem-like cells in normal samples in each tissue plotted against the malignancy continuum. Samples are colored based on if they are from different disease stage. |
Top |
Malignant transformation related pathway analysis |
| Find out the enriched GO biological processes and KEGG pathways involved in transition from healthy to precancer to cancer |
| Tissue | Disease Stage | Enriched GO biological Processes |
| Colorectum | AD |  |
| Colorectum | SER |  |
| Colorectum | MSS |  |
| Colorectum | MSI-H |  |
| Colorectum | FAP |  |
| ∗Top 15 enriched GO BP terms are showed in the bar plot of each disease state in each tissue. Each row represents a significant GO biological process which is colored according to the -log10(p.adjust). |
| Page: 1 2 3 4 5 6 7 8 9 |
| GO ID | Tissue | Disease Stage | Description | Gene Ratio | Bg Ratio | pvalue | p.adjust | Count |
| GO:000961518 | Esophagus | ESCC | response to virus | 238/8552 | 367/18723 | 6.65e-14 | 3.32e-12 | 238 |
| GO:00516075 | Esophagus | ESCC | defense response to virus | 171/8552 | 265/18723 | 3.91e-10 | 1.05e-08 | 171 |
| GO:01405465 | Esophagus | ESCC | defense response to symbiont | 171/8552 | 265/18723 | 3.91e-10 | 1.05e-08 | 171 |
| GO:00063833 | Esophagus | ESCC | transcription by RNA polymerase III | 41/8552 | 46/18723 | 7.69e-10 | 1.90e-08 | 41 |
| GO:00028318 | Esophagus | ESCC | regulation of response to biotic stimulus | 191/8552 | 327/18723 | 2.12e-06 | 2.45e-05 | 191 |
| GO:003248112 | Esophagus | ESCC | positive regulation of type I interferon production | 42/8552 | 58/18723 | 3.27e-05 | 2.70e-04 | 42 |
| GO:00326084 | Esophagus | ESCC | interferon-beta production | 40/8552 | 56/18723 | 8.36e-05 | 6.08e-04 | 40 |
| GO:00326484 | Esophagus | ESCC | regulation of interferon-beta production | 40/8552 | 56/18723 | 8.36e-05 | 6.08e-04 | 40 |
| GO:003247912 | Esophagus | ESCC | regulation of type I interferon production | 61/8552 | 95/18723 | 2.05e-04 | 1.29e-03 | 61 |
| GO:003260612 | Esophagus | ESCC | type I interferon production | 61/8552 | 95/18723 | 2.05e-04 | 1.29e-03 | 61 |
| GO:00327284 | Esophagus | ESCC | positive regulation of interferon-beta production | 29/8552 | 39/18723 | 2.59e-04 | 1.58e-03 | 29 |
| GO:00450885 | Esophagus | ESCC | regulation of innate immune response | 125/8552 | 218/18723 | 3.34e-04 | 1.96e-03 | 125 |
| GO:000181916 | Esophagus | ESCC | positive regulation of cytokine production | 244/8552 | 467/18723 | 2.29e-03 | 1.01e-02 | 244 |
| GO:000961515 | Oral cavity | OSCC | response to virus | 215/7305 | 367/18723 | 1.63e-14 | 9.41e-13 | 215 |
| GO:00516074 | Oral cavity | OSCC | defense response to virus | 154/7305 | 265/18723 | 1.96e-10 | 5.63e-09 | 154 |
| GO:01405464 | Oral cavity | OSCC | defense response to symbiont | 154/7305 | 265/18723 | 1.96e-10 | 5.63e-09 | 154 |
| GO:00028317 | Oral cavity | OSCC | regulation of response to biotic stimulus | 177/7305 | 327/18723 | 1.73e-08 | 3.43e-07 | 177 |
| GO:00063832 | Oral cavity | OSCC | transcription by RNA polymerase III | 34/7305 | 46/18723 | 1.61e-06 | 2.11e-05 | 34 |
| GO:00450884 | Oral cavity | OSCC | regulation of innate immune response | 116/7305 | 218/18723 | 1.36e-05 | 1.37e-04 | 116 |
| GO:00326083 | Oral cavity | OSCC | interferon-beta production | 37/7305 | 56/18723 | 3.74e-05 | 3.32e-04 | 37 |
| Page: 1 2 3 |
| Pathway ID | Tissue | Disease Stage | Description | Gene Ratio | Bg Ratio | pvalue | p.adjust | qvalue | Count |
| hsa0302021 | Esophagus | ESCC | RNA polymerase | 28/4205 | 34/8465 | 8.19e-05 | 3.35e-04 | 1.71e-04 | 28 |
| hsa046234 | Esophagus | ESCC | Cytosolic DNA-sensing pathway | 49/4205 | 75/8465 | 4.35e-03 | 1.12e-02 | 5.74e-03 | 49 |
| hsa0302031 | Esophagus | ESCC | RNA polymerase | 28/4205 | 34/8465 | 8.19e-05 | 3.35e-04 | 1.71e-04 | 28 |
| hsa0462311 | Esophagus | ESCC | Cytosolic DNA-sensing pathway | 49/4205 | 75/8465 | 4.35e-03 | 1.12e-02 | 5.74e-03 | 49 |
| hsa04623 | Oral cavity | OSCC | Cytosolic DNA-sensing pathway | 44/3704 | 75/8465 | 6.44e-03 | 1.51e-02 | 7.68e-03 | 44 |
| hsa046231 | Oral cavity | OSCC | Cytosolic DNA-sensing pathway | 44/3704 | 75/8465 | 6.44e-03 | 1.51e-02 | 7.68e-03 | 44 |
| Page: 1 |
Top |
Cell-cell communication analysis |
| Identification of potential cell-cell interactions between two cell types and their ligand-receptor pairs for different disease states |
| Ligand | Receptor | LRpair | Pathway | Tissue | Disease Stage |
| Page: 1 |
Top |
Single-cell gene regulatory network inference analysis |
| Find out the significant the regulons (TFs) and the target genes of each regulon across cell types for different disease states |
| TF | Cell Type | Tissue | Disease Stage | Target Gene | RSS | Regulon Activity |
| ∗The dot plots of a searched regulon are shown for all cell subpopulations in each disease state of each tissue based on the regulon specific score inferred using pySCENIC and by calculating the average expression. |
| Page: 1 |
Top |
Somatic mutation of malignant transformation related genes |
| Annotation of somatic variants for genes involved in malignant transformation |
| Hugo Symbol | Variant Class | Variant Classification | dbSNP RS | HGVSc | HGVSp | HGVSp Short | SWISSPROT | BIOTYPE | SIFT | PolyPhen | Tumor Sample Barcode | Tissue | Histology | Sex | Age | Stage | Therapy Types | Drugs | Outcome |
| POLR3D | SNV | Missense_Mutation | novel | c.808N>G | p.Gln270Glu | p.Q270E | P05423 | protein_coding | deleterious(0) | probably_damaging(0.998) | TCGA-AC-A3OD-01 | Breast | breast invasive carcinoma | Female | >=65 | I/II | Unknown | Unknown | SD |
| POLR3D | SNV | Missense_Mutation | c.647N>G | p.Ala216Gly | p.A216G | P05423 | protein_coding | tolerated(0.31) | benign(0) | TCGA-D8-A1JL-01 | Breast | breast invasive carcinoma | Female | >=65 | I/II | Unknown | Unknown | SD | |
| POLR3D | SNV | Missense_Mutation | novel | c.205N>A | p.Glu69Lys | p.E69K | P05423 | protein_coding | deleterious(0.01) | possibly_damaging(0.877) | TCGA-C5-A902-01 | Cervix | cervical & endocervical cancer | Female | <65 | I/II | Chemotherapy | cisplatin | SD |
| POLR3D | SNV | Missense_Mutation | c.459N>C | p.Gln153His | p.Q153H | P05423 | protein_coding | tolerated(0.16) | benign(0) | TCGA-EK-A2PM-01 | Cervix | cervical & endocervical cancer | Female | >=65 | I/II | Unknown | Unknown | SD | |
| POLR3D | SNV | Missense_Mutation | rs374647731 | c.466N>T | p.Arg156Cys | p.R156C | P05423 | protein_coding | deleterious(0.01) | possibly_damaging(0.828) | TCGA-VS-A9UJ-01 | Cervix | cervical & endocervical cancer | Female | <65 | I/II | Unknown | Unknown | PD |
| POLR3D | SNV | Missense_Mutation | novel | c.193C>T | p.Arg65Trp | p.R65W | P05423 | protein_coding | deleterious(0) | probably_damaging(0.999) | TCGA-A6-5659-01 | Colorectum | colon adenocarcinoma | Male | >=65 | I/II | Unknown | Unknown | SD |
| POLR3D | SNV | Missense_Mutation | c.272N>G | p.Glu91Gly | p.E91G | P05423 | protein_coding | tolerated(0.42) | benign(0) | TCGA-AA-3713-01 | Colorectum | colon adenocarcinoma | Male | >=65 | III/IV | Chemotherapy | 5-fluorouracil | PR | |
| POLR3D | SNV | Missense_Mutation | c.447N>T | p.Glu149Asp | p.E149D | P05423 | protein_coding | tolerated(0.08) | benign(0.118) | TCGA-AA-3955-01 | Colorectum | colon adenocarcinoma | Male | <65 | III/IV | Chemotherapy | capecitabine | CR | |
| POLR3D | SNV | Missense_Mutation | c.493N>A | p.Asp165Asn | p.D165N | P05423 | protein_coding | deleterious(0.04) | possibly_damaging(0.579) | TCGA-AA-A01P-01 | Colorectum | colon adenocarcinoma | Female | >=65 | III/IV | Unknown | Unknown | PD | |
| POLR3D | SNV | Missense_Mutation | novel | c.834N>C | p.Gln278His | p.Q278H | P05423 | protein_coding | tolerated(0.06) | benign(0.039) | TCGA-D5-6927-01 | Colorectum | colon adenocarcinoma | Male | <65 | I/II | Unknown | Unknown | SD |
| Page: 1 2 3 4 |
Top |
Related drugs of malignant transformation related genes |
| Identification of chemicals and drugs interact with genes involved in malignant transfromation |
| (DGIdb 4.0) |
| Entrez ID | Symbol | Category | Interaction Types | Drug Claim Name | Drug Name | PMIDs |
| Page: 1 |

Copyright 2023-Present -The University of Texas Health Science Center at Houston |