
|
|||||
|
 | |
| |
| |
| |
| |
| |
|
Gene: POLR3C |
Gene summary for POLR3C |
| Gene information | Species | Human | Gene symbol | POLR3C | Gene ID | 10623 |
| Gene name | RNA polymerase III subunit C | |
| Gene Alias | C82 | |
| Cytomap | 1q21.1 | |
| Gene Type | protein-coding | GO ID | GO:0001816 | UniProtAcc | Q9BUI4 |
Top |
Malignant transformation analysis |
| Identification of the aberrant gene expression in precancerous and cancerous lesions by comparing the gene expression of stem-like cells in diseased tissues with normal stem cells |
| Entrez ID | Symbol | Replicates | Species | Organ | Tissue | Adj P-value | Log2FC | Malignancy |
| 10623 | POLR3C | LZE4T | Human | Esophagus | ESCC | 2.23e-03 | 9.41e-02 | 0.0811 |
| 10623 | POLR3C | LZE5T | Human | Esophagus | ESCC | 1.46e-02 | 2.33e-01 | 0.0514 |
| 10623 | POLR3C | LZE7T | Human | Esophagus | ESCC | 2.22e-09 | 3.83e-01 | 0.0667 |
| 10623 | POLR3C | LZE22T | Human | Esophagus | ESCC | 1.60e-04 | 4.18e-01 | 0.068 |
| 10623 | POLR3C | LZE24T | Human | Esophagus | ESCC | 1.60e-23 | 6.36e-01 | 0.0596 |
| 10623 | POLR3C | LZE6T | Human | Esophagus | ESCC | 1.91e-02 | 1.88e-01 | 0.0845 |
| 10623 | POLR3C | P1T-E | Human | Esophagus | ESCC | 2.28e-04 | 2.30e-01 | 0.0875 |
| 10623 | POLR3C | P2T-E | Human | Esophagus | ESCC | 5.85e-20 | 3.95e-01 | 0.1177 |
| 10623 | POLR3C | P4T-E | Human | Esophagus | ESCC | 2.33e-16 | 2.98e-01 | 0.1323 |
| 10623 | POLR3C | P5T-E | Human | Esophagus | ESCC | 3.12e-13 | 2.55e-01 | 0.1327 |
| 10623 | POLR3C | P8T-E | Human | Esophagus | ESCC | 1.39e-15 | 2.22e-01 | 0.0889 |
| 10623 | POLR3C | P9T-E | Human | Esophagus | ESCC | 1.44e-13 | 2.49e-01 | 0.1131 |
| 10623 | POLR3C | P10T-E | Human | Esophagus | ESCC | 2.98e-13 | 2.37e-01 | 0.116 |
| 10623 | POLR3C | P11T-E | Human | Esophagus | ESCC | 9.98e-11 | 4.43e-01 | 0.1426 |
| 10623 | POLR3C | P12T-E | Human | Esophagus | ESCC | 3.45e-09 | 1.63e-01 | 0.1122 |
| 10623 | POLR3C | P15T-E | Human | Esophagus | ESCC | 5.93e-23 | 3.87e-01 | 0.1149 |
| 10623 | POLR3C | P16T-E | Human | Esophagus | ESCC | 6.13e-12 | 2.16e-01 | 0.1153 |
| 10623 | POLR3C | P17T-E | Human | Esophagus | ESCC | 7.34e-15 | 4.22e-01 | 0.1278 |
| 10623 | POLR3C | P19T-E | Human | Esophagus | ESCC | 3.25e-04 | 2.98e-01 | 0.1662 |
| 10623 | POLR3C | P20T-E | Human | Esophagus | ESCC | 1.29e-13 | 3.37e-01 | 0.1124 |
| Page: 1 2 3 4 |
| Tissue | Expression Dynamics | Abbreviation |
| Esophagus | 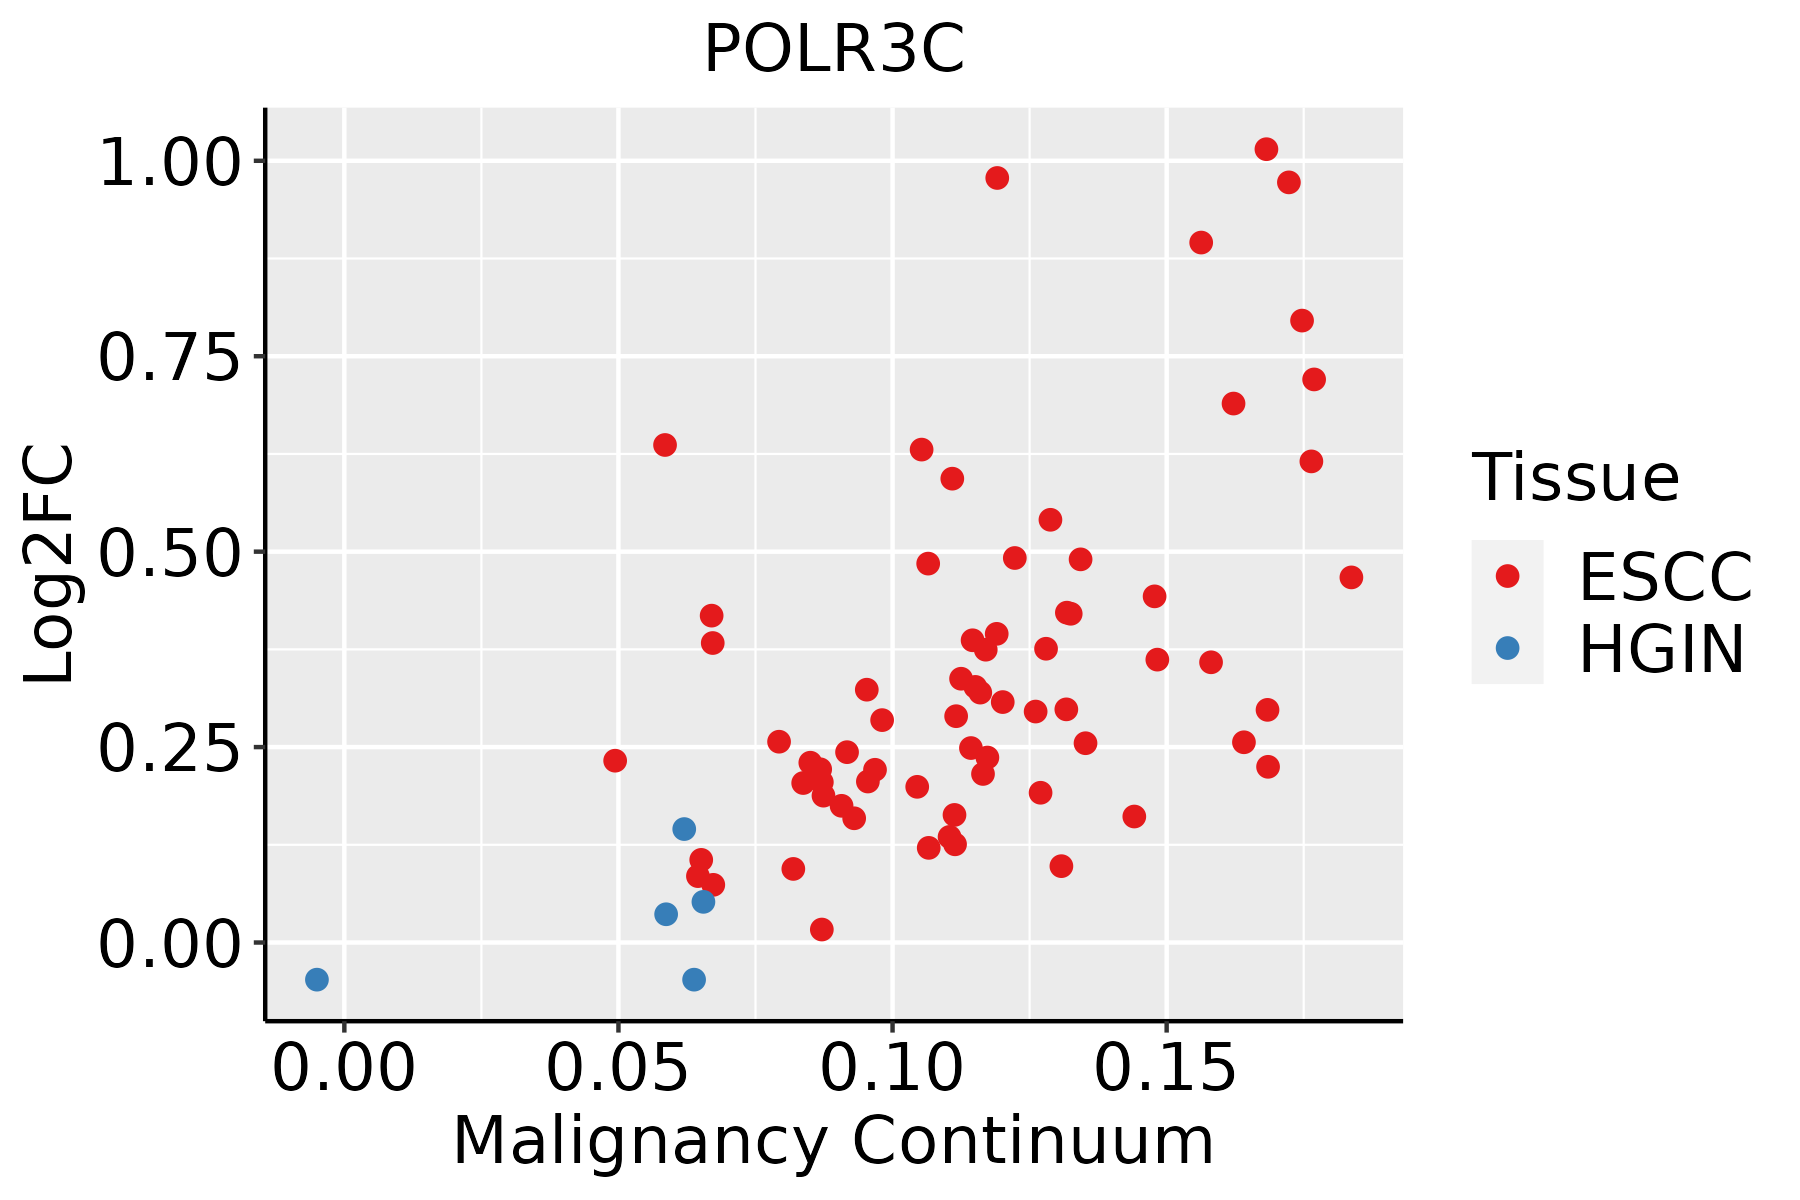 | ESCC: Esophageal squamous cell carcinoma |
| HGIN: High-grade intraepithelial neoplasias | ||
| LGIN: Low-grade intraepithelial neoplasias | ||
| Liver |  | HCC: Hepatocellular carcinoma |
| NAFLD: Non-alcoholic fatty liver disease | ||
| Oral Cavity | 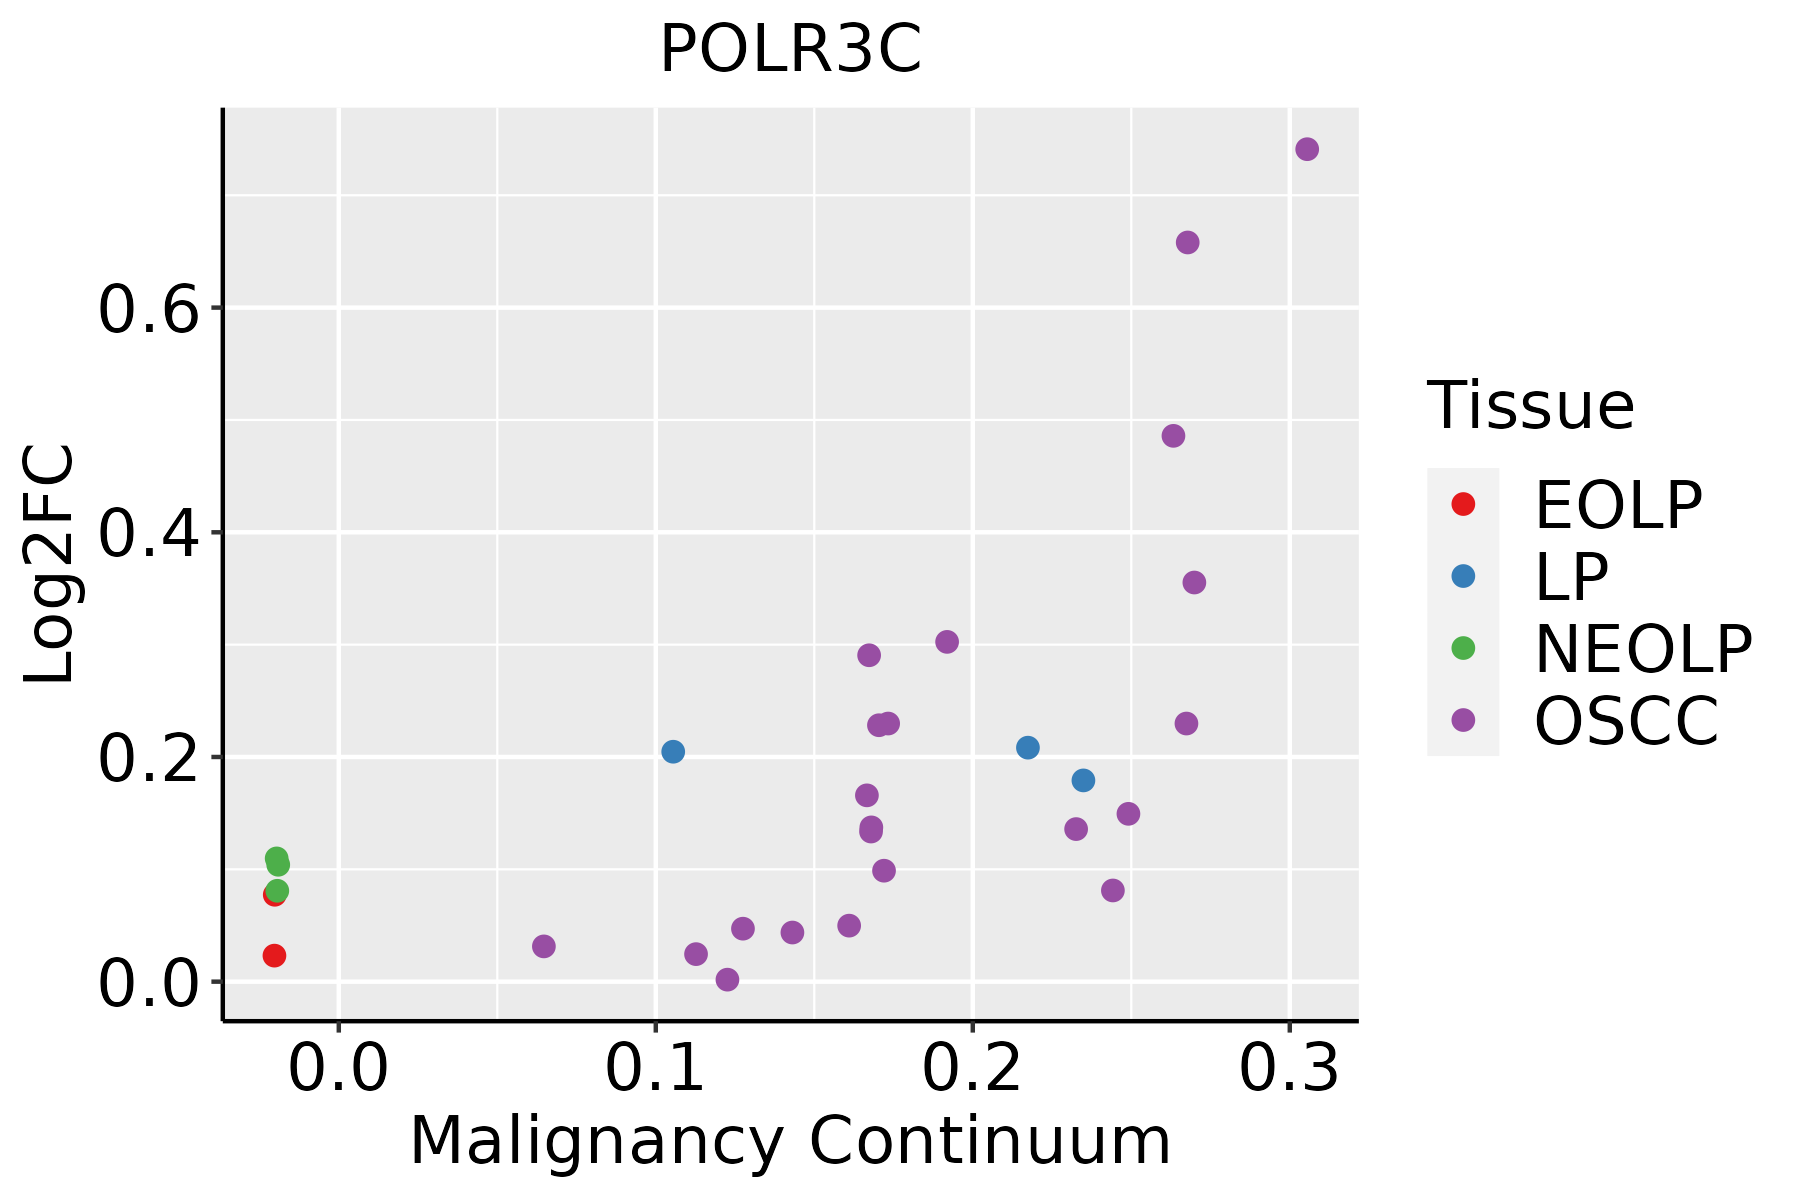 | EOLP: Erosive Oral lichen planus |
| LP: leukoplakia | ||
| NEOLP: Non-erosive oral lichen planus | ||
| OSCC: Oral squamous cell carcinoma |
| ∗log2FC in expression of this searched gene in stem-like cells from each diseased tissue sample relative to stem-like cells in normal samples in each tissue plotted against the malignancy continuum. Samples are colored based on if they are from different disease stage. |
Top |
Malignant transformation related pathway analysis |
| Find out the enriched GO biological processes and KEGG pathways involved in transition from healthy to precancer to cancer |
| Tissue | Disease Stage | Enriched GO biological Processes |
| Colorectum | AD |  |
| Colorectum | SER |  |
| Colorectum | MSS |  |
| Colorectum | MSI-H |  |
| Colorectum | FAP |  |
| ∗Top 15 enriched GO BP terms are showed in the bar plot of each disease state in each tissue. Each row represents a significant GO biological process which is colored according to the -log10(p.adjust). |
| Page: 1 2 3 4 5 6 7 8 9 |
| GO ID | Tissue | Disease Stage | Description | Gene Ratio | Bg Ratio | pvalue | p.adjust | Count |
| GO:000961518 | Esophagus | ESCC | response to virus | 238/8552 | 367/18723 | 6.65e-14 | 3.32e-12 | 238 |
| GO:00516075 | Esophagus | ESCC | defense response to virus | 171/8552 | 265/18723 | 3.91e-10 | 1.05e-08 | 171 |
| GO:01405465 | Esophagus | ESCC | defense response to symbiont | 171/8552 | 265/18723 | 3.91e-10 | 1.05e-08 | 171 |
| GO:00063833 | Esophagus | ESCC | transcription by RNA polymerase III | 41/8552 | 46/18723 | 7.69e-10 | 1.90e-08 | 41 |
| GO:00028318 | Esophagus | ESCC | regulation of response to biotic stimulus | 191/8552 | 327/18723 | 2.12e-06 | 2.45e-05 | 191 |
| GO:003248112 | Esophagus | ESCC | positive regulation of type I interferon production | 42/8552 | 58/18723 | 3.27e-05 | 2.70e-04 | 42 |
| GO:00326084 | Esophagus | ESCC | interferon-beta production | 40/8552 | 56/18723 | 8.36e-05 | 6.08e-04 | 40 |
| GO:00326484 | Esophagus | ESCC | regulation of interferon-beta production | 40/8552 | 56/18723 | 8.36e-05 | 6.08e-04 | 40 |
| GO:0006359 | Esophagus | ESCC | regulation of transcription by RNA polymerase III | 19/8552 | 22/18723 | 9.52e-05 | 6.78e-04 | 19 |
| GO:003247912 | Esophagus | ESCC | regulation of type I interferon production | 61/8552 | 95/18723 | 2.05e-04 | 1.29e-03 | 61 |
| GO:003260612 | Esophagus | ESCC | type I interferon production | 61/8552 | 95/18723 | 2.05e-04 | 1.29e-03 | 61 |
| GO:00327284 | Esophagus | ESCC | positive regulation of interferon-beta production | 29/8552 | 39/18723 | 2.59e-04 | 1.58e-03 | 29 |
| GO:00450885 | Esophagus | ESCC | regulation of innate immune response | 125/8552 | 218/18723 | 3.34e-04 | 1.96e-03 | 125 |
| GO:000181916 | Esophagus | ESCC | positive regulation of cytokine production | 244/8552 | 467/18723 | 2.29e-03 | 1.01e-02 | 244 |
| GO:000961511 | Liver | HCC | response to virus | 210/7958 | 367/18723 | 7.32e-09 | 1.86e-07 | 210 |
| GO:00516071 | Liver | HCC | defense response to virus | 151/7958 | 265/18723 | 1.27e-06 | 1.85e-05 | 151 |
| GO:01405461 | Liver | HCC | defense response to symbiont | 151/7958 | 265/18723 | 1.27e-06 | 1.85e-05 | 151 |
| GO:00324814 | Liver | HCC | positive regulation of type I interferon production | 41/7958 | 58/18723 | 1.29e-05 | 1.44e-04 | 41 |
| GO:0032479 | Liver | HCC | regulation of type I interferon production | 60/7958 | 95/18723 | 3.84e-05 | 3.80e-04 | 60 |
| GO:0032606 | Liver | HCC | type I interferon production | 60/7958 | 95/18723 | 3.84e-05 | 3.80e-04 | 60 |
| Page: 1 2 3 |
| Pathway ID | Tissue | Disease Stage | Description | Gene Ratio | Bg Ratio | pvalue | p.adjust | qvalue | Count |
| hsa0302021 | Esophagus | ESCC | RNA polymerase | 28/4205 | 34/8465 | 8.19e-05 | 3.35e-04 | 1.71e-04 | 28 |
| hsa046234 | Esophagus | ESCC | Cytosolic DNA-sensing pathway | 49/4205 | 75/8465 | 4.35e-03 | 1.12e-02 | 5.74e-03 | 49 |
| hsa0302031 | Esophagus | ESCC | RNA polymerase | 28/4205 | 34/8465 | 8.19e-05 | 3.35e-04 | 1.71e-04 | 28 |
| hsa0462311 | Esophagus | ESCC | Cytosolic DNA-sensing pathway | 49/4205 | 75/8465 | 4.35e-03 | 1.12e-02 | 5.74e-03 | 49 |
| hsa03020 | Liver | HCC | RNA polymerase | 24/4020 | 34/8465 | 5.40e-03 | 1.57e-02 | 8.75e-03 | 24 |
| hsa030201 | Liver | HCC | RNA polymerase | 24/4020 | 34/8465 | 5.40e-03 | 1.57e-02 | 8.75e-03 | 24 |
| hsa030204 | Oral cavity | OSCC | RNA polymerase | 25/3704 | 34/8465 | 4.12e-04 | 1.27e-03 | 6.45e-04 | 25 |
| hsa04623 | Oral cavity | OSCC | Cytosolic DNA-sensing pathway | 44/3704 | 75/8465 | 6.44e-03 | 1.51e-02 | 7.68e-03 | 44 |
| hsa0302011 | Oral cavity | OSCC | RNA polymerase | 25/3704 | 34/8465 | 4.12e-04 | 1.27e-03 | 6.45e-04 | 25 |
| hsa046231 | Oral cavity | OSCC | Cytosolic DNA-sensing pathway | 44/3704 | 75/8465 | 6.44e-03 | 1.51e-02 | 7.68e-03 | 44 |
| Page: 1 |
Top |
Cell-cell communication analysis |
| Identification of potential cell-cell interactions between two cell types and their ligand-receptor pairs for different disease states |
| Ligand | Receptor | LRpair | Pathway | Tissue | Disease Stage |
| Page: 1 |
Top |
Single-cell gene regulatory network inference analysis |
| Find out the significant the regulons (TFs) and the target genes of each regulon across cell types for different disease states |
| TF | Cell Type | Tissue | Disease Stage | Target Gene | RSS | Regulon Activity |
| ∗The dot plots of a searched regulon are shown for all cell subpopulations in each disease state of each tissue based on the regulon specific score inferred using pySCENIC and by calculating the average expression. |
| Page: 1 |
Top |
Somatic mutation of malignant transformation related genes |
| Annotation of somatic variants for genes involved in malignant transformation |
| Hugo Symbol | Variant Class | Variant Classification | dbSNP RS | HGVSc | HGVSp | HGVSp Short | SWISSPROT | BIOTYPE | SIFT | PolyPhen | Tumor Sample Barcode | Tissue | Histology | Sex | Age | Stage | Therapy Types | Drugs | Outcome |
| POLR3C | SNV | Missense_Mutation | novel | c.1338N>C | p.Leu446Phe | p.L446F | Q9BUI4 | protein_coding | deleterious(0.01) | probably_damaging(0.93) | TCGA-5L-AAT1-01 | Breast | breast invasive carcinoma | Female | <65 | III/IV | Hormone Therapy | letrozol | SD |
| POLR3C | SNV | Missense_Mutation | c.1405G>T | p.Ala469Ser | p.A469S | Q9BUI4 | protein_coding | tolerated(0.07) | possibly_damaging(0.468) | TCGA-A8-A08L-01 | Breast | breast invasive carcinoma | Female | >=65 | III/IV | Unknown | Unknown | SD | |
| POLR3C | SNV | Missense_Mutation | c.340N>A | p.Gly114Ser | p.G114S | Q9BUI4 | protein_coding | deleterious(0.01) | probably_damaging(0.991) | TCGA-BH-A0RX-01 | Breast | breast invasive carcinoma | Female | <65 | I/II | Chemotherapy | fluorouracil | SD | |
| POLR3C | SNV | Missense_Mutation | c.648N>C | p.Lys216Asn | p.K216N | Q9BUI4 | protein_coding | deleterious(0.02) | probably_damaging(0.933) | TCGA-E2-A1LG-01 | Breast | breast invasive carcinoma | Female | <65 | I/II | Chemotherapy | doxorubicin | SD | |
| POLR3C | SNV | Missense_Mutation | novel | c.352A>G | p.Met118Val | p.M118V | Q9BUI4 | protein_coding | deleterious(0.01) | benign(0.01) | TCGA-JL-A3YW-01 | Breast | breast invasive carcinoma | Female | <65 | I/II | Unknown | Unknown | SD |
| POLR3C | SNV | Missense_Mutation | c.619N>A | p.Glu207Lys | p.E207K | Q9BUI4 | protein_coding | tolerated(0.07) | benign(0.081) | TCGA-EA-A3HS-01 | Cervix | cervical & endocervical cancer | Female | <65 | I/II | Unknown | Unknown | SD | |
| POLR3C | SNV | Missense_Mutation | c.676N>C | p.Glu226Gln | p.E226Q | Q9BUI4 | protein_coding | tolerated(0.17) | benign(0.03) | TCGA-IR-A3LA-01 | Cervix | cervical & endocervical cancer | Female | <65 | I/II | Chemotherapy | cisplatin | CR | |
| POLR3C | SNV | Missense_Mutation | c.1126N>C | p.Glu376Gln | p.E376Q | Q9BUI4 | protein_coding | deleterious(0) | probably_damaging(0.999) | TCGA-JW-A5VL-01 | Cervix | cervical & endocervical cancer | Female | <65 | I/II | Unknown | Unknown | SD | |
| POLR3C | SNV | Missense_Mutation | novel | c.985N>G | p.Ser329Gly | p.S329G | Q9BUI4 | protein_coding | tolerated(0.06) | benign(0.143) | TCGA-A6-2672-01 | Colorectum | colon adenocarcinoma | Female | >=65 | III/IV | Unknown | Unknown | SD |
| POLR3C | SNV | Missense_Mutation | c.1376G>A | p.Arg459His | p.R459H | Q9BUI4 | protein_coding | deleterious(0) | benign(0.301) | TCGA-AA-3710-01 | Colorectum | colon adenocarcinoma | Female | >=65 | I/II | Unknown | Unknown | SD |
| Page: 1 2 3 4 |
Top |
Related drugs of malignant transformation related genes |
| Identification of chemicals and drugs interact with genes involved in malignant transfromation |
| (DGIdb 4.0) |
| Entrez ID | Symbol | Category | Interaction Types | Drug Claim Name | Drug Name | PMIDs |
| Page: 1 |

Copyright 2023-Present -The University of Texas Health Science Center at Houston |