
|
|||||
|
 | |
| |
| |
| |
| |
| |
|
Gene: POLR3A |
Gene summary for POLR3A |
| Gene information | Species | Human | Gene symbol | POLR3A | Gene ID | 11128 |
| Gene name | RNA polymerase III subunit A | |
| Gene Alias | ADDH | |
| Cytomap | 10q22.3 | |
| Gene Type | protein-coding | GO ID | GO:0001816 | UniProtAcc | O14802 |
Top |
Malignant transformation analysis |
| Identification of the aberrant gene expression in precancerous and cancerous lesions by comparing the gene expression of stem-like cells in diseased tissues with normal stem cells |
| Entrez ID | Symbol | Replicates | Species | Organ | Tissue | Adj P-value | Log2FC | Malignancy |
| 11128 | POLR3A | LZE4T | Human | Esophagus | ESCC | 2.59e-07 | 1.26e-01 | 0.0811 |
| 11128 | POLR3A | LZE7T | Human | Esophagus | ESCC | 2.47e-03 | 1.67e-01 | 0.0667 |
| 11128 | POLR3A | LZE24T | Human | Esophagus | ESCC | 2.34e-02 | 1.59e-01 | 0.0596 |
| 11128 | POLR3A | LZE21T | Human | Esophagus | ESCC | 3.26e-02 | 1.36e-01 | 0.0655 |
| 11128 | POLR3A | P2T-E | Human | Esophagus | ESCC | 7.39e-23 | 2.84e-01 | 0.1177 |
| 11128 | POLR3A | P4T-E | Human | Esophagus | ESCC | 3.63e-07 | 2.02e-01 | 0.1323 |
| 11128 | POLR3A | P5T-E | Human | Esophagus | ESCC | 6.26e-11 | 9.35e-02 | 0.1327 |
| 11128 | POLR3A | P8T-E | Human | Esophagus | ESCC | 1.02e-09 | 1.33e-01 | 0.0889 |
| 11128 | POLR3A | P9T-E | Human | Esophagus | ESCC | 1.00e-04 | 4.77e-02 | 0.1131 |
| 11128 | POLR3A | P10T-E | Human | Esophagus | ESCC | 6.44e-10 | 1.31e-01 | 0.116 |
| 11128 | POLR3A | P11T-E | Human | Esophagus | ESCC | 2.31e-02 | 8.49e-02 | 0.1426 |
| 11128 | POLR3A | P12T-E | Human | Esophagus | ESCC | 2.07e-09 | 1.46e-01 | 0.1122 |
| 11128 | POLR3A | P15T-E | Human | Esophagus | ESCC | 3.21e-11 | 1.79e-01 | 0.1149 |
| 11128 | POLR3A | P16T-E | Human | Esophagus | ESCC | 1.86e-11 | 1.74e-01 | 0.1153 |
| 11128 | POLR3A | P19T-E | Human | Esophagus | ESCC | 1.92e-02 | 2.36e-01 | 0.1662 |
| 11128 | POLR3A | P20T-E | Human | Esophagus | ESCC | 7.48e-08 | 1.00e-01 | 0.1124 |
| 11128 | POLR3A | P21T-E | Human | Esophagus | ESCC | 6.12e-13 | 2.75e-01 | 0.1617 |
| 11128 | POLR3A | P22T-E | Human | Esophagus | ESCC | 7.40e-06 | 6.88e-02 | 0.1236 |
| 11128 | POLR3A | P23T-E | Human | Esophagus | ESCC | 2.38e-14 | 4.03e-01 | 0.108 |
| 11128 | POLR3A | P24T-E | Human | Esophagus | ESCC | 5.97e-15 | 2.83e-01 | 0.1287 |
| Page: 1 2 3 4 |
| Tissue | Expression Dynamics | Abbreviation |
| Esophagus | 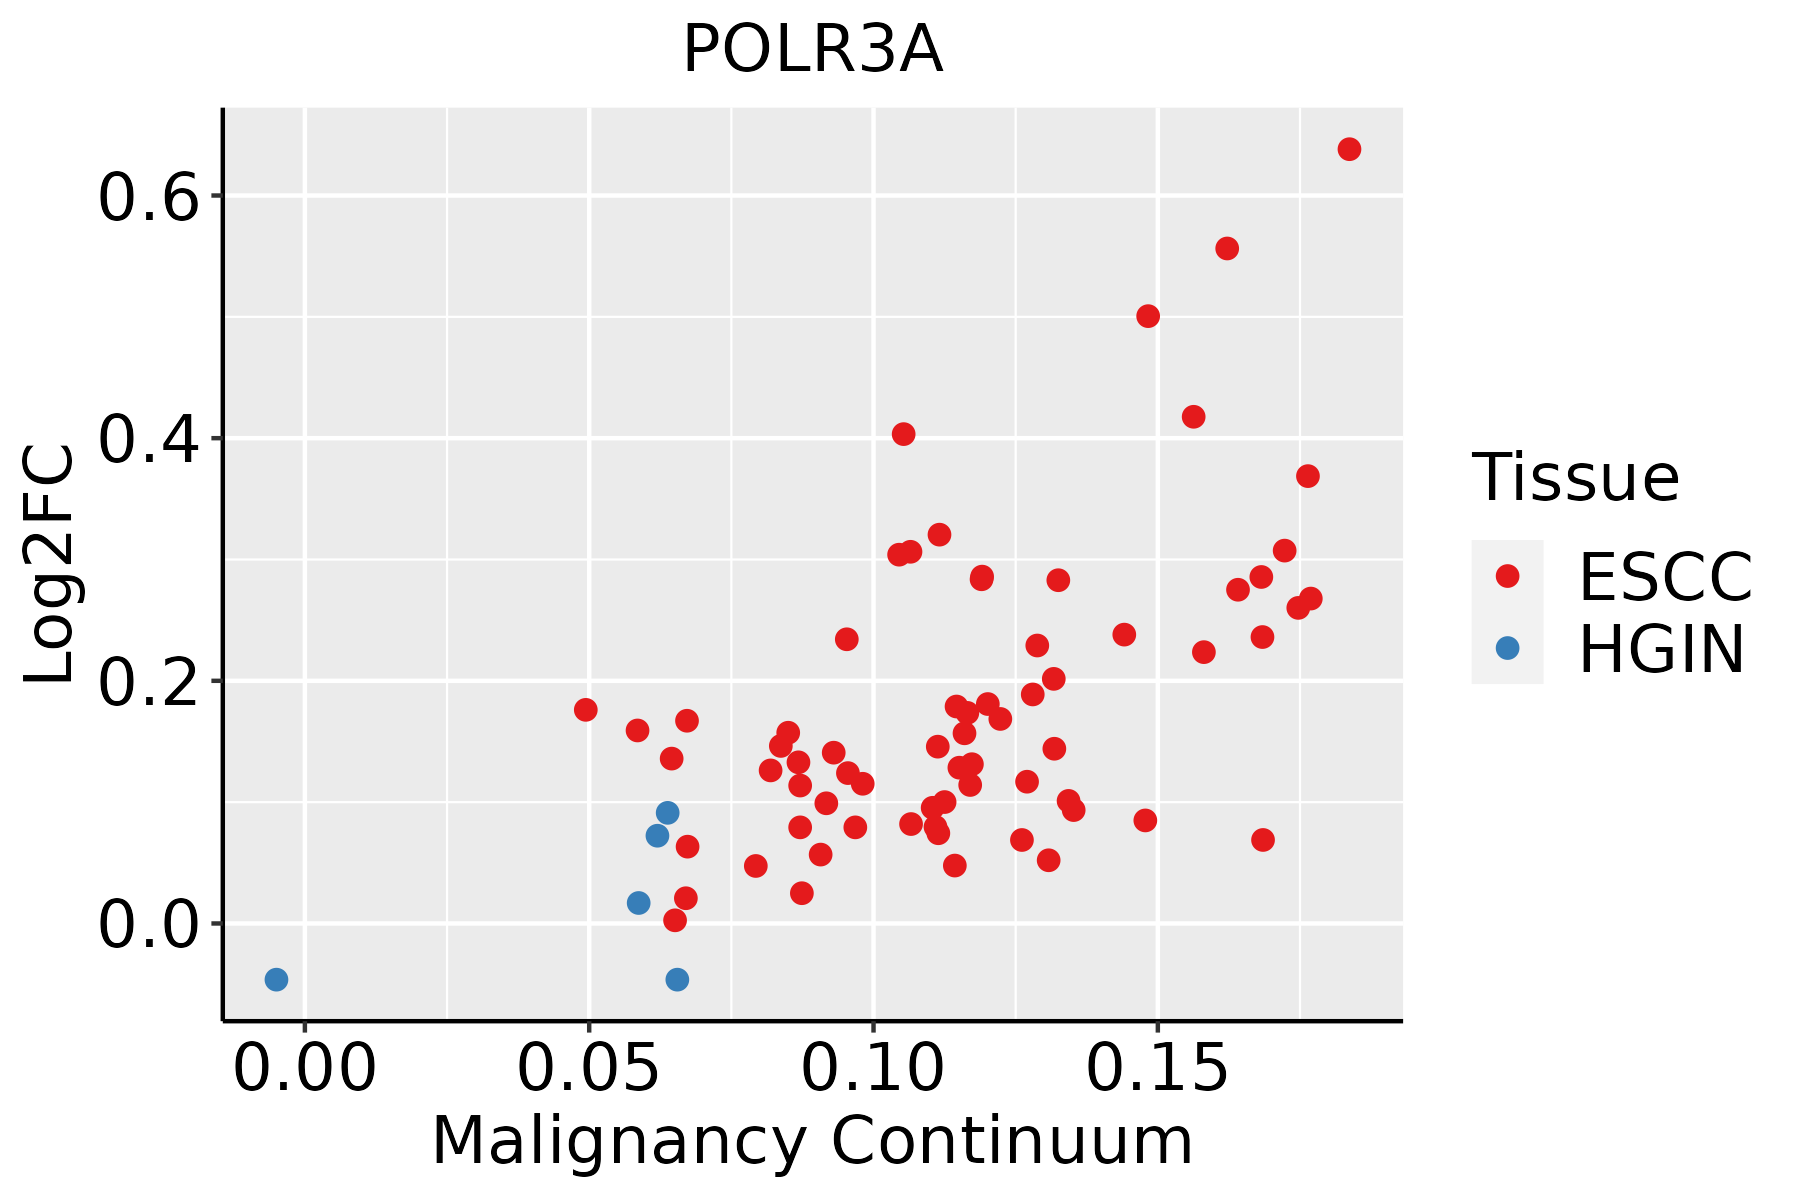 | ESCC: Esophageal squamous cell carcinoma |
| HGIN: High-grade intraepithelial neoplasias | ||
| LGIN: Low-grade intraepithelial neoplasias | ||
| Liver | 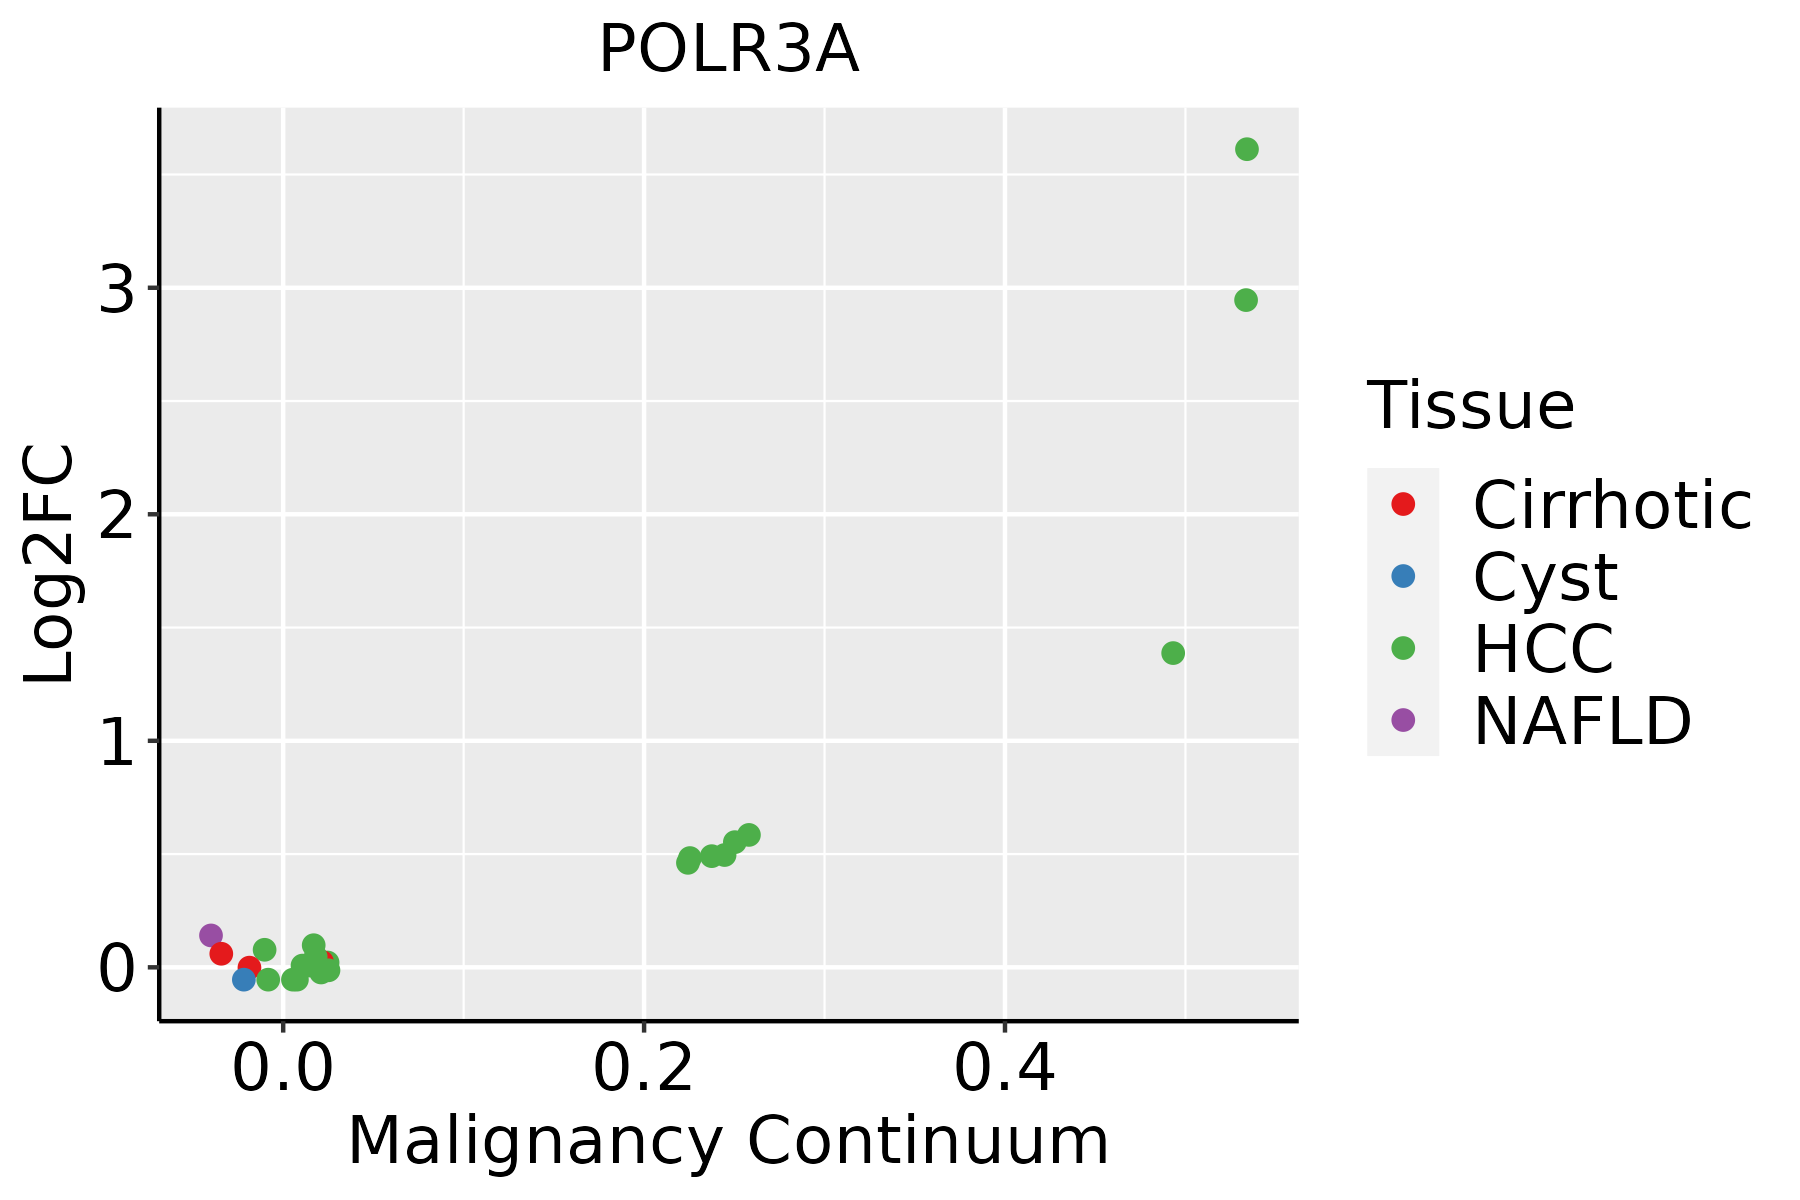 | HCC: Hepatocellular carcinoma |
| NAFLD: Non-alcoholic fatty liver disease |
| ∗log2FC in expression of this searched gene in stem-like cells from each diseased tissue sample relative to stem-like cells in normal samples in each tissue plotted against the malignancy continuum. Samples are colored based on if they are from different disease stage. |
Top |
Malignant transformation related pathway analysis |
| Find out the enriched GO biological processes and KEGG pathways involved in transition from healthy to precancer to cancer |
| Tissue | Disease Stage | Enriched GO biological Processes |
| Colorectum | AD |  |
| Colorectum | SER |  |
| Colorectum | MSS |  |
| Colorectum | MSI-H |  |
| Colorectum | FAP |  |
| ∗Top 15 enriched GO BP terms are showed in the bar plot of each disease state in each tissue. Each row represents a significant GO biological process which is colored according to the -log10(p.adjust). |
| Page: 1 2 3 4 5 6 7 8 9 |
| GO ID | Tissue | Disease Stage | Description | Gene Ratio | Bg Ratio | pvalue | p.adjust | Count |
| GO:000961518 | Esophagus | ESCC | response to virus | 238/8552 | 367/18723 | 6.65e-14 | 3.32e-12 | 238 |
| GO:00516075 | Esophagus | ESCC | defense response to virus | 171/8552 | 265/18723 | 3.91e-10 | 1.05e-08 | 171 |
| GO:01405465 | Esophagus | ESCC | defense response to symbiont | 171/8552 | 265/18723 | 3.91e-10 | 1.05e-08 | 171 |
| GO:003248112 | Esophagus | ESCC | positive regulation of type I interferon production | 42/8552 | 58/18723 | 3.27e-05 | 2.70e-04 | 42 |
| GO:00326084 | Esophagus | ESCC | interferon-beta production | 40/8552 | 56/18723 | 8.36e-05 | 6.08e-04 | 40 |
| GO:00326484 | Esophagus | ESCC | regulation of interferon-beta production | 40/8552 | 56/18723 | 8.36e-05 | 6.08e-04 | 40 |
| GO:003247912 | Esophagus | ESCC | regulation of type I interferon production | 61/8552 | 95/18723 | 2.05e-04 | 1.29e-03 | 61 |
| GO:003260612 | Esophagus | ESCC | type I interferon production | 61/8552 | 95/18723 | 2.05e-04 | 1.29e-03 | 61 |
| GO:00327284 | Esophagus | ESCC | positive regulation of interferon-beta production | 29/8552 | 39/18723 | 2.59e-04 | 1.58e-03 | 29 |
| GO:000181916 | Esophagus | ESCC | positive regulation of cytokine production | 244/8552 | 467/18723 | 2.29e-03 | 1.01e-02 | 244 |
| GO:000961511 | Liver | HCC | response to virus | 210/7958 | 367/18723 | 7.32e-09 | 1.86e-07 | 210 |
| GO:00516071 | Liver | HCC | defense response to virus | 151/7958 | 265/18723 | 1.27e-06 | 1.85e-05 | 151 |
| GO:01405461 | Liver | HCC | defense response to symbiont | 151/7958 | 265/18723 | 1.27e-06 | 1.85e-05 | 151 |
| GO:00324814 | Liver | HCC | positive regulation of type I interferon production | 41/7958 | 58/18723 | 1.29e-05 | 1.44e-04 | 41 |
| GO:0032479 | Liver | HCC | regulation of type I interferon production | 60/7958 | 95/18723 | 3.84e-05 | 3.80e-04 | 60 |
| GO:0032606 | Liver | HCC | type I interferon production | 60/7958 | 95/18723 | 3.84e-05 | 3.80e-04 | 60 |
| GO:0032728 | Liver | HCC | positive regulation of interferon-beta production | 26/7958 | 39/18723 | 1.99e-03 | 1.01e-02 | 26 |
| GO:0032608 | Liver | HCC | interferon-beta production | 34/7958 | 56/18723 | 4.54e-03 | 1.96e-02 | 34 |
| GO:0032648 | Liver | HCC | regulation of interferon-beta production | 34/7958 | 56/18723 | 4.54e-03 | 1.96e-02 | 34 |
| Page: 1 |
| Pathway ID | Tissue | Disease Stage | Description | Gene Ratio | Bg Ratio | pvalue | p.adjust | qvalue | Count |
| hsa0302021 | Esophagus | ESCC | RNA polymerase | 28/4205 | 34/8465 | 8.19e-05 | 3.35e-04 | 1.71e-04 | 28 |
| hsa046234 | Esophagus | ESCC | Cytosolic DNA-sensing pathway | 49/4205 | 75/8465 | 4.35e-03 | 1.12e-02 | 5.74e-03 | 49 |
| hsa0302031 | Esophagus | ESCC | RNA polymerase | 28/4205 | 34/8465 | 8.19e-05 | 3.35e-04 | 1.71e-04 | 28 |
| hsa0462311 | Esophagus | ESCC | Cytosolic DNA-sensing pathway | 49/4205 | 75/8465 | 4.35e-03 | 1.12e-02 | 5.74e-03 | 49 |
| hsa03020 | Liver | HCC | RNA polymerase | 24/4020 | 34/8465 | 5.40e-03 | 1.57e-02 | 8.75e-03 | 24 |
| hsa030201 | Liver | HCC | RNA polymerase | 24/4020 | 34/8465 | 5.40e-03 | 1.57e-02 | 8.75e-03 | 24 |
| Page: 1 |
Top |
Cell-cell communication analysis |
| Identification of potential cell-cell interactions between two cell types and their ligand-receptor pairs for different disease states |
| Ligand | Receptor | LRpair | Pathway | Tissue | Disease Stage |
| Page: 1 |
Top |
Single-cell gene regulatory network inference analysis |
| Find out the significant the regulons (TFs) and the target genes of each regulon across cell types for different disease states |
| TF | Cell Type | Tissue | Disease Stage | Target Gene | RSS | Regulon Activity |
| POLR3A | PLA | Breast | IDC | TTC32,RFC2,ANKRD30A, etc. | 1.38e-01 |  |
| POLR3A | CD8TEREX | Colorectum | ADJ | FAM120AOS,C19orf48,SYTL1, etc. | 9.26e-02 |  |
| POLR3A | CD8TEXINT | Colorectum | ADJ | FAM120AOS,C19orf48,SYTL1, etc. | 1.03e-01 | |
| POLR3A | CD8TEREX | Colorectum | CRC | FAM120AOS,C19orf48,SYTL1, etc. | 5.56e-02 |  |
| POLR3A | CD8TEXINT | Colorectum | FAP | FAM120AOS,C19orf48,SYTL1, etc. | 4.12e-02 |  |
| POLR3A | ILC | Colorectum | Healthy | FAM120AOS,C19orf48,SYTL1, etc. | 3.66e-02 |  |
| POLR3A | CD8TEXINT | Colorectum | MSI-H | FAM120AOS,C19orf48,SYTL1, etc. | 5.98e-02 |  |
| POLR3A | CD8TEXINT | Colorectum | MSS | FAM120AOS,C19orf48,SYTL1, etc. | 9.87e-02 |  |
| POLR3A | CD8TCM | Colorectum | MSS | FAM120AOS,C19orf48,SYTL1, etc. | 9.93e-02 | |
| POLR3A | CD8TCM | Lung | AAH | PLEKHG3,KIR3DL2,NCR1, etc. | 2.87e-01 |  |
| ∗The dot plots of a searched regulon are shown for all cell subpopulations in each disease state of each tissue based on the regulon specific score inferred using pySCENIC and by calculating the average expression. |
| Page: 1 2 |
Top |
Somatic mutation of malignant transformation related genes |
| Annotation of somatic variants for genes involved in malignant transformation |
| Hugo Symbol | Variant Class | Variant Classification | dbSNP RS | HGVSc | HGVSp | HGVSp Short | SWISSPROT | BIOTYPE | SIFT | PolyPhen | Tumor Sample Barcode | Tissue | Histology | Sex | Age | Stage | Therapy Types | Drugs | Outcome |
| POLR3A | SNV | Missense_Mutation | novel | c.925G>A | p.Asp309Asn | p.D309N | O14802 | protein_coding | tolerated(0.31) | benign(0.309) | TCGA-5L-AAT0-01 | Breast | breast invasive carcinoma | Female | <65 | I/II | Hormone Therapy | tamoxiphen | SD |
| POLR3A | SNV | Missense_Mutation | c.1522N>T | p.His508Tyr | p.H508Y | O14802 | protein_coding | deleterious(0) | probably_damaging(0.991) | TCGA-B6-A0WZ-01 | Breast | breast invasive carcinoma | Female | <65 | I/II | Unknown | Unknown | PD | |
| POLR3A | SNV | Missense_Mutation | c.1964T>G | p.Leu655Arg | p.L655R | O14802 | protein_coding | deleterious(0) | probably_damaging(0.977) | TCGA-D8-A1XK-01 | Breast | breast invasive carcinoma | Female | <65 | I/II | Chemotherapy | doxorubicine+cyclophosphamide | SD | |
| POLR3A | SNV | Missense_Mutation | novel | c.3137N>T | p.Thr1046Ile | p.T1046I | O14802 | protein_coding | deleterious(0) | probably_damaging(1) | TCGA-E2-A574-01 | Breast | breast invasive carcinoma | Female | <65 | I/II | Chemotherapy | adriamycin | SD |
| POLR3A | SNV | Missense_Mutation | rs768303077 | c.1277N>A | p.Thr426Lys | p.T426K | O14802 | protein_coding | tolerated(0.49) | benign(0.373) | TCGA-EW-A1P4-01 | Breast | breast invasive carcinoma | Female | <65 | I/II | Chemotherapy | docetaxel | SD |
| POLR3A | SNV | Missense_Mutation | novel | c.1348N>A | p.Val450Ile | p.V450I | O14802 | protein_coding | tolerated(0.08) | benign(0.294) | TCGA-LD-A7W6-01 | Breast | breast invasive carcinoma | Female | <65 | I/II | Chemotherapy | letrozole | SD |
| POLR3A | insertion | Frame_Shift_Ins | novel | c.1514_1515insAGTTTGTCTGTATTTTGTCATCTTTTTGGCG | p.Met505IlefsTer22 | p.M505Ifs*22 | O14802 | protein_coding | TCGA-A2-A04V-01 | Breast | breast invasive carcinoma | Female | <65 | I/II | Chemotherapy | cytoxan | PD | ||
| POLR3A | insertion | Nonsense_Mutation | novel | c.2929_2930insGTACTAGCCCTTAAAACACATTCTGTCAGCTCGTTCTCTCACG | p.Ser977CysfsTer5 | p.S977Cfs*5 | O14802 | protein_coding | TCGA-A8-A07J-01 | Breast | breast invasive carcinoma | Female | <65 | I/II | Chemotherapy | 5-fluorouracil | CR | ||
| POLR3A | deletion | Frame_Shift_Del | c.2015delG | p.Gly672AspfsTer39 | p.G672Dfs*39 | O14802 | protein_coding | TCGA-BH-A18G-01 | Breast | breast invasive carcinoma | Female | >=65 | I/II | Unknown | Unknown | SD | |||
| POLR3A | SNV | Missense_Mutation | c.1495N>A | p.Asp499Asn | p.D499N | O14802 | protein_coding | deleterious(0) | probably_damaging(0.965) | TCGA-LP-A5U2-01 | Cervix | cervical & endocervical cancer | Female | <65 | III/IV | Unknown | Unknown | SD |
| Page: 1 2 3 4 5 6 7 8 9 10 11 |
Top |
Related drugs of malignant transformation related genes |
| Identification of chemicals and drugs interact with genes involved in malignant transfromation |
| (DGIdb 4.0) |
| Entrez ID | Symbol | Category | Interaction Types | Drug Claim Name | Drug Name | PMIDs |
| Page: 1 |

Copyright 2023-Present -The University of Texas Health Science Center at Houston |