
|
|||||
|
 | |
| |
| |
| |
| |
| |
|
Gene: POLR2L |
Gene summary for POLR2L |
| Gene information | Species | Human | Gene symbol | POLR2L | Gene ID | 5441 |
| Gene name | RNA polymerase II, I and III subunit L | |
| Gene Alias | RBP10 | |
| Cytomap | 11p15.5 | |
| Gene Type | protein-coding | GO ID | GO:0006139 | UniProtAcc | P62875 |
Top |
Malignant transformation analysis |
| Identification of the aberrant gene expression in precancerous and cancerous lesions by comparing the gene expression of stem-like cells in diseased tissues with normal stem cells |
| Entrez ID | Symbol | Replicates | Species | Organ | Tissue | Adj P-value | Log2FC | Malignancy |
| 5441 | POLR2L | GSM4909285 | Human | Breast | IDC | 8.28e-23 | -6.17e-01 | 0.21 |
| 5441 | POLR2L | GSM4909286 | Human | Breast | IDC | 2.90e-05 | 1.63e-01 | 0.1081 |
| 5441 | POLR2L | GSM4909290 | Human | Breast | IDC | 2.26e-32 | 6.20e-01 | 0.2096 |
| 5441 | POLR2L | GSM4909293 | Human | Breast | IDC | 6.53e-03 | 3.00e-01 | 0.1581 |
| 5441 | POLR2L | GSM4909294 | Human | Breast | IDC | 2.20e-33 | 4.28e-01 | 0.2022 |
| 5441 | POLR2L | GSM4909296 | Human | Breast | IDC | 3.67e-59 | 6.91e-01 | 0.1524 |
| 5441 | POLR2L | GSM4909297 | Human | Breast | IDC | 1.73e-33 | 2.31e-01 | 0.1517 |
| 5441 | POLR2L | GSM4909298 | Human | Breast | IDC | 2.15e-51 | 6.66e-01 | 0.1551 |
| 5441 | POLR2L | GSM4909299 | Human | Breast | IDC | 3.60e-02 | 2.20e-01 | 0.035 |
| 5441 | POLR2L | GSM4909301 | Human | Breast | IDC | 1.04e-19 | 4.41e-01 | 0.1577 |
| 5441 | POLR2L | GSM4909302 | Human | Breast | IDC | 1.26e-23 | 4.46e-01 | 0.1545 |
| 5441 | POLR2L | GSM4909304 | Human | Breast | IDC | 6.20e-64 | 7.05e-01 | 0.1636 |
| 5441 | POLR2L | GSM4909306 | Human | Breast | IDC | 1.21e-11 | 3.72e-01 | 0.1564 |
| 5441 | POLR2L | GSM4909307 | Human | Breast | IDC | 1.28e-06 | 2.78e-01 | 0.1569 |
| 5441 | POLR2L | GSM4909309 | Human | Breast | IDC | 3.32e-08 | 1.99e-01 | 0.0483 |
| 5441 | POLR2L | GSM4909311 | Human | Breast | IDC | 3.00e-48 | -1.90e-01 | 0.1534 |
| 5441 | POLR2L | GSM4909312 | Human | Breast | IDC | 1.01e-11 | -1.72e-01 | 0.1552 |
| 5441 | POLR2L | GSM4909315 | Human | Breast | IDC | 4.00e-09 | 2.87e-01 | 0.21 |
| 5441 | POLR2L | GSM4909316 | Human | Breast | IDC | 6.95e-14 | 4.49e-01 | 0.21 |
| 5441 | POLR2L | GSM4909318 | Human | Breast | IDC | 7.94e-13 | 5.99e-01 | 0.2031 |
| Page: 1 2 3 4 5 6 7 8 9 10 11 12 13 14 15 16 17 18 |
| Tissue | Expression Dynamics | Abbreviation |
| Breast |  | IDC: Invasive ductal carcinoma |
| DCIS: Ductal carcinoma in situ | ||
| Precancer(BRCA1-mut): Precancerous lesion from BRCA1 mutation carriers | ||
| Cervix |  | CC: Cervix cancer |
| HSIL_HPV: HPV-infected high-grade squamous intraepithelial lesions | ||
| N_HPV: HPV-infected normal cervix | ||
| Colorectum (GSE201348) | 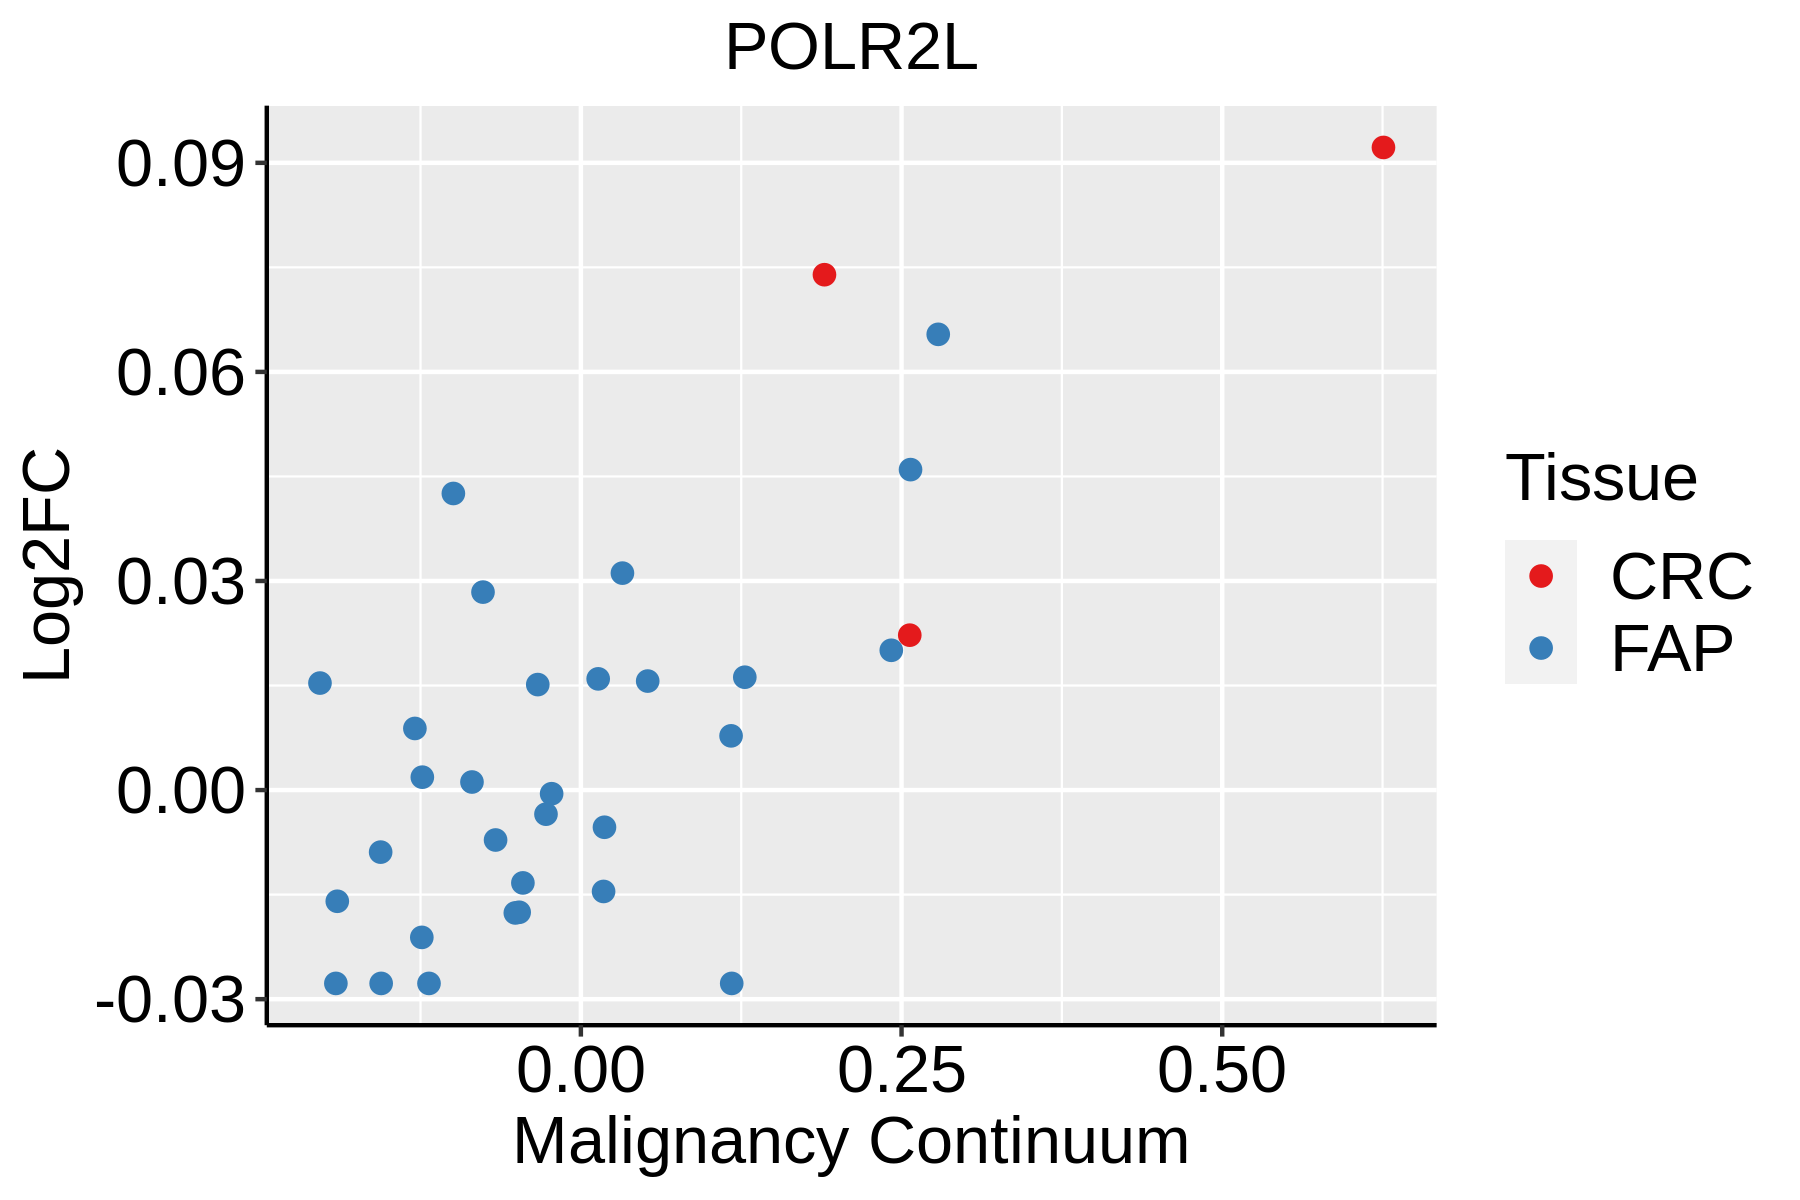 | FAP: Familial adenomatous polyposis |
| CRC: Colorectal cancer | ||
| Colorectum (HTA11) |  | AD: Adenomas |
| SER: Sessile serrated lesions | ||
| MSI-H: Microsatellite-high colorectal cancer | ||
| MSS: Microsatellite stable colorectal cancer | ||
| Endometrium | 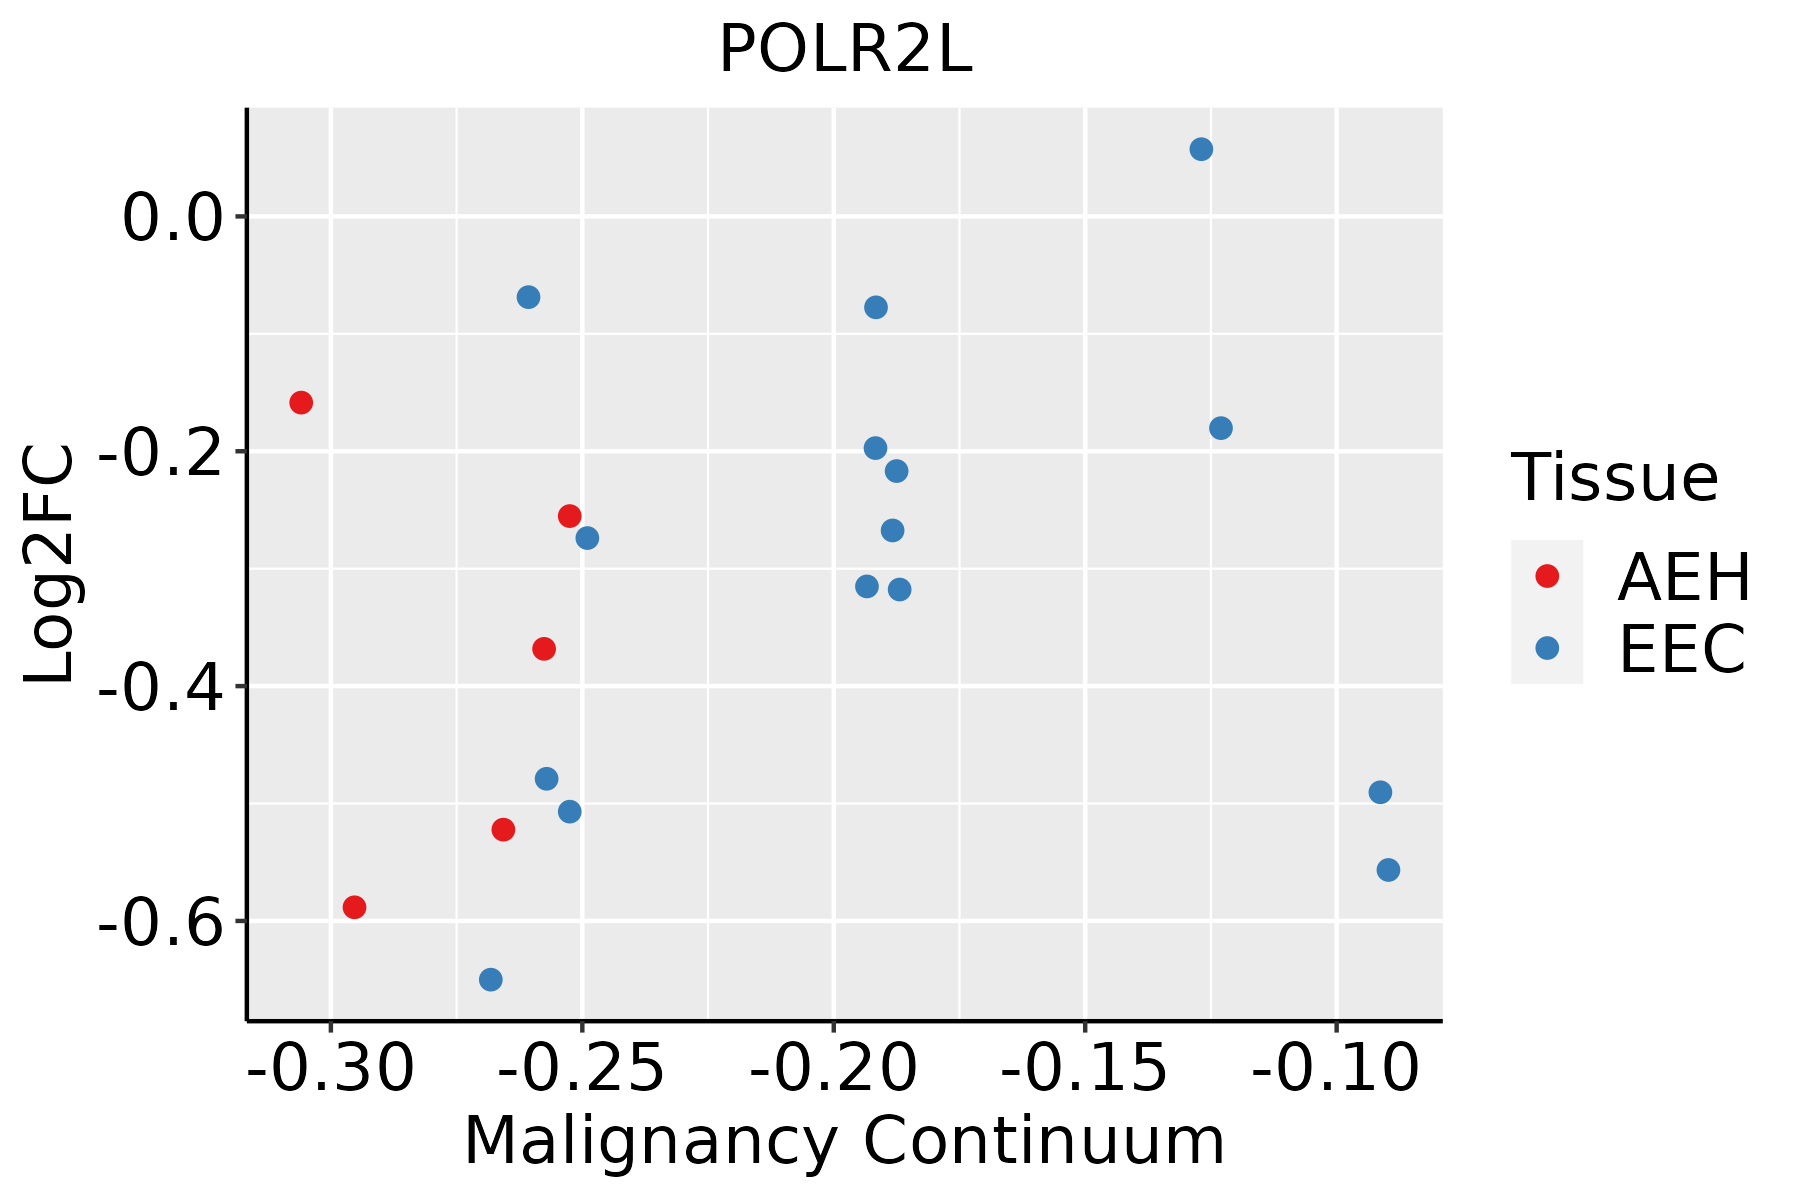 | AEH: Atypical endometrial hyperplasia |
| EEC: Endometrioid Cancer | ||
| Esophagus | 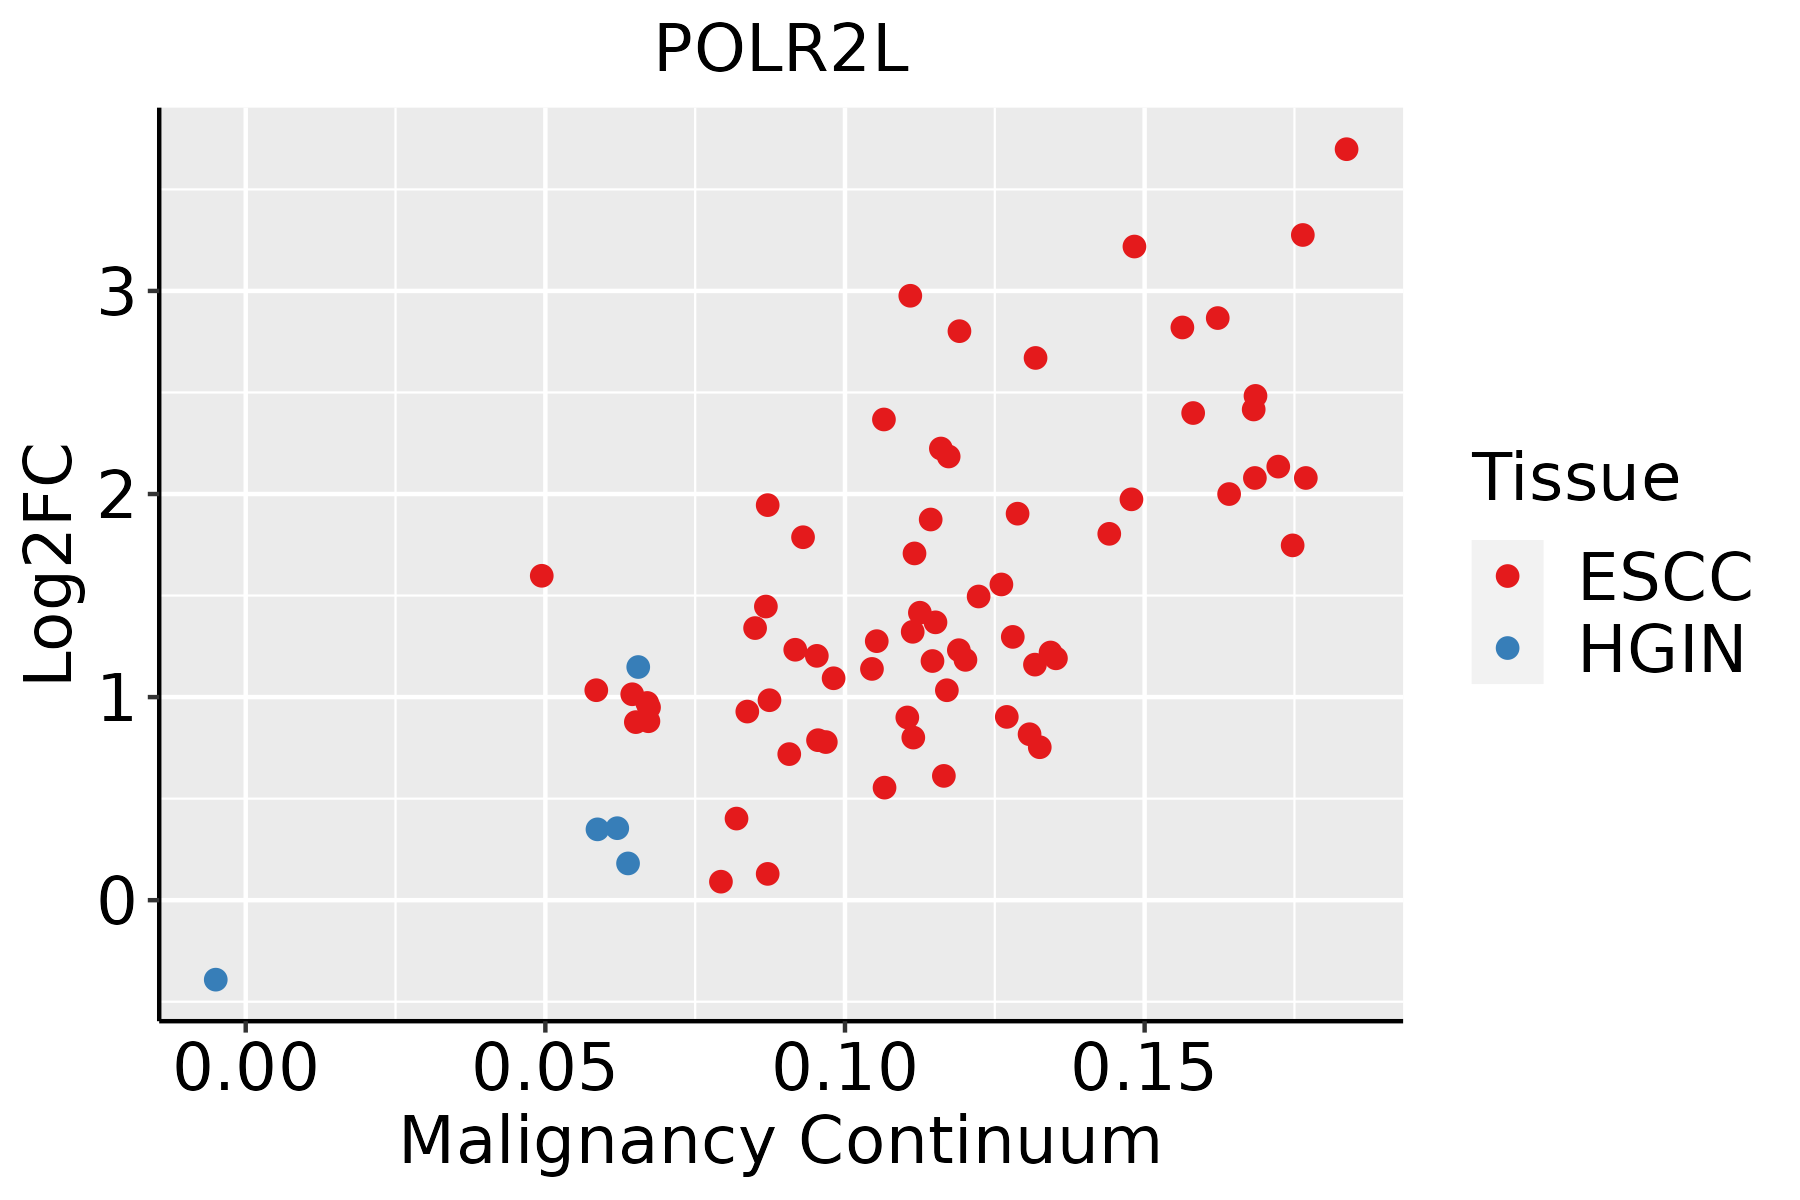 | ESCC: Esophageal squamous cell carcinoma |
| HGIN: High-grade intraepithelial neoplasias | ||
| LGIN: Low-grade intraepithelial neoplasias | ||
| GC |  | CAG: Chronic atrophic gastritis |
| CAG with IM: Chronic atrophic gastritis with intestinal metaplasia | ||
| CSG: Chronic superficial gastritis | ||
| GC: Gastric cancer | ||
| SIM: Severe intestinal metaplasia | ||
| WIM: Wild intestinal metaplasia | ||
| Liver |  | HCC: Hepatocellular carcinoma |
| NAFLD: Non-alcoholic fatty liver disease | ||
| Lung | 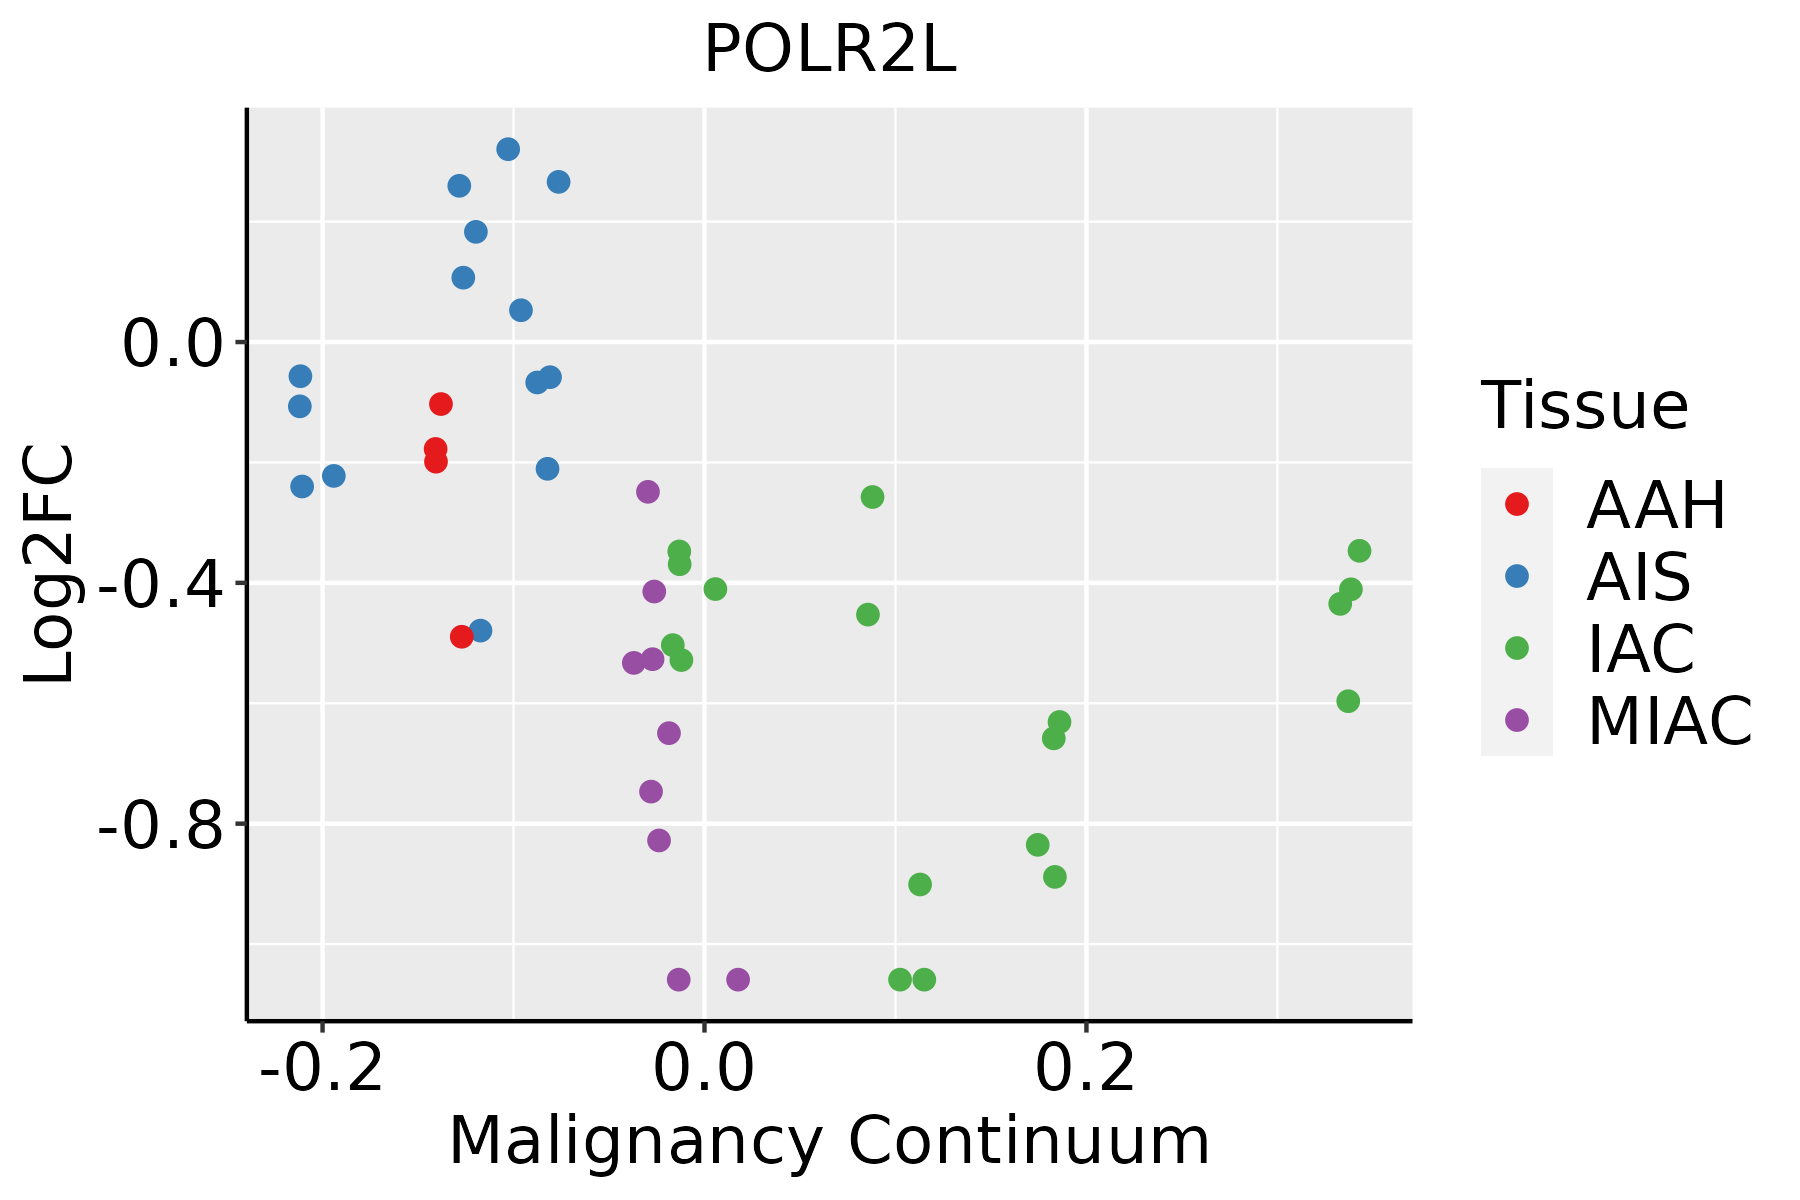 | AAH: Atypical adenomatous hyperplasia |
| AIS: Adenocarcinoma in situ | ||
| IAC: Invasive lung adenocarcinoma | ||
| MIA: Minimally invasive adenocarcinoma | ||
| Oral Cavity |  | EOLP: Erosive Oral lichen planus |
| LP: leukoplakia | ||
| NEOLP: Non-erosive oral lichen planus | ||
| OSCC: Oral squamous cell carcinoma | ||
| Prostate | 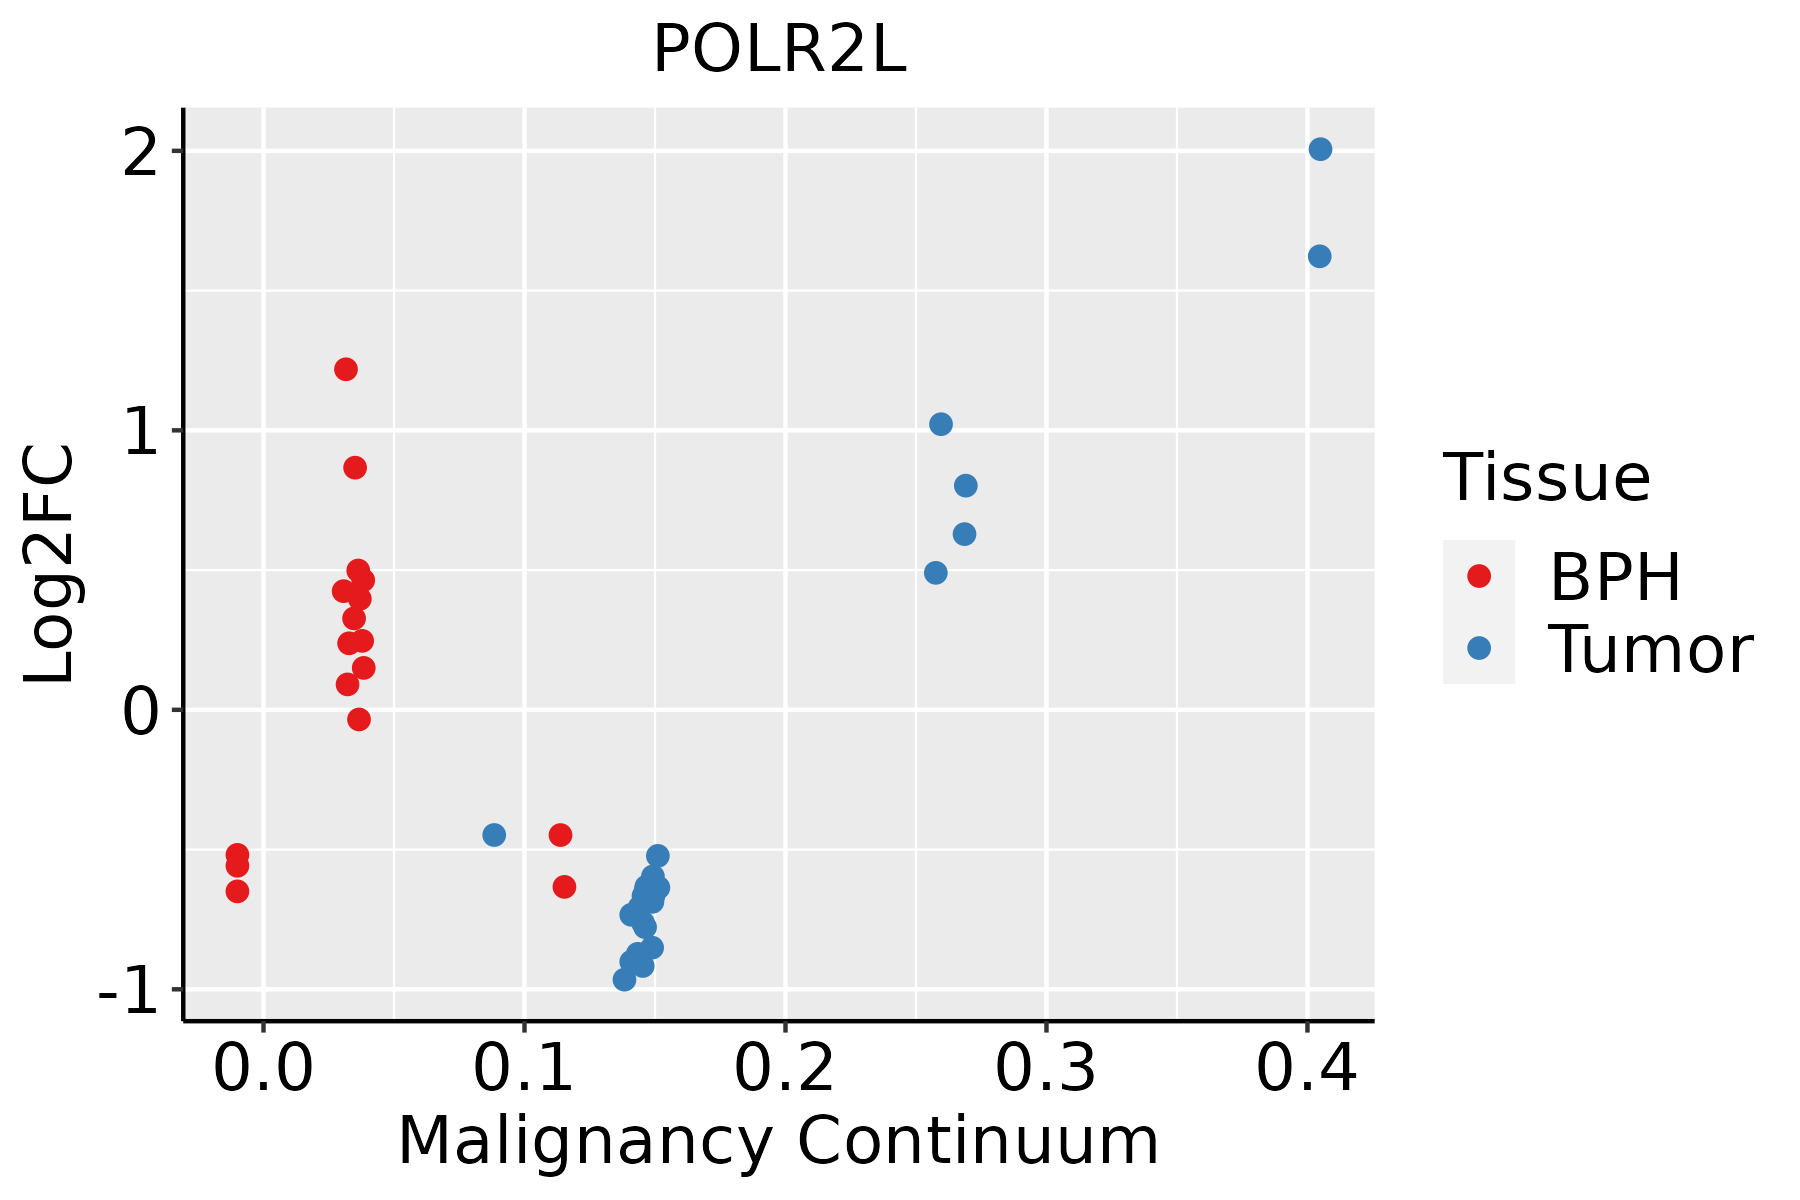 | BPH: Benign Prostatic Hyperplasia |
| Skin | 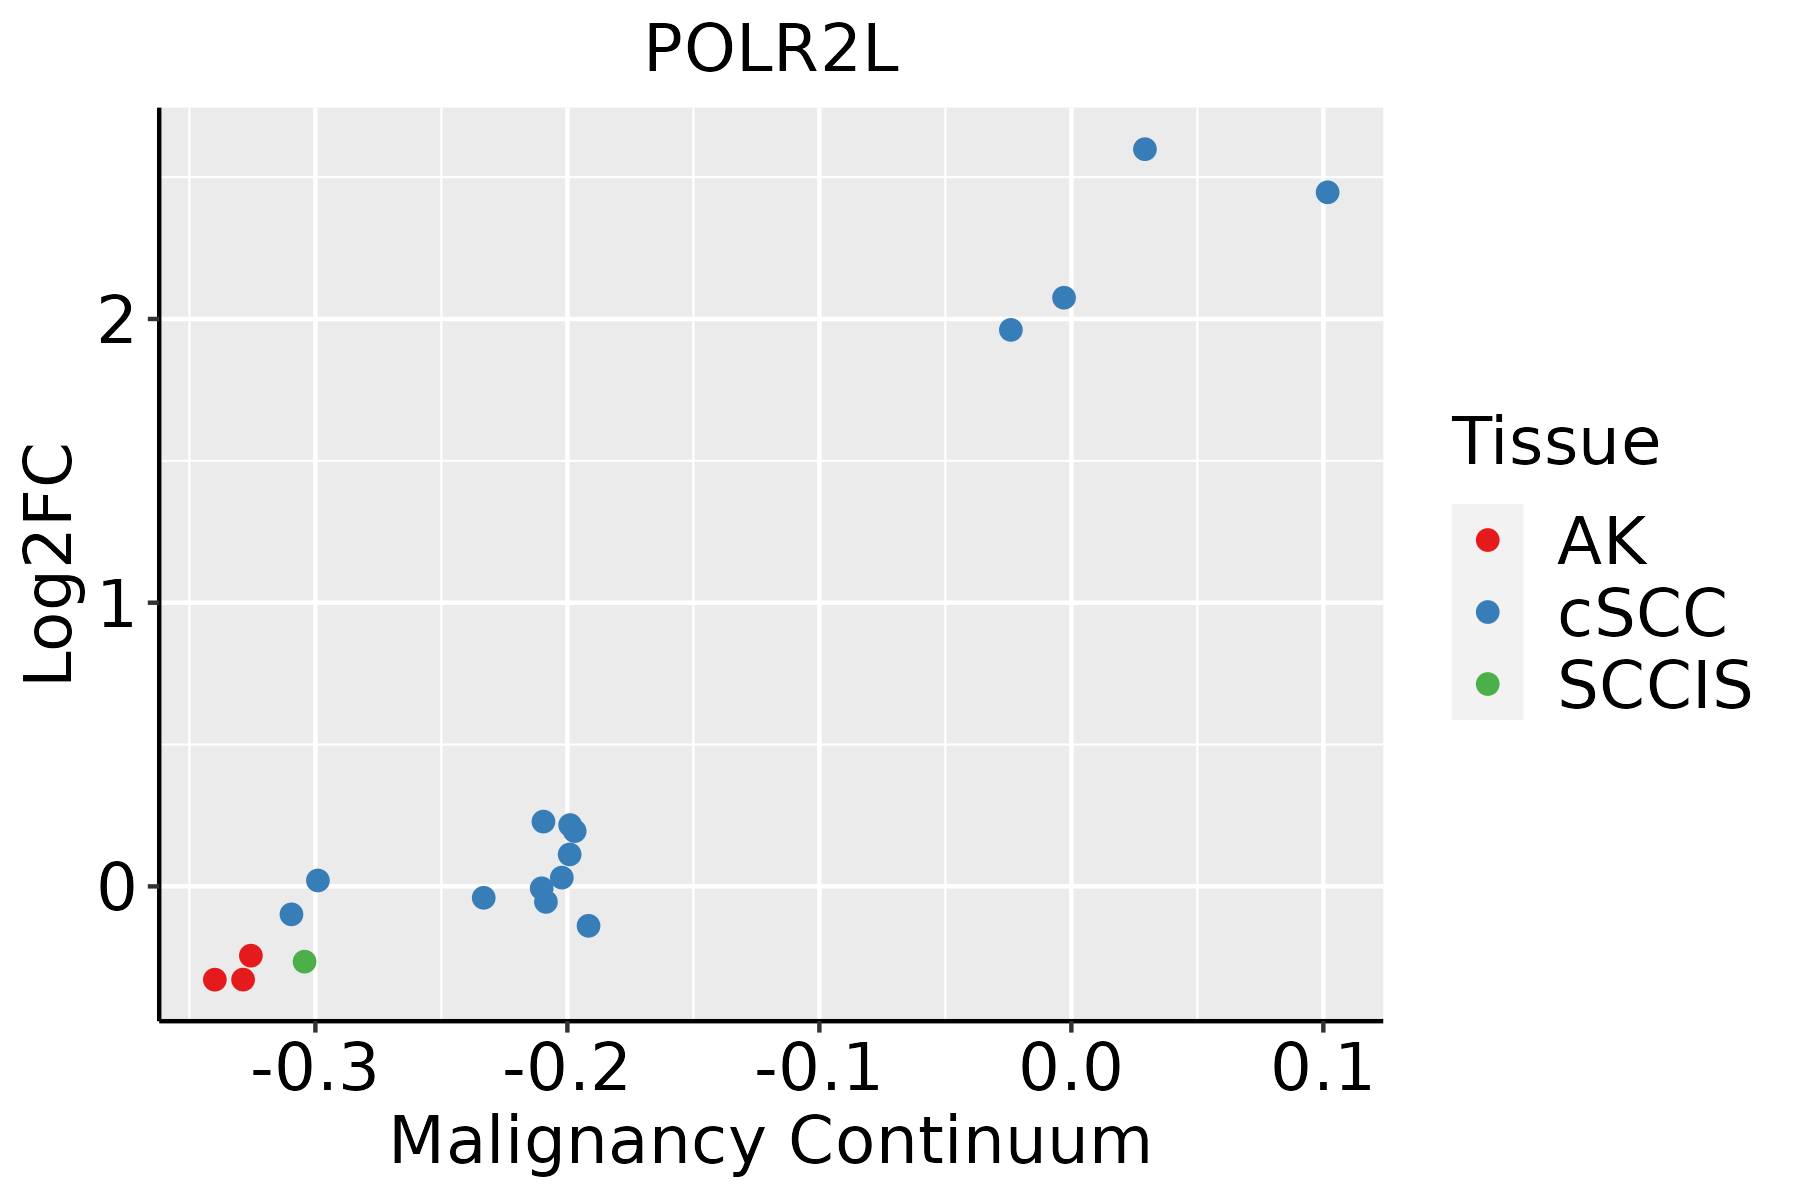 | AK: Actinic keratosis |
| cSCC: Cutaneous squamous cell carcinoma | ||
| SCCIS:squamous cell carcinoma in situ | ||
| Thyroid |  | ATC: Anaplastic thyroid cancer |
| HT: Hashimoto's thyroiditis | ||
| PTC: Papillary thyroid cancer |
| ∗log2FC in expression of this searched gene in stem-like cells from each diseased tissue sample relative to stem-like cells in normal samples in each tissue plotted against the malignancy continuum. Samples are colored based on if they are from different disease stage. |
Top |
Malignant transformation related pathway analysis |
| Find out the enriched GO biological processes and KEGG pathways involved in transition from healthy to precancer to cancer |
| Tissue | Disease Stage | Enriched GO biological Processes |
| Colorectum | AD |  |
| Colorectum | SER |  |
| Colorectum | MSS |  |
| Colorectum | MSI-H |  |
| Colorectum | FAP |  |
| ∗Top 15 enriched GO BP terms are showed in the bar plot of each disease state in each tissue. Each row represents a significant GO biological process which is colored according to the -log10(p.adjust). |
| Page: 1 2 3 4 5 6 7 8 9 |
| GO ID | Tissue | Disease Stage | Description | Gene Ratio | Bg Ratio | pvalue | p.adjust | Count |
| GO:00063833 | Esophagus | ESCC | transcription by RNA polymerase III | 41/8552 | 46/18723 | 7.69e-10 | 1.90e-08 | 41 |
| GO:00987812 | Esophagus | ESCC | ncRNA transcription | 45/8552 | 56/18723 | 1.05e-07 | 1.72e-06 | 45 |
| GO:00063602 | Esophagus | ESCC | transcription by RNA polymerase I | 42/8552 | 55/18723 | 3.41e-06 | 3.78e-05 | 42 |
| GO:00063564 | Esophagus | ESCC | regulation of transcription by RNA polymerase I | 27/8552 | 34/18723 | 6.01e-05 | 4.62e-04 | 27 |
| GO:0006360 | Liver | HCC | transcription by RNA polymerase I | 36/7958 | 55/18723 | 4.94e-04 | 3.23e-03 | 36 |
| GO:0006383 | Liver | HCC | transcription by RNA polymerase III | 31/7958 | 46/18723 | 5.67e-04 | 3.61e-03 | 31 |
| GO:0006356 | Liver | HCC | regulation of transcription by RNA polymerase I | 24/7958 | 34/18723 | 8.62e-04 | 5.13e-03 | 24 |
| GO:0098781 | Liver | HCC | ncRNA transcription | 33/7958 | 56/18723 | 9.64e-03 | 3.63e-02 | 33 |
| GO:00063832 | Oral cavity | OSCC | transcription by RNA polymerase III | 34/7305 | 46/18723 | 1.61e-06 | 2.11e-05 | 34 |
| GO:00987811 | Oral cavity | OSCC | ncRNA transcription | 38/7305 | 56/18723 | 1.15e-05 | 1.18e-04 | 38 |
| GO:00063563 | Oral cavity | OSCC | regulation of transcription by RNA polymerase I | 25/7305 | 34/18723 | 4.63e-05 | 3.90e-04 | 25 |
| GO:00063601 | Oral cavity | OSCC | transcription by RNA polymerase I | 36/7305 | 55/18723 | 6.42e-05 | 5.22e-04 | 36 |
| GO:00063831 | Oral cavity | LP | transcription by RNA polymerase III | 20/4623 | 46/18723 | 4.03e-03 | 2.61e-02 | 20 |
| GO:00063562 | Prostate | BPH | regulation of transcription by RNA polymerase I | 12/3107 | 34/18723 | 6.45e-03 | 2.91e-02 | 12 |
| GO:00063561 | Prostate | Tumor | regulation of transcription by RNA polymerase I | 13/3246 | 34/18723 | 3.09e-03 | 1.63e-02 | 13 |
| GO:00063565 | Skin | cSCC | regulation of transcription by RNA polymerase I | 22/4864 | 34/18723 | 2.33e-06 | 3.77e-05 | 22 |
| GO:00063603 | Skin | cSCC | transcription by RNA polymerase I | 30/4864 | 55/18723 | 6.13e-06 | 8.70e-05 | 30 |
| GO:00987813 | Skin | cSCC | ncRNA transcription | 28/4864 | 56/18723 | 9.93e-05 | 9.22e-04 | 28 |
| GO:00063834 | Skin | cSCC | transcription by RNA polymerase III | 20/4864 | 46/18723 | 7.44e-03 | 3.50e-02 | 20 |
| GO:00063566 | Thyroid | PTC | regulation of transcription by RNA polymerase I | 20/5968 | 34/18723 | 1.07e-03 | 6.32e-03 | 20 |
| Page: 1 2 |
| Pathway ID | Tissue | Disease Stage | Description | Gene Ratio | Bg Ratio | pvalue | p.adjust | qvalue | Count |
| hsa0501616 | Breast | Precancer | Huntington disease | 98/684 | 306/8465 | 2.85e-35 | 2.25e-33 | 1.72e-33 | 98 |
| hsa0501617 | Breast | Precancer | Huntington disease | 98/684 | 306/8465 | 2.85e-35 | 2.25e-33 | 1.72e-33 | 98 |
| hsa0501623 | Breast | IDC | Huntington disease | 103/867 | 306/8465 | 5.14e-30 | 4.17e-28 | 3.12e-28 | 103 |
| hsa0501633 | Breast | IDC | Huntington disease | 103/867 | 306/8465 | 5.14e-30 | 4.17e-28 | 3.12e-28 | 103 |
| hsa0501643 | Breast | DCIS | Huntington disease | 101/846 | 306/8465 | 1.54e-29 | 1.24e-27 | 9.13e-28 | 101 |
| hsa0501653 | Breast | DCIS | Huntington disease | 101/846 | 306/8465 | 1.54e-29 | 1.24e-27 | 9.13e-28 | 101 |
| hsa0501618 | Cervix | CC | Huntington disease | 94/1267 | 306/8465 | 8.49e-13 | 3.06e-11 | 1.81e-11 | 94 |
| hsa0501619 | Cervix | CC | Huntington disease | 94/1267 | 306/8465 | 8.49e-13 | 3.06e-11 | 1.81e-11 | 94 |
| hsa0501624 | Cervix | HSIL_HPV | Huntington disease | 38/459 | 306/8465 | 1.21e-06 | 2.54e-05 | 2.05e-05 | 38 |
| hsa0501634 | Cervix | HSIL_HPV | Huntington disease | 38/459 | 306/8465 | 1.21e-06 | 2.54e-05 | 2.05e-05 | 38 |
| hsa0501644 | Cervix | N_HPV | Huntington disease | 36/349 | 306/8465 | 9.73e-09 | 2.65e-07 | 2.07e-07 | 36 |
| hsa0501654 | Cervix | N_HPV | Huntington disease | 36/349 | 306/8465 | 9.73e-09 | 2.65e-07 | 2.07e-07 | 36 |
| hsa05016 | Colorectum | AD | Huntington disease | 147/2092 | 306/8465 | 1.93e-19 | 9.26e-18 | 5.91e-18 | 147 |
| hsa050161 | Colorectum | AD | Huntington disease | 147/2092 | 306/8465 | 1.93e-19 | 9.26e-18 | 5.91e-18 | 147 |
| hsa050162 | Colorectum | SER | Huntington disease | 127/1580 | 306/8465 | 3.29e-21 | 1.37e-19 | 9.92e-20 | 127 |
| hsa050163 | Colorectum | SER | Huntington disease | 127/1580 | 306/8465 | 3.29e-21 | 1.37e-19 | 9.92e-20 | 127 |
| hsa050164 | Colorectum | MSS | Huntington disease | 141/1875 | 306/8465 | 2.90e-21 | 1.62e-19 | 9.92e-20 | 141 |
| hsa050165 | Colorectum | MSS | Huntington disease | 141/1875 | 306/8465 | 2.90e-21 | 1.62e-19 | 9.92e-20 | 141 |
| hsa050166 | Colorectum | MSI-H | Huntington disease | 83/797 | 306/8465 | 7.06e-20 | 3.81e-18 | 3.20e-18 | 83 |
| hsa050167 | Colorectum | MSI-H | Huntington disease | 83/797 | 306/8465 | 7.06e-20 | 3.81e-18 | 3.20e-18 | 83 |
| Page: 1 2 3 4 |
Top |
Cell-cell communication analysis |
| Identification of potential cell-cell interactions between two cell types and their ligand-receptor pairs for different disease states |
| Ligand | Receptor | LRpair | Pathway | Tissue | Disease Stage |
| Page: 1 |
Top |
Single-cell gene regulatory network inference analysis |
| Find out the significant the regulons (TFs) and the target genes of each regulon across cell types for different disease states |
| TF | Cell Type | Tissue | Disease Stage | Target Gene | RSS | Regulon Activity |
| ∗The dot plots of a searched regulon are shown for all cell subpopulations in each disease state of each tissue based on the regulon specific score inferred using pySCENIC and by calculating the average expression. |
| Page: 1 |
Top |
Somatic mutation of malignant transformation related genes |
| Annotation of somatic variants for genes involved in malignant transformation |
| Hugo Symbol | Variant Class | Variant Classification | dbSNP RS | HGVSc | HGVSp | HGVSp Short | SWISSPROT | BIOTYPE | SIFT | PolyPhen | Tumor Sample Barcode | Tissue | Histology | Sex | Age | Stage | Therapy Types | Drugs | Outcome |
| POLR2L | SNV | Missense_Mutation | novel | c.185A>T | p.Tyr62Phe | p.Y62F | P62875 | protein_coding | tolerated(0.1) | benign(0.033) | TCGA-B6-A0I1-01 | Breast | breast invasive carcinoma | Female | >=65 | I/II | Unknown | Unknown | PD |
| POLR2L | SNV | Missense_Mutation | c.91N>C | p.Glu31Gln | p.E31Q | P62875 | protein_coding | deleterious(0.05) | benign(0.318) | TCGA-FU-A2QG-01 | Cervix | cervical & endocervical cancer | Female | <65 | I/II | Unknown | Unknown | SD | |
| POLR2L | SNV | Missense_Mutation | novel | c.6N>G | p.Ile2Met | p.I2M | P62875 | protein_coding | tolerated(0.05) | possibly_damaging(0.734) | TCGA-VS-A94X-01 | Cervix | cervical & endocervical cancer | Female | <65 | I/II | Chemotherapy | cisplatin | PD |
| POLR2L | SNV | Missense_Mutation | novel | c.85N>C | p.Tyr29His | p.Y29H | P62875 | protein_coding | tolerated(0.36) | benign(0.035) | TCGA-EY-A1GQ-01 | Endometrium | uterine corpus endometrioid carcinoma | Female | >=65 | I/II | Chemotherapy | taxol | SD |
| POLR2L | SNV | Missense_Mutation | c.82N>A | p.Glu28Lys | p.E28K | P62875 | protein_coding | tolerated(0.35) | benign(0.005) | TCGA-98-8021-01 | Lung | lung squamous cell carcinoma | Female | >=65 | I/II | Unknown | Unknown | PD | |
| POLR2L | insertion | Frame_Shift_Ins | novel | c.2_3insTTTGAGACCAGCCTGG | p.Met1? | p.M1? | P62875 | protein_coding | TCGA-79-5596-01 | Lung | lung squamous cell carcinoma | Male | Unknown | III/IV | Unknown | Unknown | SD | ||
| POLR2L | SNV | Missense_Mutation | novel | c.110N>A | p.Ala37Asp | p.A37D | P62875 | protein_coding | tolerated(0.32) | benign(0.012) | TCGA-CR-6493-01 | Oral cavity | head & neck squamous cell carcinoma | Male | >=65 | I/II | Chemotherapy | paclitaxel | PD |
| POLR2L | SNV | Missense_Mutation | novel | c.196N>C | p.Glu66Gln | p.E66Q | P62875 | protein_coding | deleterious(0.04) | benign(0.127) | TCGA-HD-A4C1-01 | Oral cavity | head & neck squamous cell carcinoma | Female | <65 | I/II | Unknown | Unknown | SD |
| POLR2L | SNV | Missense_Mutation | c.91N>C | p.Glu31Gln | p.E31Q | P62875 | protein_coding | deleterious(0.05) | benign(0.318) | TCGA-P3-A5Q5-01 | Oral cavity | head & neck squamous cell carcinoma | Male | <65 | I/II | Unknown | Unknown | SD |
| Page: 1 |
Top |
Related drugs of malignant transformation related genes |
| Identification of chemicals and drugs interact with genes involved in malignant transfromation |
| (DGIdb 4.0) |
| Entrez ID | Symbol | Category | Interaction Types | Drug Claim Name | Drug Name | PMIDs |
| Page: 1 |

Copyright 2023-Present -The University of Texas Health Science Center at Houston |