
|
|||||
|
 | |
| |
| |
| |
| |
| |
|
Gene: POLR2K |
Gene summary for POLR2K |
| Gene information | Species | Human | Gene symbol | POLR2K | Gene ID | 5440 |
| Gene name | RNA polymerase II, I and III subunit K | |
| Gene Alias | ABC10-alpha | |
| Cytomap | 8q22.2 | |
| Gene Type | protein-coding | GO ID | GO:0006139 | UniProtAcc | A0A024R9G0 |
Top |
Malignant transformation analysis |
| Identification of the aberrant gene expression in precancerous and cancerous lesions by comparing the gene expression of stem-like cells in diseased tissues with normal stem cells |
| Entrez ID | Symbol | Replicates | Species | Organ | Tissue | Adj P-value | Log2FC | Malignancy |
| 5440 | POLR2K | GSM4909280 | Human | Breast | Precancer | 1.25e-02 | -1.87e-01 | 0.0305 |
| 5440 | POLR2K | GSM4909281 | Human | Breast | IDC | 2.42e-72 | 9.85e-01 | 0.21 |
| 5440 | POLR2K | GSM4909282 | Human | Breast | IDC | 9.77e-12 | 4.21e-01 | -0.0288 |
| 5440 | POLR2K | GSM4909285 | Human | Breast | IDC | 4.83e-06 | 2.83e-01 | 0.21 |
| 5440 | POLR2K | GSM4909286 | Human | Breast | IDC | 1.12e-02 | 2.31e-01 | 0.1081 |
| 5440 | POLR2K | GSM4909287 | Human | Breast | IDC | 9.63e-24 | 6.55e-01 | 0.2057 |
| 5440 | POLR2K | GSM4909288 | Human | Breast | IDC | 2.45e-05 | 7.04e-02 | 0.0988 |
| 5440 | POLR2K | GSM4909290 | Human | Breast | IDC | 2.64e-50 | 9.79e-01 | 0.2096 |
| 5440 | POLR2K | GSM4909291 | Human | Breast | IDC | 1.67e-14 | 5.99e-01 | 0.1753 |
| 5440 | POLR2K | GSM4909293 | Human | Breast | IDC | 2.82e-03 | 2.35e-01 | 0.1581 |
| 5440 | POLR2K | GSM4909294 | Human | Breast | IDC | 9.53e-12 | 4.47e-01 | 0.2022 |
| 5440 | POLR2K | GSM4909295 | Human | Breast | IDC | 1.32e-08 | 5.43e-01 | 0.0898 |
| 5440 | POLR2K | GSM4909296 | Human | Breast | IDC | 3.07e-08 | 2.88e-02 | 0.1524 |
| 5440 | POLR2K | GSM4909297 | Human | Breast | IDC | 1.48e-16 | 1.92e-01 | 0.1517 |
| 5440 | POLR2K | GSM4909298 | Human | Breast | IDC | 1.87e-21 | 5.55e-01 | 0.1551 |
| 5440 | POLR2K | GSM4909301 | Human | Breast | IDC | 1.76e-03 | 1.70e-01 | 0.1577 |
| 5440 | POLR2K | GSM4909304 | Human | Breast | IDC | 3.63e-32 | 6.03e-01 | 0.1636 |
| 5440 | POLR2K | GSM4909305 | Human | Breast | IDC | 4.35e-03 | 3.53e-01 | 0.0436 |
| 5440 | POLR2K | GSM4909306 | Human | Breast | IDC | 5.67e-22 | 5.35e-01 | 0.1564 |
| 5440 | POLR2K | GSM4909308 | Human | Breast | IDC | 7.29e-09 | 4.16e-01 | 0.158 |
| Page: 1 2 3 4 5 6 7 8 9 10 11 |
| Tissue | Expression Dynamics | Abbreviation |
| Breast | 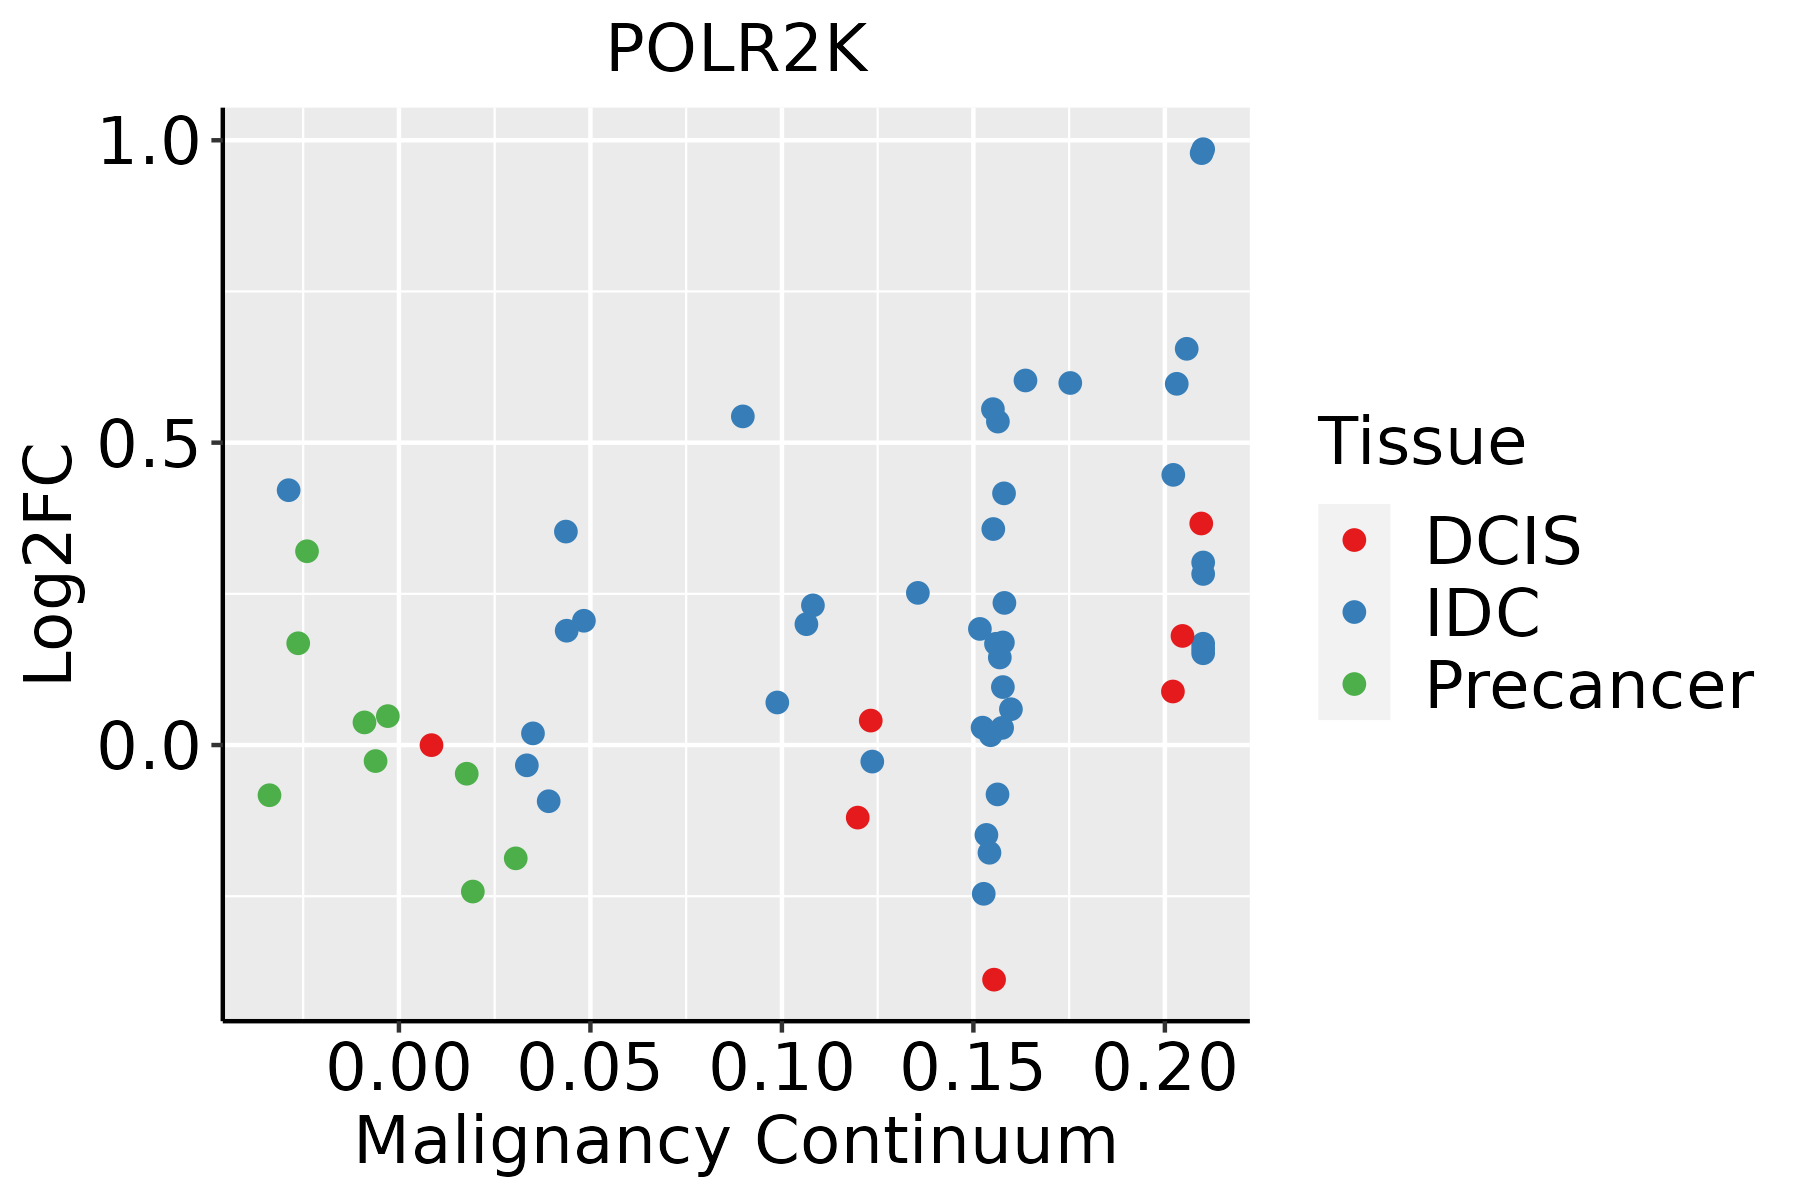 | IDC: Invasive ductal carcinoma |
| DCIS: Ductal carcinoma in situ | ||
| Precancer(BRCA1-mut): Precancerous lesion from BRCA1 mutation carriers | ||
| Endometrium | 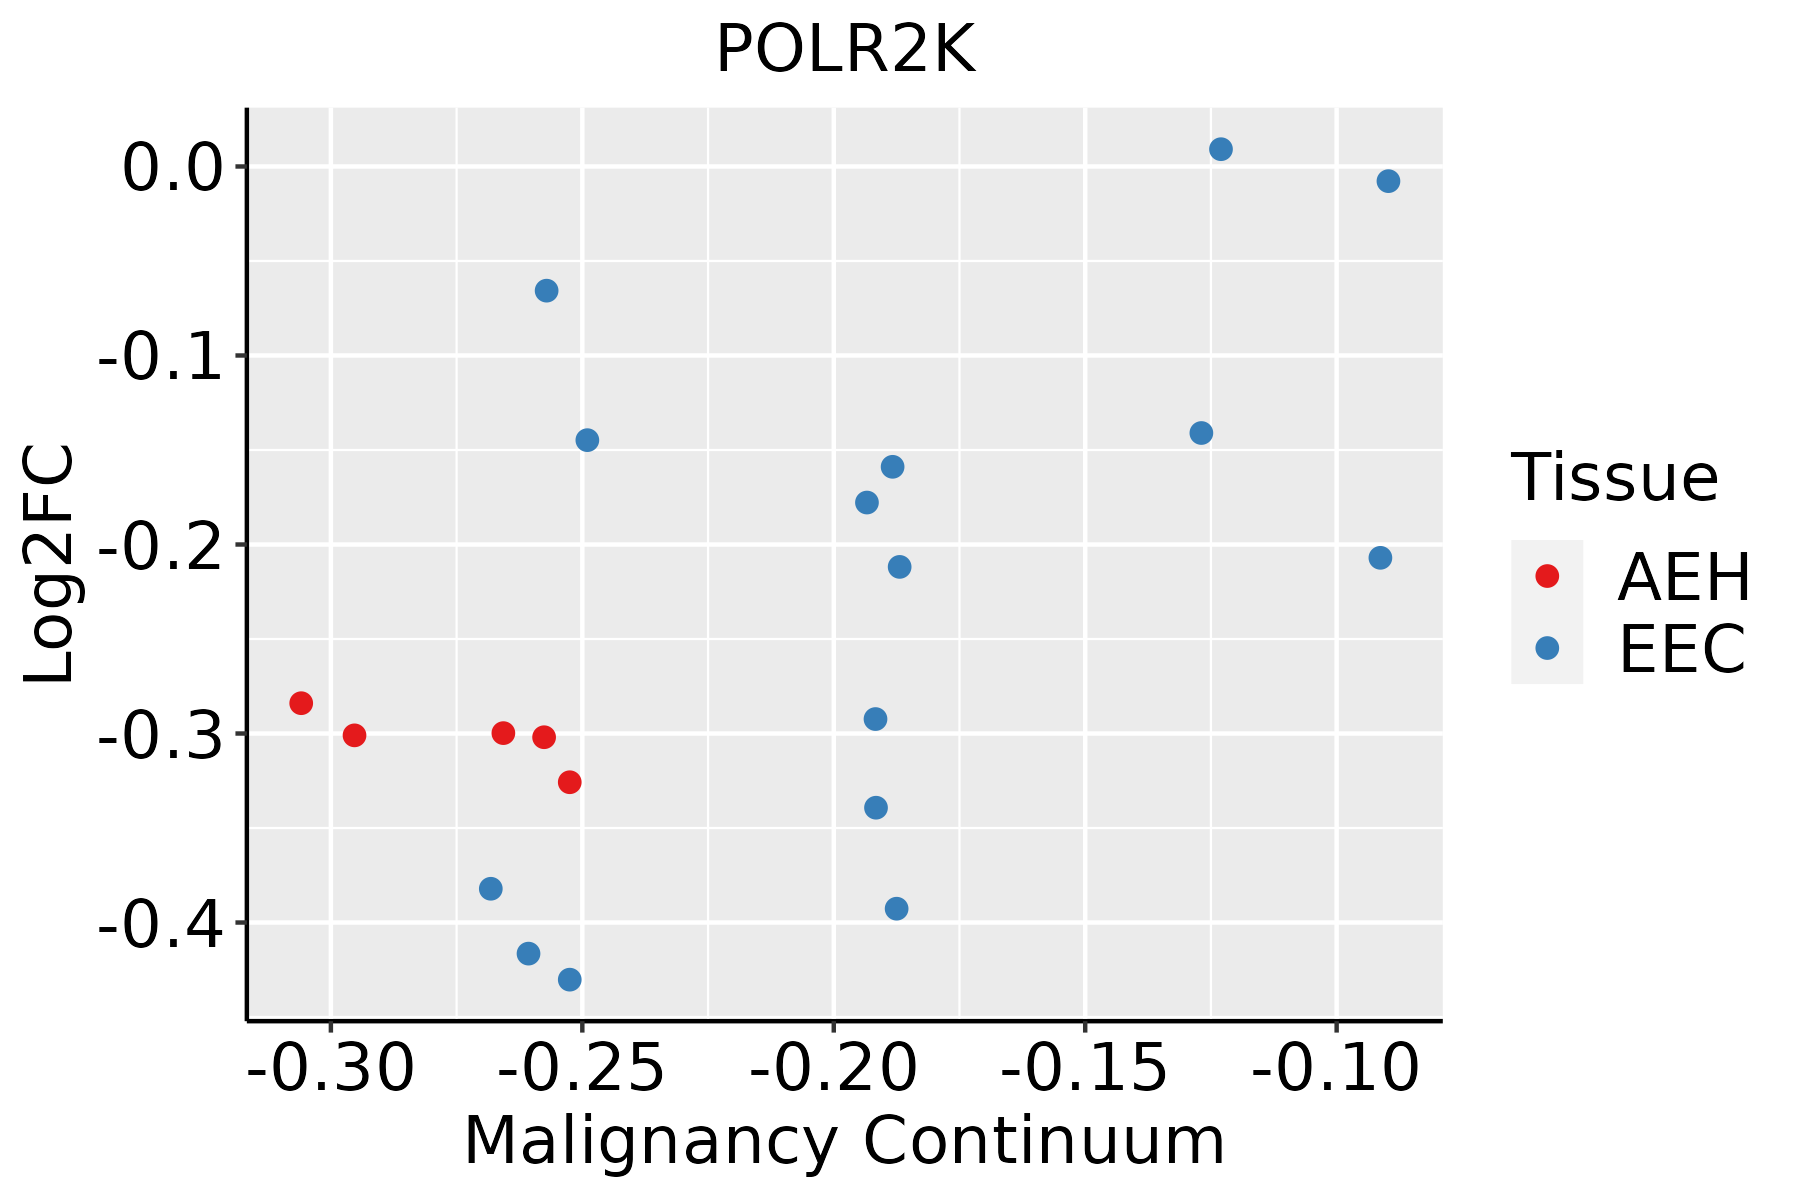 | AEH: Atypical endometrial hyperplasia |
| EEC: Endometrioid Cancer | ||
| Esophagus | 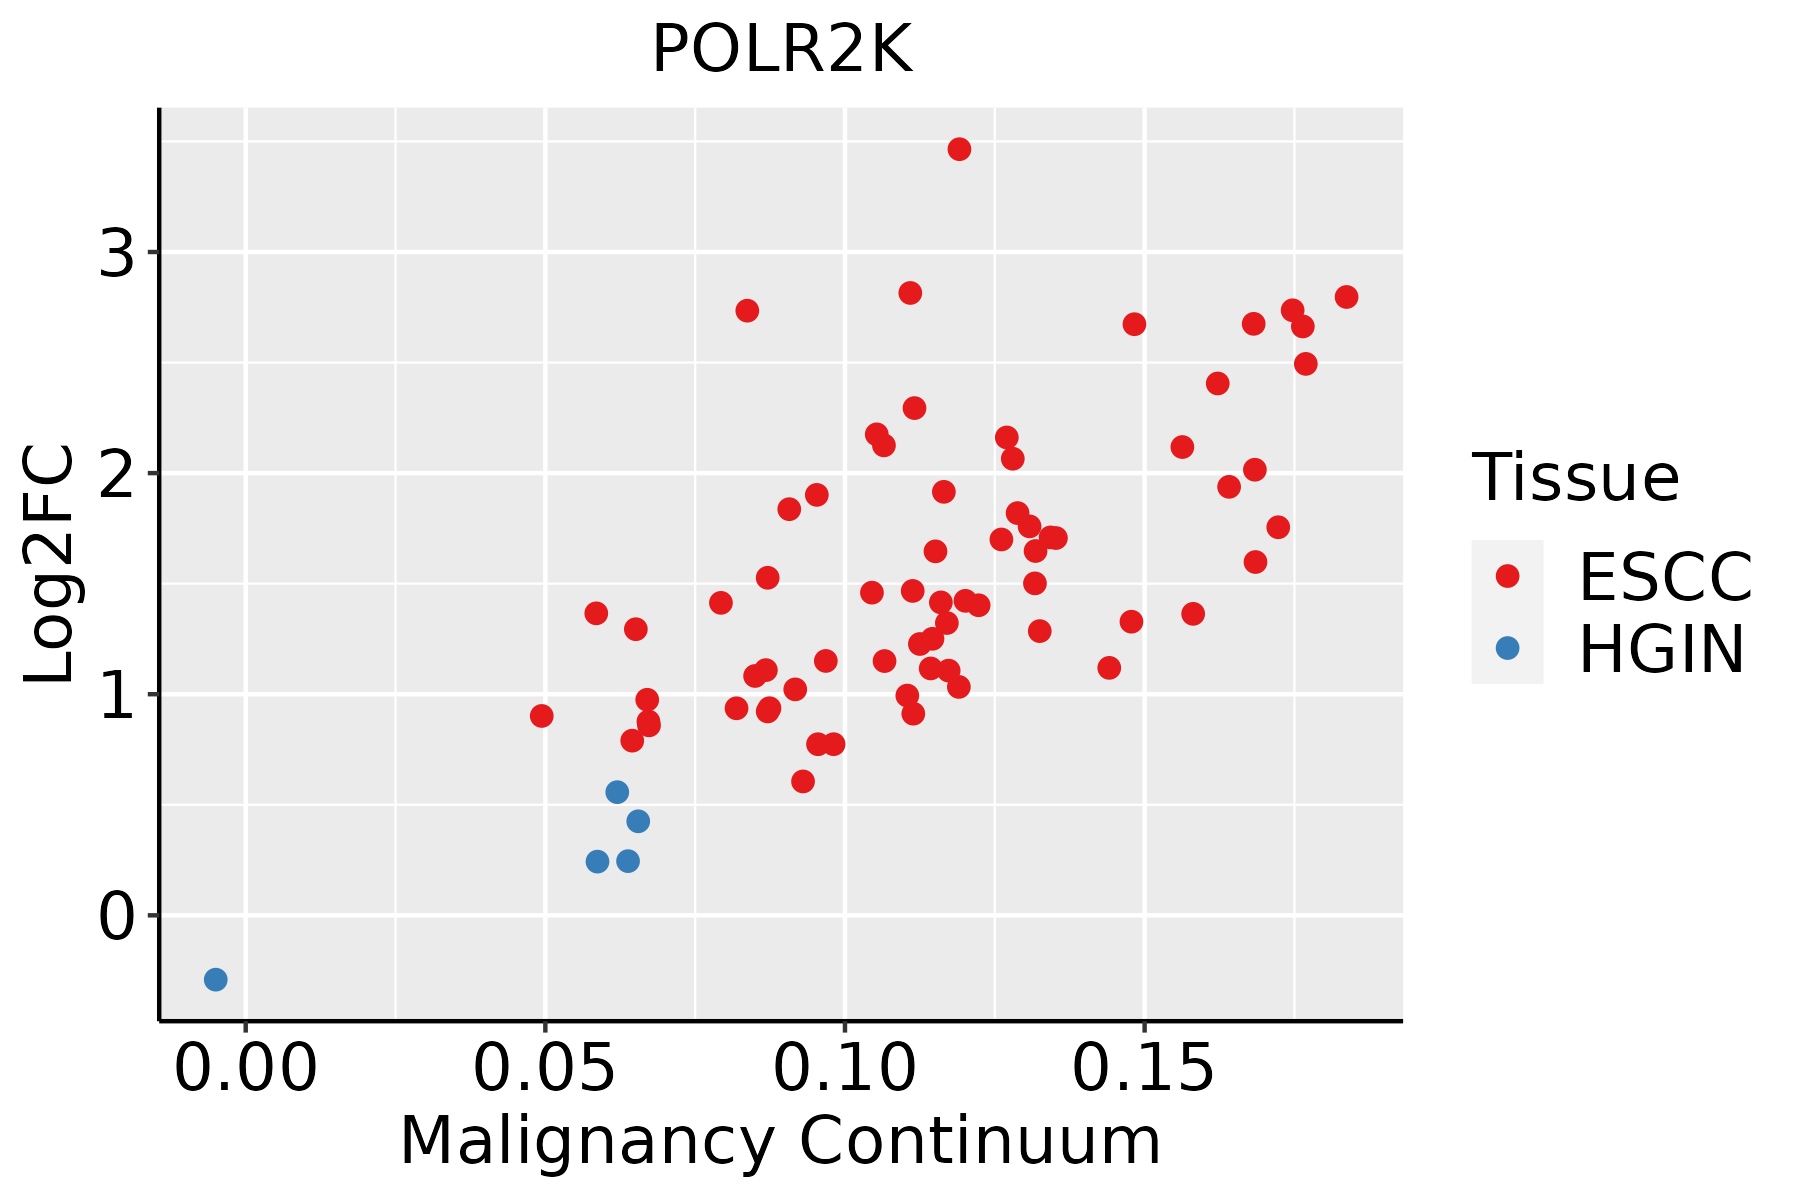 | ESCC: Esophageal squamous cell carcinoma |
| HGIN: High-grade intraepithelial neoplasias | ||
| LGIN: Low-grade intraepithelial neoplasias | ||
| Liver |  | HCC: Hepatocellular carcinoma |
| NAFLD: Non-alcoholic fatty liver disease | ||
| Oral Cavity | 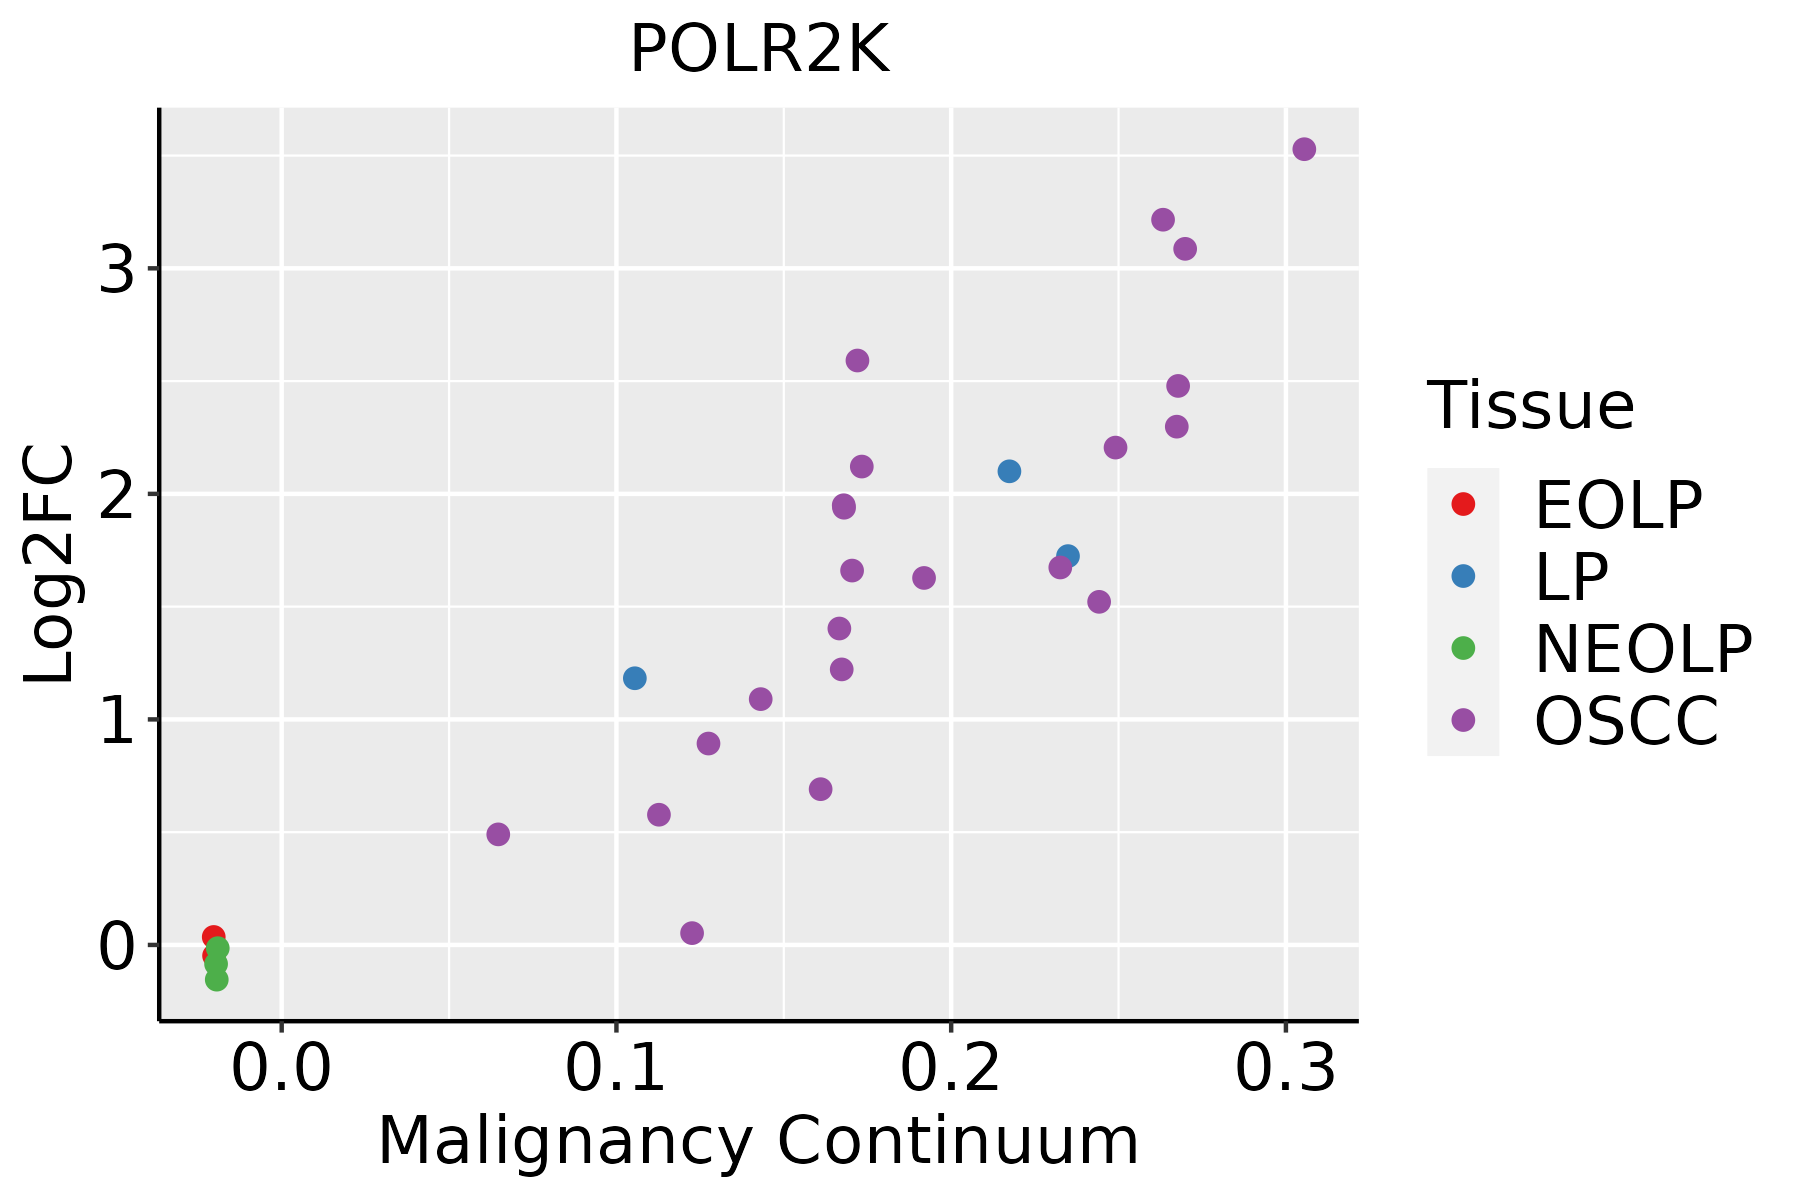 | EOLP: Erosive Oral lichen planus |
| LP: leukoplakia | ||
| NEOLP: Non-erosive oral lichen planus | ||
| OSCC: Oral squamous cell carcinoma | ||
| Prostate | 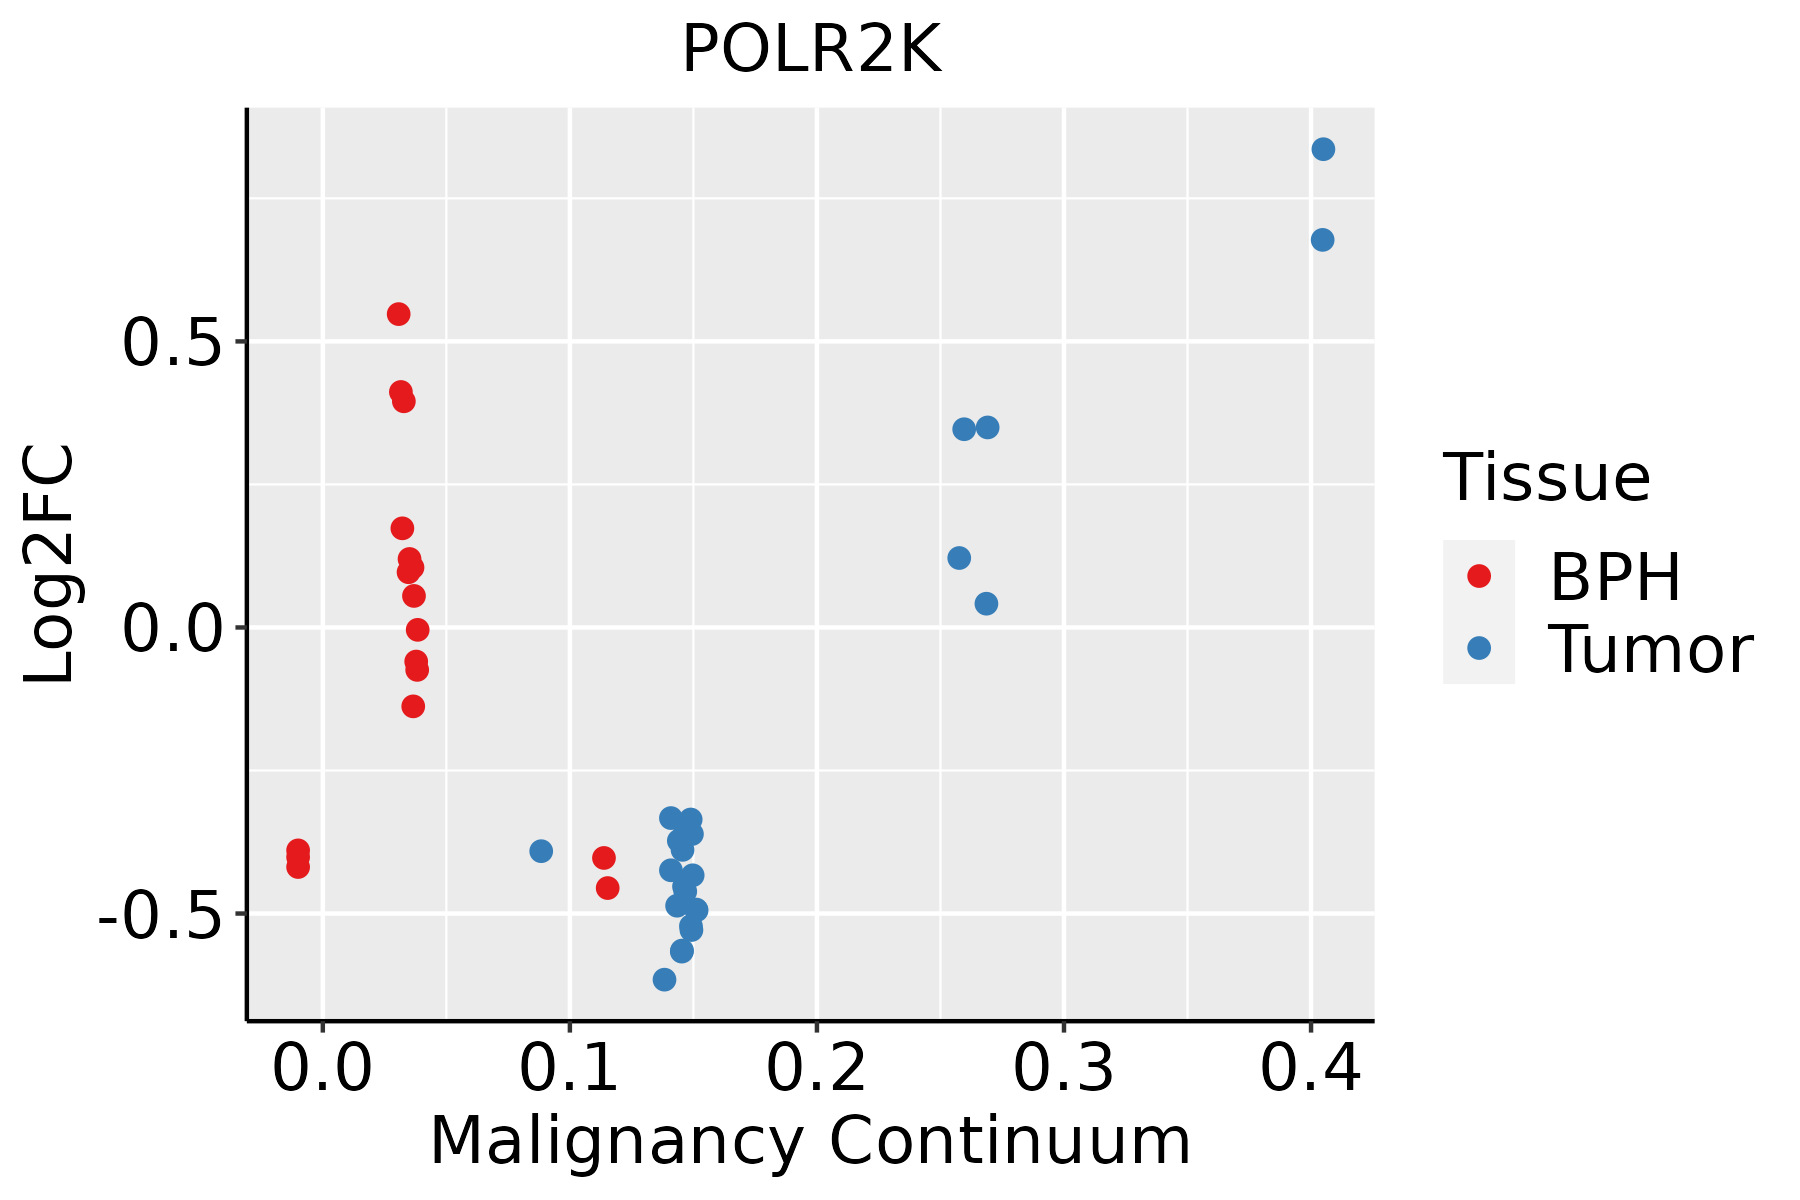 | BPH: Benign Prostatic Hyperplasia |
| Skin | 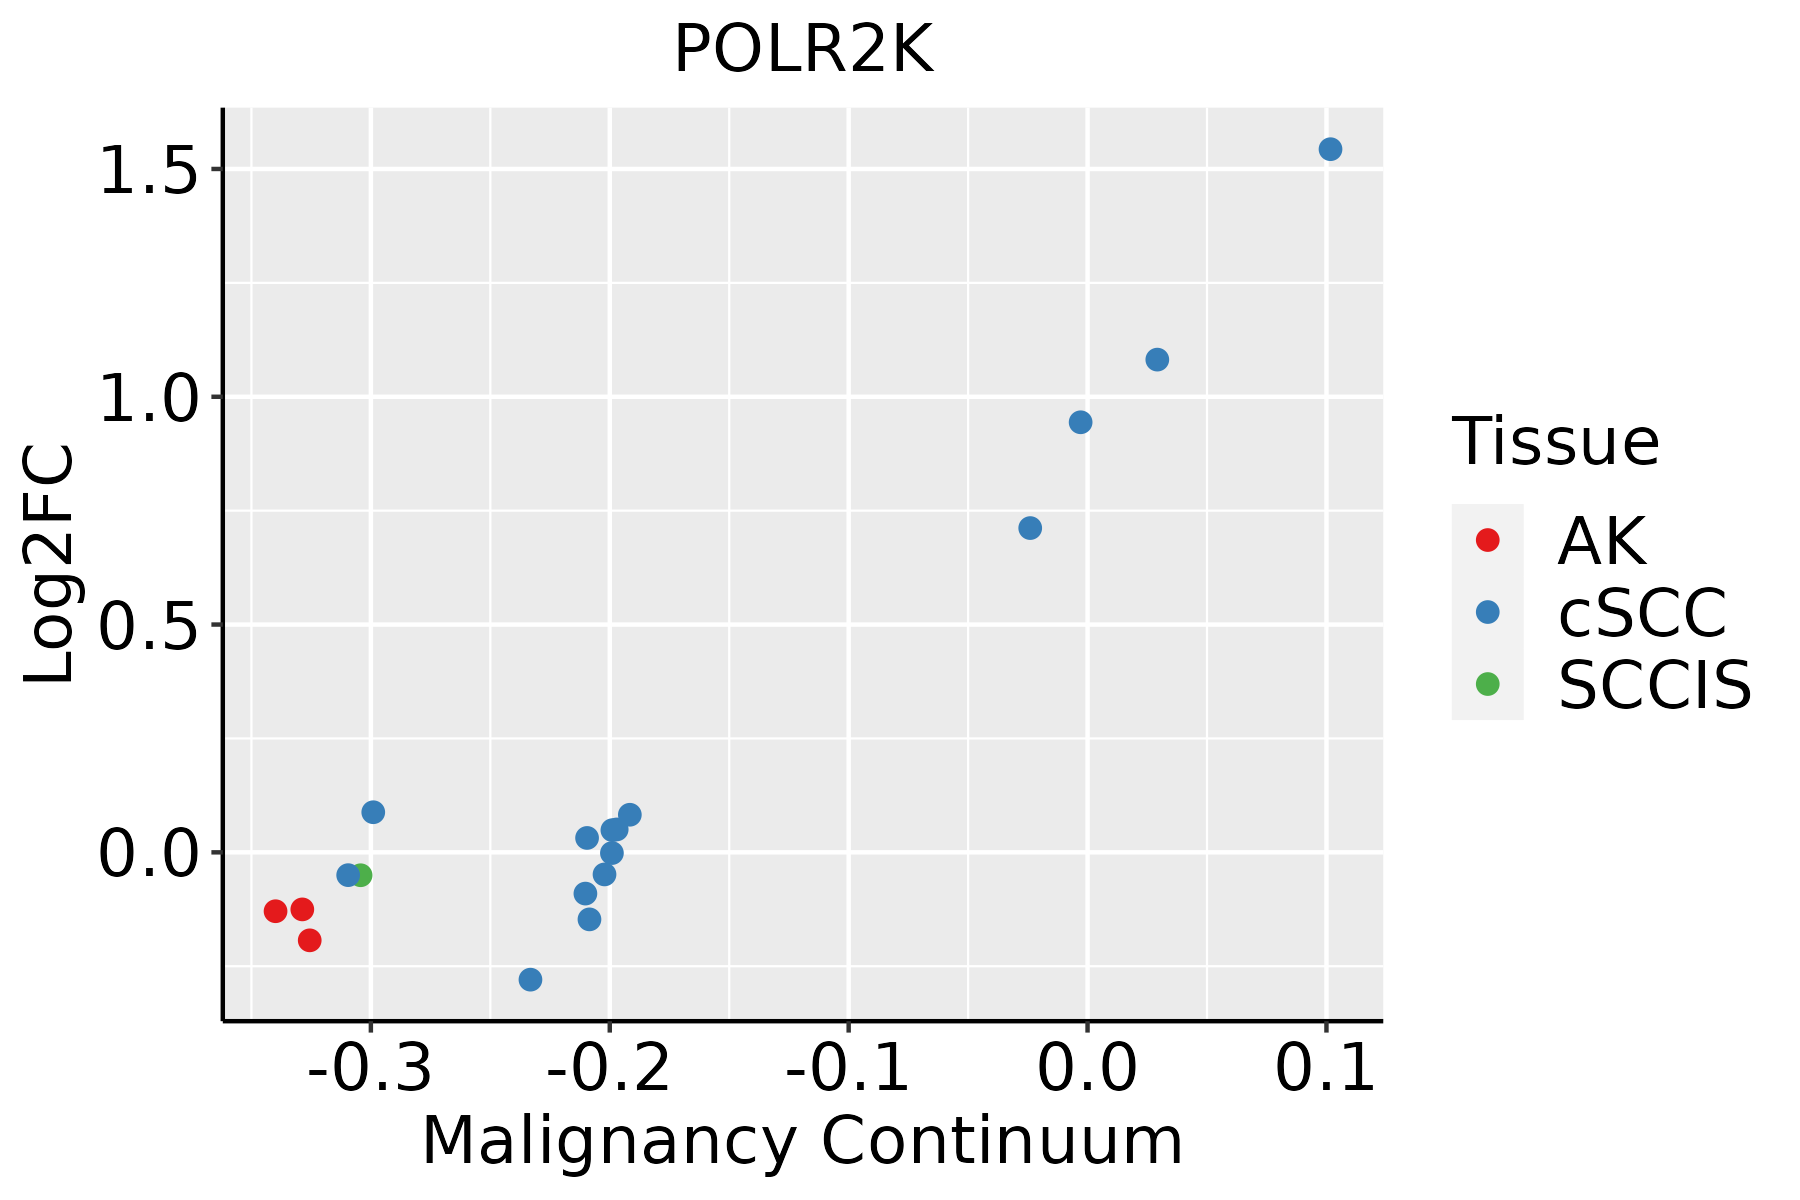 | AK: Actinic keratosis |
| cSCC: Cutaneous squamous cell carcinoma | ||
| SCCIS:squamous cell carcinoma in situ | ||
| Thyroid |  | ATC: Anaplastic thyroid cancer |
| HT: Hashimoto's thyroiditis | ||
| PTC: Papillary thyroid cancer |
| ∗log2FC in expression of this searched gene in stem-like cells from each diseased tissue sample relative to stem-like cells in normal samples in each tissue plotted against the malignancy continuum. Samples are colored based on if they are from different disease stage. |
Top |
Malignant transformation related pathway analysis |
| Find out the enriched GO biological processes and KEGG pathways involved in transition from healthy to precancer to cancer |
| Tissue | Disease Stage | Enriched GO biological Processes |
| Colorectum | AD |  |
| Colorectum | SER |  |
| Colorectum | MSS |  |
| Colorectum | MSI-H |  |
| Colorectum | FAP |  |
| ∗Top 15 enriched GO BP terms are showed in the bar plot of each disease state in each tissue. Each row represents a significant GO biological process which is colored according to the -log10(p.adjust). |
| Page: 1 2 3 4 5 6 7 8 9 |
| GO ID | Tissue | Disease Stage | Description | Gene Ratio | Bg Ratio | pvalue | p.adjust | Count |
| GO:00063833 | Esophagus | ESCC | transcription by RNA polymerase III | 41/8552 | 46/18723 | 7.69e-10 | 1.90e-08 | 41 |
| GO:00063602 | Esophagus | ESCC | transcription by RNA polymerase I | 42/8552 | 55/18723 | 3.41e-06 | 3.78e-05 | 42 |
| GO:00063564 | Esophagus | ESCC | regulation of transcription by RNA polymerase I | 27/8552 | 34/18723 | 6.01e-05 | 4.62e-04 | 27 |
| GO:0006360 | Liver | HCC | transcription by RNA polymerase I | 36/7958 | 55/18723 | 4.94e-04 | 3.23e-03 | 36 |
| GO:0006383 | Liver | HCC | transcription by RNA polymerase III | 31/7958 | 46/18723 | 5.67e-04 | 3.61e-03 | 31 |
| GO:0006356 | Liver | HCC | regulation of transcription by RNA polymerase I | 24/7958 | 34/18723 | 8.62e-04 | 5.13e-03 | 24 |
| GO:00063832 | Oral cavity | OSCC | transcription by RNA polymerase III | 34/7305 | 46/18723 | 1.61e-06 | 2.11e-05 | 34 |
| GO:00063563 | Oral cavity | OSCC | regulation of transcription by RNA polymerase I | 25/7305 | 34/18723 | 4.63e-05 | 3.90e-04 | 25 |
| GO:00063601 | Oral cavity | OSCC | transcription by RNA polymerase I | 36/7305 | 55/18723 | 6.42e-05 | 5.22e-04 | 36 |
| GO:00063831 | Oral cavity | LP | transcription by RNA polymerase III | 20/4623 | 46/18723 | 4.03e-03 | 2.61e-02 | 20 |
| GO:00063562 | Prostate | BPH | regulation of transcription by RNA polymerase I | 12/3107 | 34/18723 | 6.45e-03 | 2.91e-02 | 12 |
| GO:00063561 | Prostate | Tumor | regulation of transcription by RNA polymerase I | 13/3246 | 34/18723 | 3.09e-03 | 1.63e-02 | 13 |
| GO:00063565 | Skin | cSCC | regulation of transcription by RNA polymerase I | 22/4864 | 34/18723 | 2.33e-06 | 3.77e-05 | 22 |
| GO:00063603 | Skin | cSCC | transcription by RNA polymerase I | 30/4864 | 55/18723 | 6.13e-06 | 8.70e-05 | 30 |
| GO:00063834 | Skin | cSCC | transcription by RNA polymerase III | 20/4864 | 46/18723 | 7.44e-03 | 3.50e-02 | 20 |
| GO:00063566 | Thyroid | PTC | regulation of transcription by RNA polymerase I | 20/5968 | 34/18723 | 1.07e-03 | 6.32e-03 | 20 |
| GO:00063604 | Thyroid | PTC | transcription by RNA polymerase I | 28/5968 | 55/18723 | 2.55e-03 | 1.31e-02 | 28 |
| GO:00063835 | Thyroid | PTC | transcription by RNA polymerase III | 23/5968 | 46/18723 | 7.89e-03 | 3.33e-02 | 23 |
| GO:000635611 | Thyroid | ATC | regulation of transcription by RNA polymerase I | 20/6293 | 34/18723 | 2.22e-03 | 1.04e-02 | 20 |
| GO:000636011 | Thyroid | ATC | transcription by RNA polymerase I | 28/6293 | 55/18723 | 5.94e-03 | 2.39e-02 | 28 |
| Page: 1 |
| Pathway ID | Tissue | Disease Stage | Description | Gene Ratio | Bg Ratio | pvalue | p.adjust | qvalue | Count |
| hsa0501616 | Breast | Precancer | Huntington disease | 98/684 | 306/8465 | 2.85e-35 | 2.25e-33 | 1.72e-33 | 98 |
| hsa0501617 | Breast | Precancer | Huntington disease | 98/684 | 306/8465 | 2.85e-35 | 2.25e-33 | 1.72e-33 | 98 |
| hsa0501623 | Breast | IDC | Huntington disease | 103/867 | 306/8465 | 5.14e-30 | 4.17e-28 | 3.12e-28 | 103 |
| hsa0501633 | Breast | IDC | Huntington disease | 103/867 | 306/8465 | 5.14e-30 | 4.17e-28 | 3.12e-28 | 103 |
| hsa0501643 | Breast | DCIS | Huntington disease | 101/846 | 306/8465 | 1.54e-29 | 1.24e-27 | 9.13e-28 | 101 |
| hsa0501653 | Breast | DCIS | Huntington disease | 101/846 | 306/8465 | 1.54e-29 | 1.24e-27 | 9.13e-28 | 101 |
| hsa0501620 | Endometrium | AEH | Huntington disease | 118/1197 | 306/8465 | 3.00e-27 | 2.44e-25 | 1.78e-25 | 118 |
| hsa05016110 | Endometrium | AEH | Huntington disease | 118/1197 | 306/8465 | 3.00e-27 | 2.44e-25 | 1.78e-25 | 118 |
| hsa0501625 | Endometrium | EEC | Huntington disease | 120/1237 | 306/8465 | 3.86e-27 | 4.23e-25 | 3.15e-25 | 120 |
| hsa0501635 | Endometrium | EEC | Huntington disease | 120/1237 | 306/8465 | 3.86e-27 | 4.23e-25 | 3.15e-25 | 120 |
| hsa0501630 | Esophagus | HGIN | Huntington disease | 129/1383 | 306/8465 | 6.81e-28 | 7.41e-26 | 5.88e-26 | 129 |
| hsa034205 | Esophagus | HGIN | Nucleotide excision repair | 29/1383 | 63/8465 | 2.96e-08 | 5.36e-07 | 4.26e-07 | 29 |
| hsa030205 | Esophagus | HGIN | RNA polymerase | 12/1383 | 34/8465 | 5.62e-03 | 3.99e-02 | 3.17e-02 | 12 |
| hsa05016113 | Esophagus | HGIN | Huntington disease | 129/1383 | 306/8465 | 6.81e-28 | 7.41e-26 | 5.88e-26 | 129 |
| hsa0342012 | Esophagus | HGIN | Nucleotide excision repair | 29/1383 | 63/8465 | 2.96e-08 | 5.36e-07 | 4.26e-07 | 29 |
| hsa0302012 | Esophagus | HGIN | RNA polymerase | 12/1383 | 34/8465 | 5.62e-03 | 3.99e-02 | 3.17e-02 | 12 |
| hsa05016210 | Esophagus | ESCC | Huntington disease | 226/4205 | 306/8465 | 1.38e-18 | 8.72e-17 | 4.46e-17 | 226 |
| hsa0342022 | Esophagus | ESCC | Nucleotide excision repair | 54/4205 | 63/8465 | 2.01e-09 | 2.17e-08 | 1.11e-08 | 54 |
| hsa0302021 | Esophagus | ESCC | RNA polymerase | 28/4205 | 34/8465 | 8.19e-05 | 3.35e-04 | 1.71e-04 | 28 |
| hsa046234 | Esophagus | ESCC | Cytosolic DNA-sensing pathway | 49/4205 | 75/8465 | 4.35e-03 | 1.12e-02 | 5.74e-03 | 49 |
| Page: 1 2 3 |
Top |
Cell-cell communication analysis |
| Identification of potential cell-cell interactions between two cell types and their ligand-receptor pairs for different disease states |
| Ligand | Receptor | LRpair | Pathway | Tissue | Disease Stage |
| Page: 1 |
Top |
Single-cell gene regulatory network inference analysis |
| Find out the significant the regulons (TFs) and the target genes of each regulon across cell types for different disease states |
| TF | Cell Type | Tissue | Disease Stage | Target Gene | RSS | Regulon Activity |
| ∗The dot plots of a searched regulon are shown for all cell subpopulations in each disease state of each tissue based on the regulon specific score inferred using pySCENIC and by calculating the average expression. |
| Page: 1 |
Top |
Somatic mutation of malignant transformation related genes |
| Annotation of somatic variants for genes involved in malignant transformation |
| Hugo Symbol | Variant Class | Variant Classification | dbSNP RS | HGVSc | HGVSp | HGVSp Short | SWISSPROT | BIOTYPE | SIFT | PolyPhen | Tumor Sample Barcode | Tissue | Histology | Sex | Age | Stage | Therapy Types | Drugs | Outcome |
| POLR2K | SNV | Missense_Mutation | rs200510163 | c.49N>C | p.Tyr17His | p.Y17H | P53803 | protein_coding | deleterious(0.02) | benign(0.022) | TCGA-AG-A01Y-01 | Colorectum | rectum adenocarcinoma | Female | <65 | I/II | Chemotherapy | 5-fluorouracil | CR |
| POLR2K | SNV | Missense_Mutation | rs758836631 | c.173G>A | p.Arg58Gln | p.R58Q | P53803 | protein_coding | tolerated(0.17) | benign(0.013) | TCGA-A5-A0VP-01 | Endometrium | uterine corpus endometrioid carcinoma | Female | >=65 | I/II | Unknown | Unknown | SD |
| POLR2K | SNV | Missense_Mutation | c.119N>A | p.Gly40Glu | p.G40E | P53803 | protein_coding | deleterious(0.04) | benign(0.319) | TCGA-AP-A0LM-01 | Endometrium | uterine corpus endometrioid carcinoma | Female | <65 | III/IV | Chemotherapy | cisplatin | SD | |
| POLR2K | SNV | Missense_Mutation | rs758836631 | c.173G>A | p.Arg58Gln | p.R58Q | P53803 | protein_coding | tolerated(0.17) | benign(0.013) | TCGA-AX-A3FT-01 | Endometrium | uterine corpus endometrioid carcinoma | Female | <65 | I/II | Unknown | Unknown | SD |
| POLR2K | SNV | Missense_Mutation | novel | c.68A>G | p.His23Arg | p.H23R | P53803 | protein_coding | tolerated(0.17) | benign(0.045) | TCGA-FI-A2D5-01 | Endometrium | uterine corpus endometrioid carcinoma | Female | <65 | III/IV | Chemotherapy | carboplatinum | PD |
| POLR2K | SNV | Missense_Mutation | novel | c.122N>G | p.Tyr41Cys | p.Y41C | P53803 | protein_coding | tolerated(0.07) | benign(0.148) | TCGA-21-1080-01 | Lung | lung squamous cell carcinoma | Male | >=65 | I/II | Unknown | Unknown | SD |
| Page: 1 |
Top |
Related drugs of malignant transformation related genes |
| Identification of chemicals and drugs interact with genes involved in malignant transfromation |
| (DGIdb 4.0) |
| Entrez ID | Symbol | Category | Interaction Types | Drug Claim Name | Drug Name | PMIDs |
| Page: 1 |

Copyright 2023-Present -The University of Texas Health Science Center at Houston |