
|
|||||
|
 | |
| |
| |
| |
| |
| |
|
Gene: POLR2J3 |
Gene summary for POLR2J3 |
| Gene information | Species | Human | Gene symbol | POLR2J3 | Gene ID | 548644 |
| Gene name | RNA polymerase II subunit J3 | |
| Gene Alias | POLR2J2 | |
| Cytomap | 7q22.1 | |
| Gene Type | protein-coding | GO ID | GO:0006139 | UniProtAcc | A0A0B4J2F8 |
Top |
Malignant transformation analysis |
| Identification of the aberrant gene expression in precancerous and cancerous lesions by comparing the gene expression of stem-like cells in diseased tissues with normal stem cells |
| Entrez ID | Symbol | Replicates | Species | Organ | Tissue | Adj P-value | Log2FC | Malignancy |
| 548644 | POLR2J3 | Tumor | Human | Cervix | CC | 2.83e-26 | 4.42e-01 | 0.1241 |
| 548644 | POLR2J3 | sample1 | Human | Cervix | CC | 5.12e-11 | 4.82e-01 | 0.0959 |
| 548644 | POLR2J3 | sample3 | Human | Cervix | CC | 6.57e-44 | 6.23e-01 | 0.1387 |
| 548644 | POLR2J3 | H2 | Human | Cervix | HSIL_HPV | 3.77e-22 | 4.36e-01 | 0.0632 |
| 548644 | POLR2J3 | L1 | Human | Cervix | CC | 1.91e-07 | 4.21e-01 | 0.0802 |
| 548644 | POLR2J3 | T1 | Human | Cervix | CC | 1.48e-28 | 6.31e-01 | 0.0918 |
| 548644 | POLR2J3 | T2 | Human | Cervix | CC | 1.12e-06 | 3.85e-01 | 0.0709 |
| 548644 | POLR2J3 | T3 | Human | Cervix | CC | 1.29e-41 | 6.06e-01 | 0.1389 |
| 548644 | POLR2J3 | HTA11_99999970781_79442 | Human | Colorectum | MSS | 3.49e-32 | 5.42e-01 | 0.294 |
| 548644 | POLR2J3 | HTA11_99999965062_69753 | Human | Colorectum | MSI-H | 1.23e-14 | 1.20e+00 | 0.3487 |
| 548644 | POLR2J3 | HTA11_99999965104_69814 | Human | Colorectum | MSS | 5.00e-45 | 1.17e+00 | 0.281 |
| 548644 | POLR2J3 | HTA11_99999971662_82457 | Human | Colorectum | MSS | 6.56e-26 | 5.32e-01 | 0.3859 |
| 548644 | POLR2J3 | HTA11_99999973899_84307 | Human | Colorectum | MSS | 5.11e-23 | 7.50e-01 | 0.2585 |
| 548644 | POLR2J3 | HTA11_99999974143_84620 | Human | Colorectum | MSS | 8.56e-30 | 5.45e-01 | 0.3005 |
| 548644 | POLR2J3 | AEH-subject2 | Human | Endometrium | AEH | 1.57e-07 | -3.40e-01 | -0.2525 |
| 548644 | POLR2J3 | AEH-subject3 | Human | Endometrium | AEH | 6.11e-11 | -3.72e-01 | -0.2576 |
| 548644 | POLR2J3 | AEH-subject5 | Human | Endometrium | AEH | 3.92e-16 | -4.83e-01 | -0.2953 |
| 548644 | POLR2J3 | EEC-subject1 | Human | Endometrium | EEC | 2.48e-13 | -3.88e-01 | -0.2682 |
| 548644 | POLR2J3 | EEC-subject2 | Human | Endometrium | EEC | 2.88e-11 | -3.97e-01 | -0.2607 |
| 548644 | POLR2J3 | EEC-subject3 | Human | Endometrium | EEC | 4.74e-18 | -4.93e-01 | -0.2525 |
| Page: 1 2 3 4 5 6 7 8 9 |
| Tissue | Expression Dynamics | Abbreviation |
| Cervix |  | CC: Cervix cancer |
| HSIL_HPV: HPV-infected high-grade squamous intraepithelial lesions | ||
| N_HPV: HPV-infected normal cervix | ||
| Colorectum (GSE201348) |  | FAP: Familial adenomatous polyposis |
| CRC: Colorectal cancer | ||
| Colorectum (HTA11) | 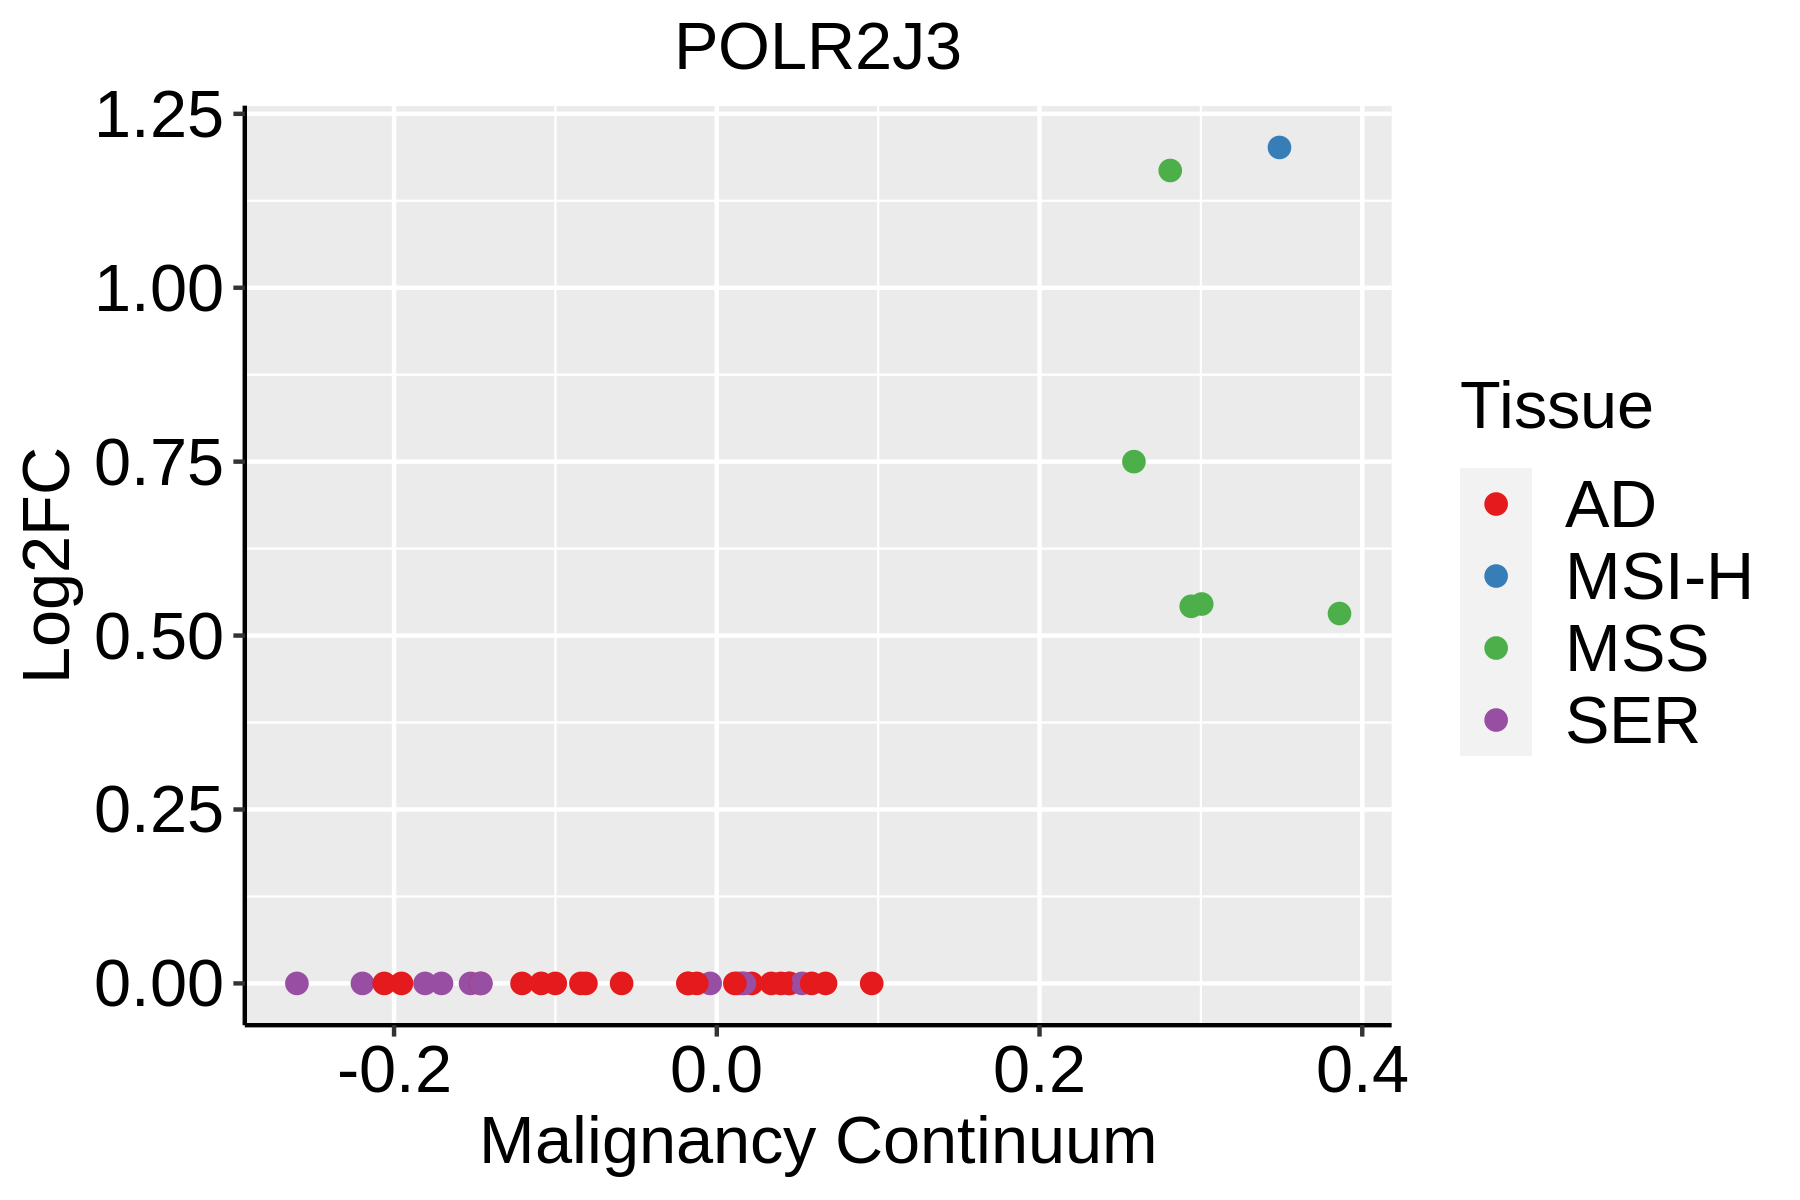 | AD: Adenomas |
| SER: Sessile serrated lesions | ||
| MSI-H: Microsatellite-high colorectal cancer | ||
| MSS: Microsatellite stable colorectal cancer | ||
| Endometrium |  | AEH: Atypical endometrial hyperplasia |
| EEC: Endometrioid Cancer | ||
| Esophagus |  | ESCC: Esophageal squamous cell carcinoma |
| HGIN: High-grade intraepithelial neoplasias | ||
| LGIN: Low-grade intraepithelial neoplasias | ||
| Liver | 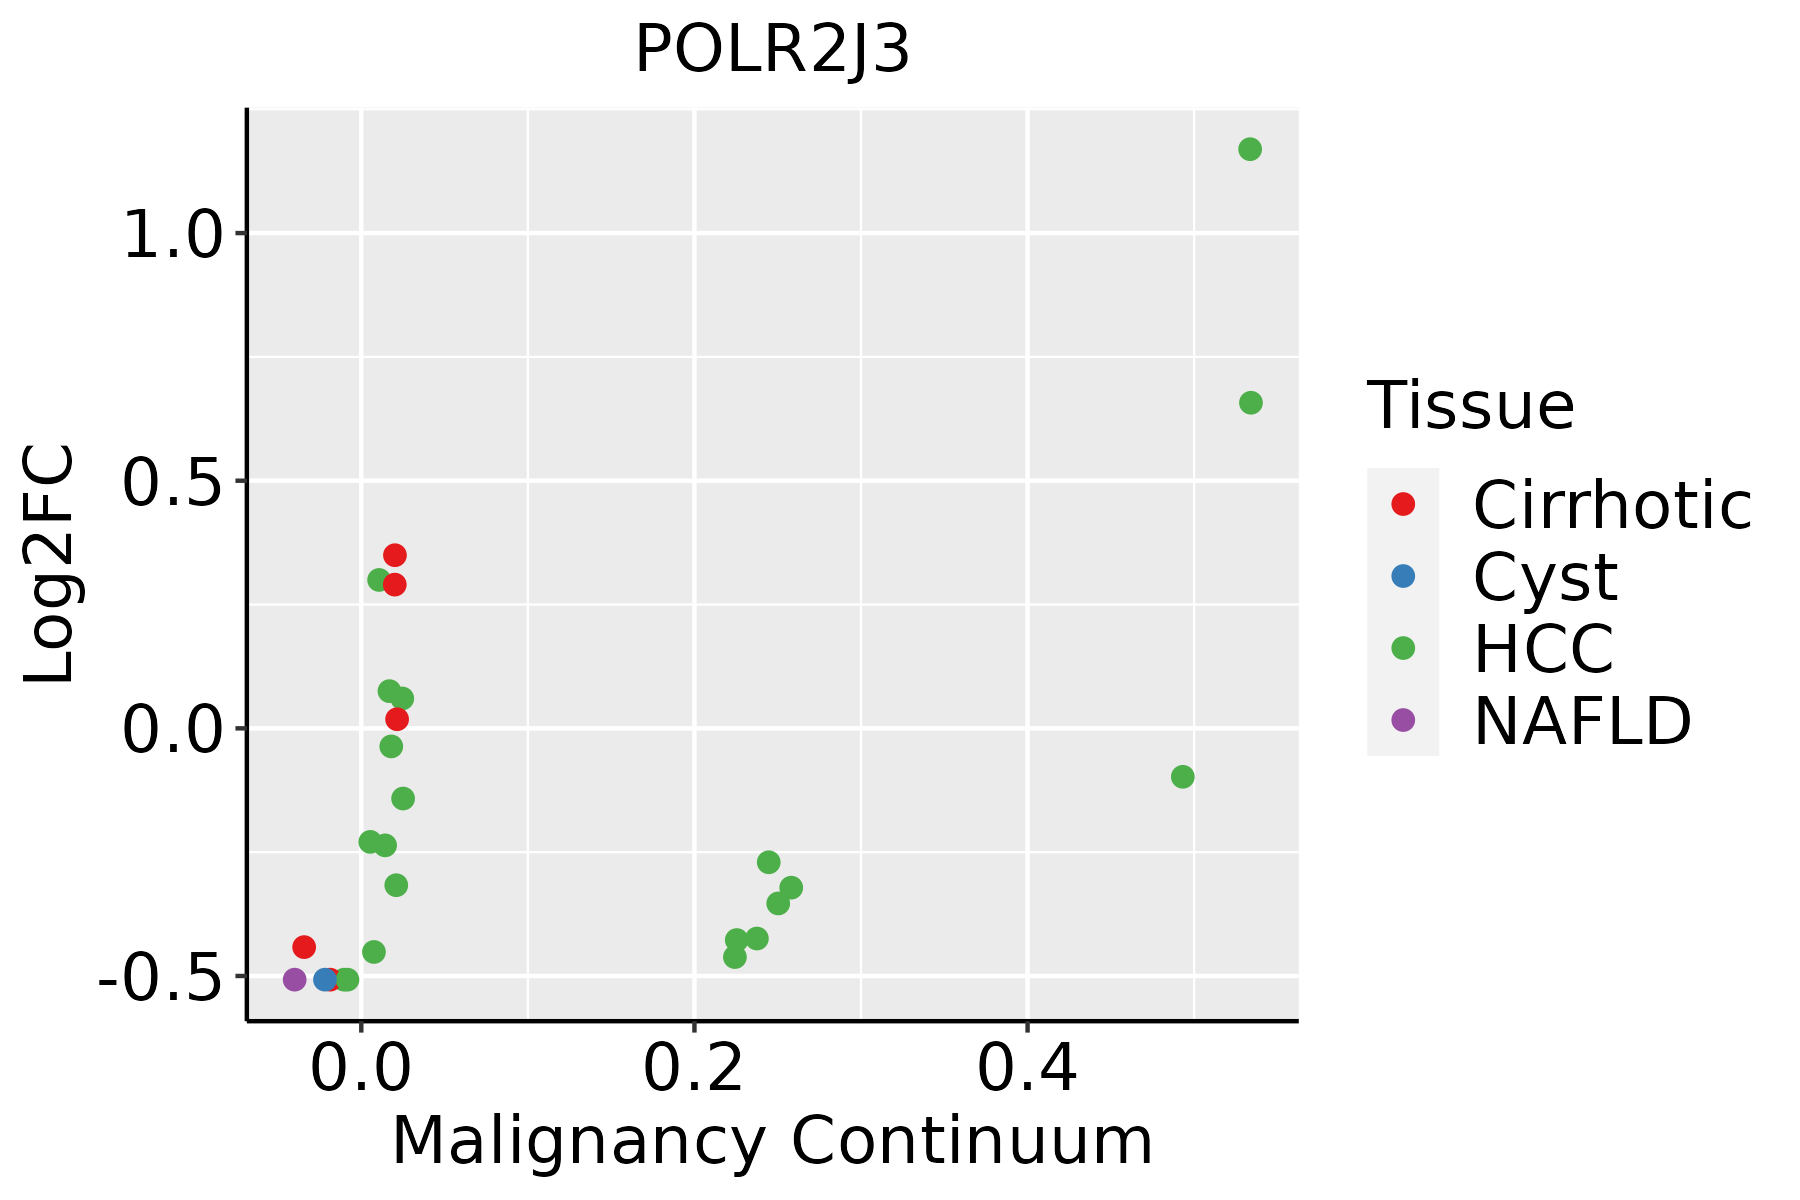 | HCC: Hepatocellular carcinoma |
| NAFLD: Non-alcoholic fatty liver disease | ||
| Lung |  | AAH: Atypical adenomatous hyperplasia |
| AIS: Adenocarcinoma in situ | ||
| IAC: Invasive lung adenocarcinoma | ||
| MIA: Minimally invasive adenocarcinoma | ||
| Oral Cavity |  | EOLP: Erosive Oral lichen planus |
| LP: leukoplakia | ||
| NEOLP: Non-erosive oral lichen planus | ||
| OSCC: Oral squamous cell carcinoma | ||
| Prostate |  | BPH: Benign Prostatic Hyperplasia |
| Skin | 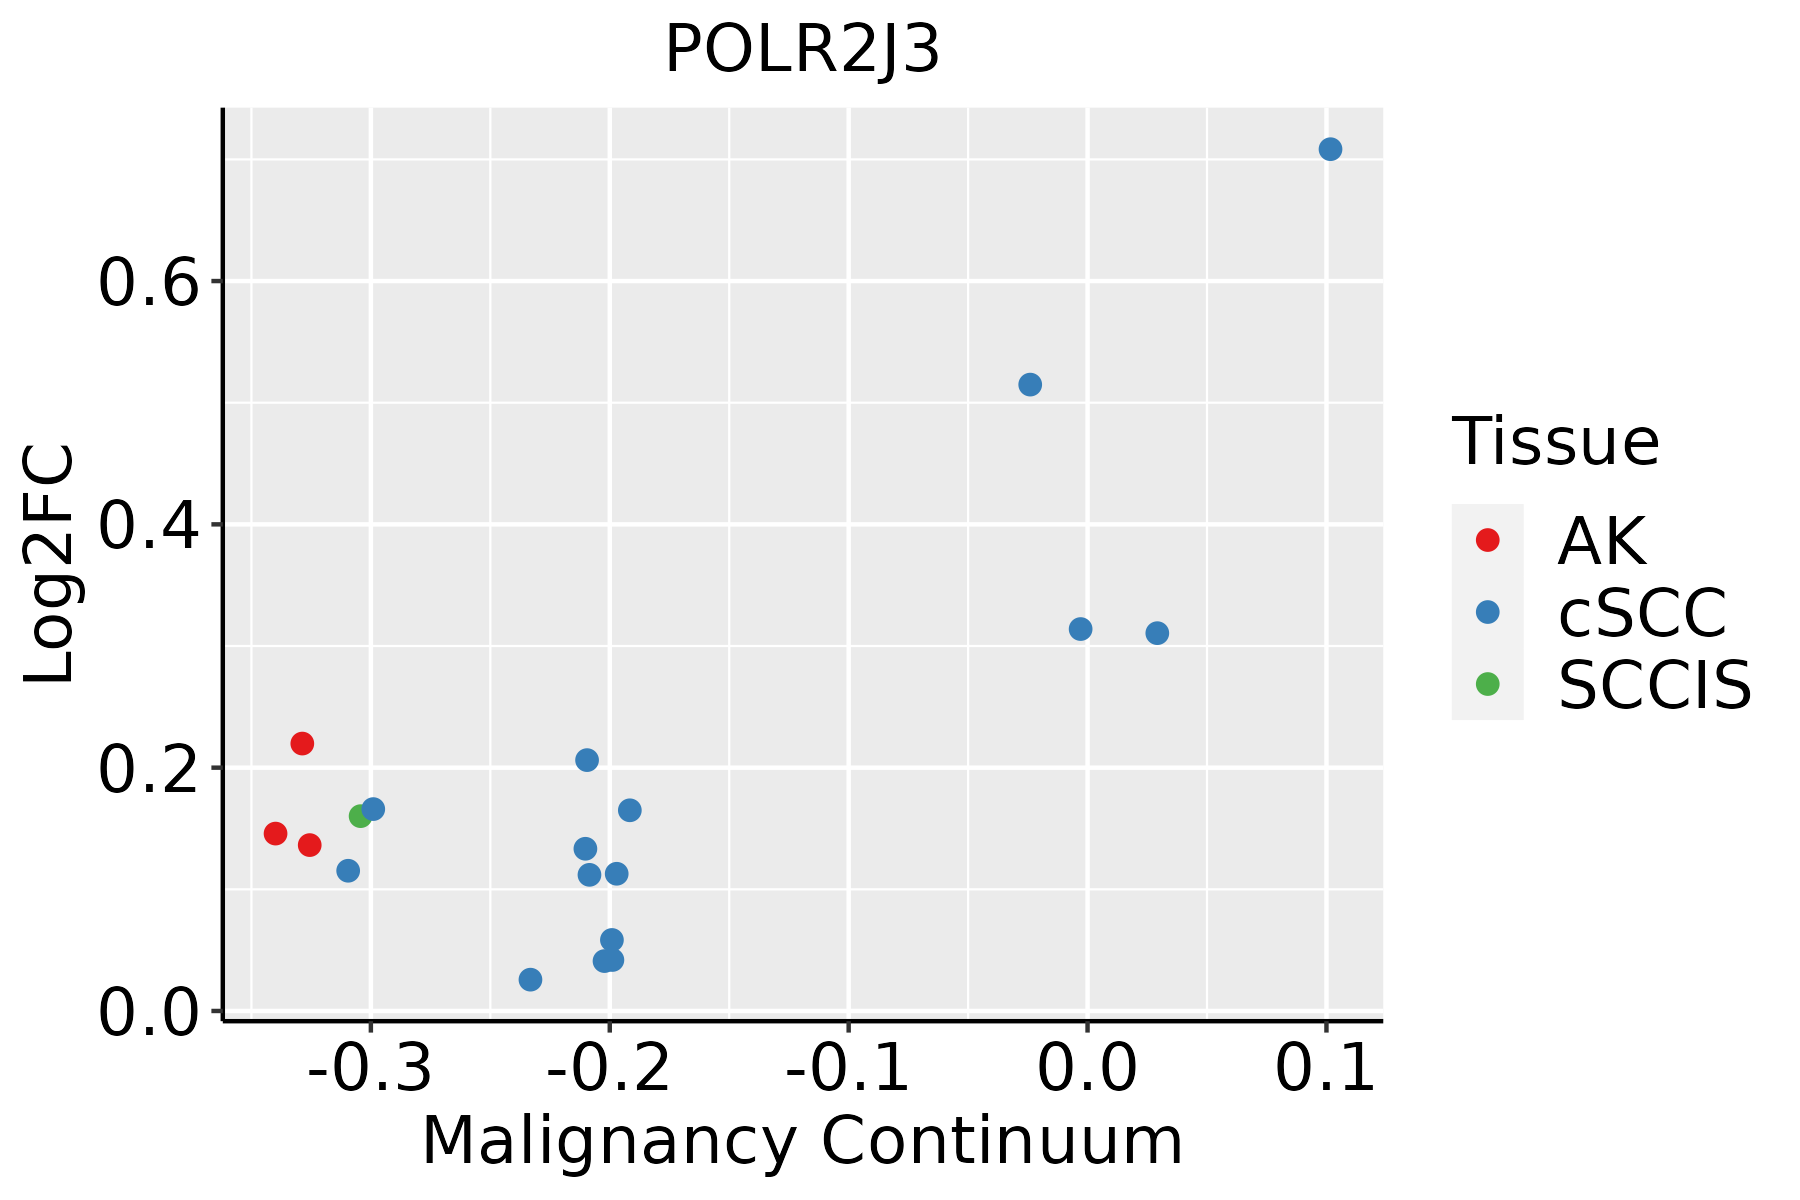 | AK: Actinic keratosis |
| cSCC: Cutaneous squamous cell carcinoma | ||
| SCCIS:squamous cell carcinoma in situ |
| ∗log2FC in expression of this searched gene in stem-like cells from each diseased tissue sample relative to stem-like cells in normal samples in each tissue plotted against the malignancy continuum. Samples are colored based on if they are from different disease stage. |
Top |
Malignant transformation related pathway analysis |
| Find out the enriched GO biological processes and KEGG pathways involved in transition from healthy to precancer to cancer |
| Tissue | Disease Stage | Enriched GO biological Processes |
| Colorectum | AD |  |
| Colorectum | SER |  |
| Colorectum | MSS |  |
| Colorectum | MSI-H |  |
| Colorectum | FAP |  |
| ∗Top 15 enriched GO BP terms are showed in the bar plot of each disease state in each tissue. Each row represents a significant GO biological process which is colored according to the -log10(p.adjust). |
| Page: 1 2 3 4 5 6 7 8 9 |
| GO ID | Tissue | Disease Stage | Description | Gene Ratio | Bg Ratio | pvalue | p.adjust | Count |
| Page: 1 |
| Pathway ID | Tissue | Disease Stage | Description | Gene Ratio | Bg Ratio | pvalue | p.adjust | qvalue | Count |
| hsa0501618 | Cervix | CC | Huntington disease | 94/1267 | 306/8465 | 8.49e-13 | 3.06e-11 | 1.81e-11 | 94 |
| hsa0501619 | Cervix | CC | Huntington disease | 94/1267 | 306/8465 | 8.49e-13 | 3.06e-11 | 1.81e-11 | 94 |
| hsa0501624 | Cervix | HSIL_HPV | Huntington disease | 38/459 | 306/8465 | 1.21e-06 | 2.54e-05 | 2.05e-05 | 38 |
| hsa0501634 | Cervix | HSIL_HPV | Huntington disease | 38/459 | 306/8465 | 1.21e-06 | 2.54e-05 | 2.05e-05 | 38 |
| hsa050164 | Colorectum | MSS | Huntington disease | 141/1875 | 306/8465 | 2.90e-21 | 1.62e-19 | 9.92e-20 | 141 |
| hsa050165 | Colorectum | MSS | Huntington disease | 141/1875 | 306/8465 | 2.90e-21 | 1.62e-19 | 9.92e-20 | 141 |
| hsa050166 | Colorectum | MSI-H | Huntington disease | 83/797 | 306/8465 | 7.06e-20 | 3.81e-18 | 3.20e-18 | 83 |
| hsa050167 | Colorectum | MSI-H | Huntington disease | 83/797 | 306/8465 | 7.06e-20 | 3.81e-18 | 3.20e-18 | 83 |
| hsa0501620 | Endometrium | AEH | Huntington disease | 118/1197 | 306/8465 | 3.00e-27 | 2.44e-25 | 1.78e-25 | 118 |
| hsa05016110 | Endometrium | AEH | Huntington disease | 118/1197 | 306/8465 | 3.00e-27 | 2.44e-25 | 1.78e-25 | 118 |
| hsa0501625 | Endometrium | EEC | Huntington disease | 120/1237 | 306/8465 | 3.86e-27 | 4.23e-25 | 3.15e-25 | 120 |
| hsa0501635 | Endometrium | EEC | Huntington disease | 120/1237 | 306/8465 | 3.86e-27 | 4.23e-25 | 3.15e-25 | 120 |
| hsa0501630 | Esophagus | HGIN | Huntington disease | 129/1383 | 306/8465 | 6.81e-28 | 7.41e-26 | 5.88e-26 | 129 |
| hsa034205 | Esophagus | HGIN | Nucleotide excision repair | 29/1383 | 63/8465 | 2.96e-08 | 5.36e-07 | 4.26e-07 | 29 |
| hsa030205 | Esophagus | HGIN | RNA polymerase | 12/1383 | 34/8465 | 5.62e-03 | 3.99e-02 | 3.17e-02 | 12 |
| hsa05016113 | Esophagus | HGIN | Huntington disease | 129/1383 | 306/8465 | 6.81e-28 | 7.41e-26 | 5.88e-26 | 129 |
| hsa0342012 | Esophagus | HGIN | Nucleotide excision repair | 29/1383 | 63/8465 | 2.96e-08 | 5.36e-07 | 4.26e-07 | 29 |
| hsa0302012 | Esophagus | HGIN | RNA polymerase | 12/1383 | 34/8465 | 5.62e-03 | 3.99e-02 | 3.17e-02 | 12 |
| hsa05016210 | Esophagus | ESCC | Huntington disease | 226/4205 | 306/8465 | 1.38e-18 | 8.72e-17 | 4.46e-17 | 226 |
| hsa0342022 | Esophagus | ESCC | Nucleotide excision repair | 54/4205 | 63/8465 | 2.01e-09 | 2.17e-08 | 1.11e-08 | 54 |
| Page: 1 2 3 |
Top |
Cell-cell communication analysis |
| Identification of potential cell-cell interactions between two cell types and their ligand-receptor pairs for different disease states |
| Ligand | Receptor | LRpair | Pathway | Tissue | Disease Stage |
| Page: 1 |
Top |
Single-cell gene regulatory network inference analysis |
| Find out the significant the regulons (TFs) and the target genes of each regulon across cell types for different disease states |
| TF | Cell Type | Tissue | Disease Stage | Target Gene | RSS | Regulon Activity |
| ∗The dot plots of a searched regulon are shown for all cell subpopulations in each disease state of each tissue based on the regulon specific score inferred using pySCENIC and by calculating the average expression. |
| Page: 1 |
Top |
Somatic mutation of malignant transformation related genes |
| Annotation of somatic variants for genes involved in malignant transformation |
| Hugo Symbol | Variant Class | Variant Classification | dbSNP RS | HGVSc | HGVSp | HGVSp Short | SWISSPROT | BIOTYPE | SIFT | PolyPhen | Tumor Sample Barcode | Tissue | Histology | Sex | Age | Stage | Therapy Types | Drugs | Outcome |
| POLR2J3 | SNV | Missense_Mutation | novel | c.89G>A | p.Cys30Tyr | p.C30Y | protein_coding | tolerated(0.07) | benign(0.011) | TCGA-EA-A411-01 | Cervix | cervical & endocervical cancer | Female | <65 | I/II | Unknown | Unknown | SD | |
| POLR2J3 | SNV | Missense_Mutation | rs767362640 | c.109N>A | p.Glu37Lys | p.E37K | protein_coding | deleterious(0) | probably_damaging(0.991) | TCGA-CV-6961-01 | Oral cavity | head & neck squamous cell carcinoma | Male | <65 | I/II | Unknown | Unknown | PD |
| Page: 1 |
Top |
Related drugs of malignant transformation related genes |
| Identification of chemicals and drugs interact with genes involved in malignant transfromation |
| (DGIdb 4.0) |
| Entrez ID | Symbol | Category | Interaction Types | Drug Claim Name | Drug Name | PMIDs |
| Page: 1 |

Copyright 2023-Present -The University of Texas Health Science Center at Houston |