
|
|||||
|
 | |
| |
| |
| |
| |
| |
|
Gene: POLR2J |
Gene summary for POLR2J |
| Gene information | Species | Human | Gene symbol | POLR2J | Gene ID | 5439 |
| Gene name | RNA polymerase II subunit J | |
| Gene Alias | POLR2J1 | |
| Cytomap | 7q22.1 | |
| Gene Type | protein-coding | GO ID | GO:0006139 | UniProtAcc | P52435 |
Top |
Malignant transformation analysis |
| Identification of the aberrant gene expression in precancerous and cancerous lesions by comparing the gene expression of stem-like cells in diseased tissues with normal stem cells |
| Entrez ID | Symbol | Replicates | Species | Organ | Tissue | Adj P-value | Log2FC | Malignancy |
| 5439 | POLR2J | GSM4909281 | Human | Breast | IDC | 4.91e-10 | 3.74e-01 | 0.21 |
| 5439 | POLR2J | GSM4909282 | Human | Breast | IDC | 1.05e-16 | 4.64e-01 | -0.0288 |
| 5439 | POLR2J | GSM4909286 | Human | Breast | IDC | 1.64e-41 | 6.99e-01 | 0.1081 |
| 5439 | POLR2J | GSM4909288 | Human | Breast | IDC | 1.26e-03 | 8.72e-02 | 0.0988 |
| 5439 | POLR2J | GSM4909293 | Human | Breast | IDC | 1.92e-08 | 3.38e-01 | 0.1581 |
| 5439 | POLR2J | GSM4909294 | Human | Breast | IDC | 8.38e-11 | 2.88e-01 | 0.2022 |
| 5439 | POLR2J | GSM4909296 | Human | Breast | IDC | 1.37e-14 | 2.20e-01 | 0.1524 |
| 5439 | POLR2J | GSM4909297 | Human | Breast | IDC | 3.79e-14 | -1.77e-01 | 0.1517 |
| 5439 | POLR2J | GSM4909298 | Human | Breast | IDC | 2.03e-10 | 3.38e-01 | 0.1551 |
| 5439 | POLR2J | GSM4909301 | Human | Breast | IDC | 3.05e-16 | 4.31e-01 | 0.1577 |
| 5439 | POLR2J | GSM4909304 | Human | Breast | IDC | 3.14e-20 | 5.08e-01 | 0.1636 |
| 5439 | POLR2J | GSM4909306 | Human | Breast | IDC | 4.48e-21 | 5.34e-01 | 0.1564 |
| 5439 | POLR2J | GSM4909307 | Human | Breast | IDC | 4.91e-02 | 2.26e-01 | 0.1569 |
| 5439 | POLR2J | GSM4909308 | Human | Breast | IDC | 5.32e-10 | 3.73e-01 | 0.158 |
| 5439 | POLR2J | GSM4909311 | Human | Breast | IDC | 1.07e-39 | -7.07e-02 | 0.1534 |
| 5439 | POLR2J | GSM4909312 | Human | Breast | IDC | 6.07e-10 | 4.09e-02 | 0.1552 |
| 5439 | POLR2J | GSM4909315 | Human | Breast | IDC | 2.23e-12 | 4.19e-01 | 0.21 |
| 5439 | POLR2J | GSM4909316 | Human | Breast | IDC | 4.99e-09 | 2.11e-01 | 0.21 |
| 5439 | POLR2J | GSM4909318 | Human | Breast | IDC | 7.26e-05 | 4.01e-01 | 0.2031 |
| 5439 | POLR2J | GSM4909319 | Human | Breast | IDC | 3.46e-35 | -2.32e-01 | 0.1563 |
| Page: 1 2 3 4 5 6 7 8 9 10 11 |
| Tissue | Expression Dynamics | Abbreviation |
| Breast | 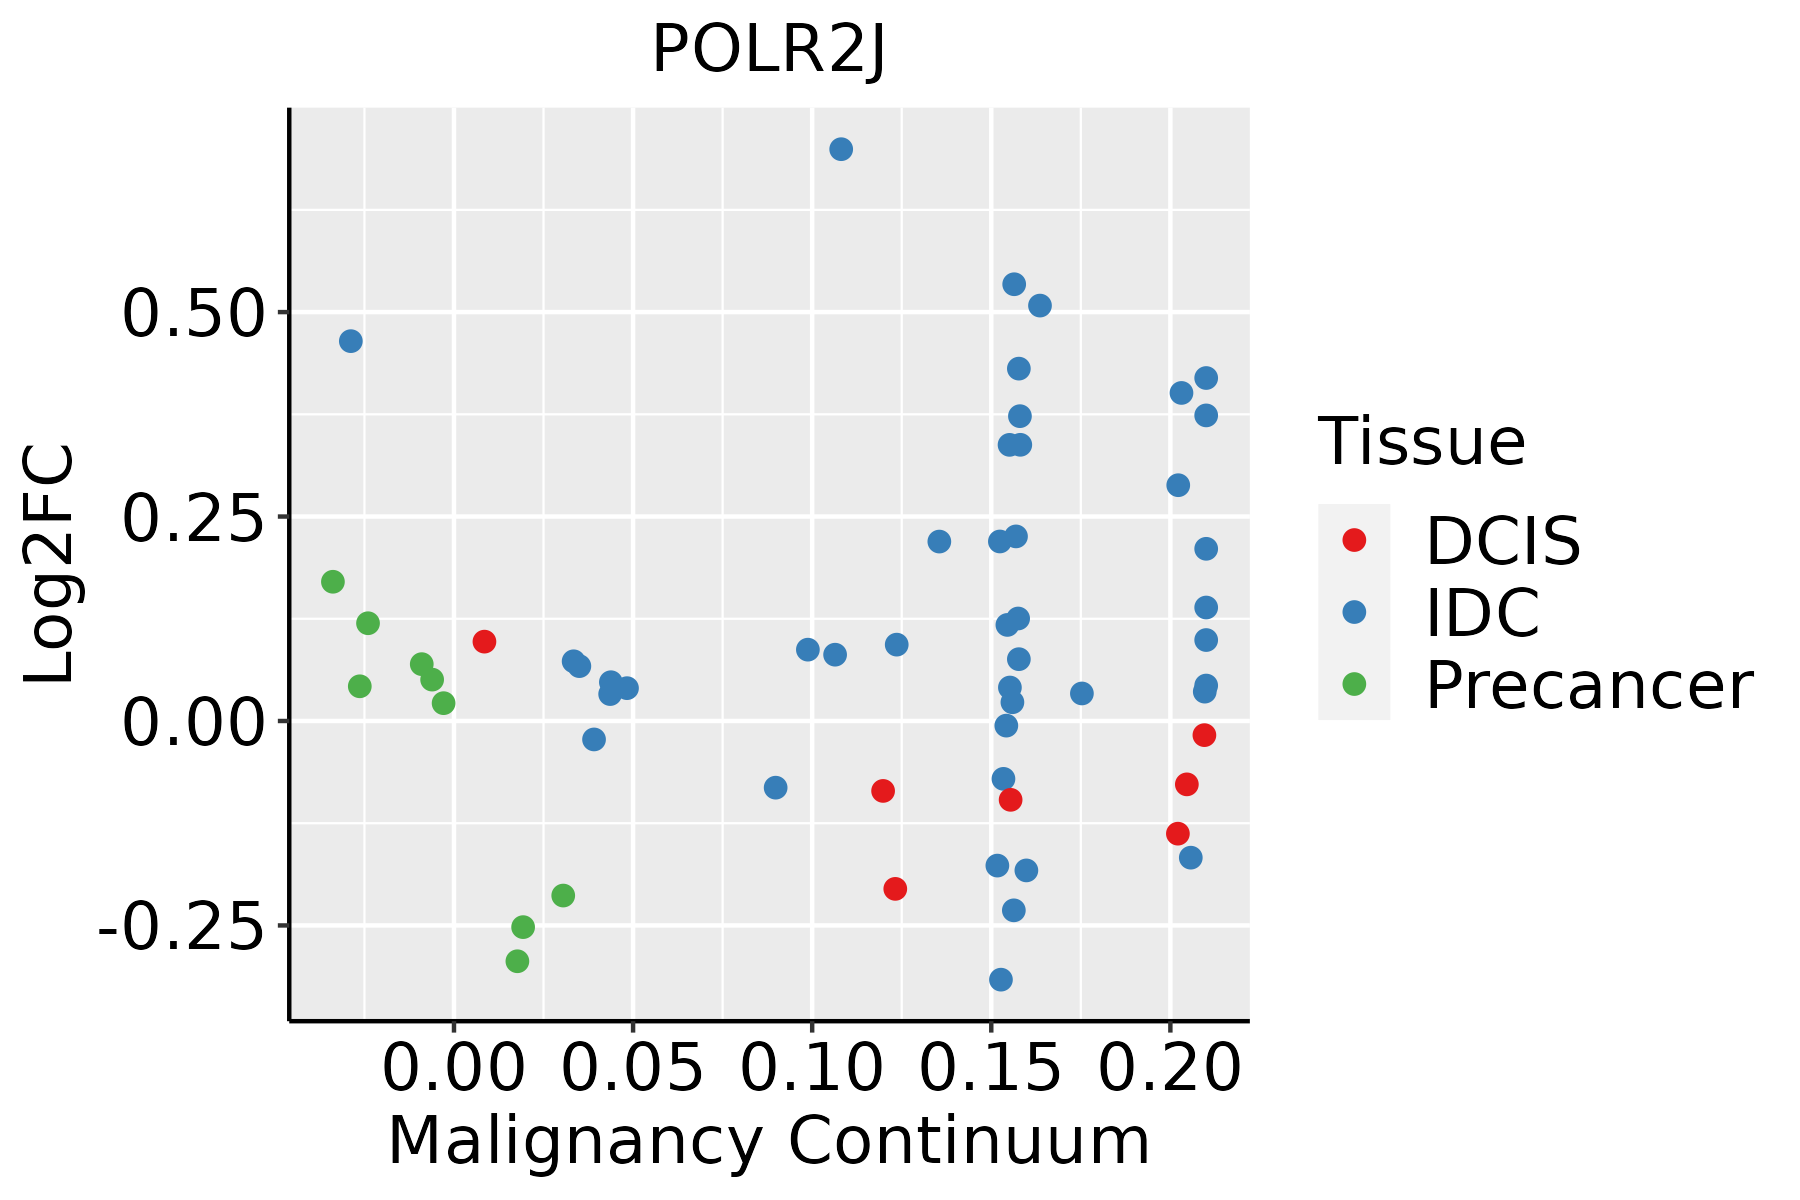 | IDC: Invasive ductal carcinoma |
| DCIS: Ductal carcinoma in situ | ||
| Precancer(BRCA1-mut): Precancerous lesion from BRCA1 mutation carriers | ||
| Colorectum (GSE201348) |  | FAP: Familial adenomatous polyposis |
| CRC: Colorectal cancer | ||
| Colorectum (HTA11) |  | AD: Adenomas |
| SER: Sessile serrated lesions | ||
| MSI-H: Microsatellite-high colorectal cancer | ||
| MSS: Microsatellite stable colorectal cancer | ||
| Endometrium |  | AEH: Atypical endometrial hyperplasia |
| EEC: Endometrioid Cancer | ||
| Esophagus | 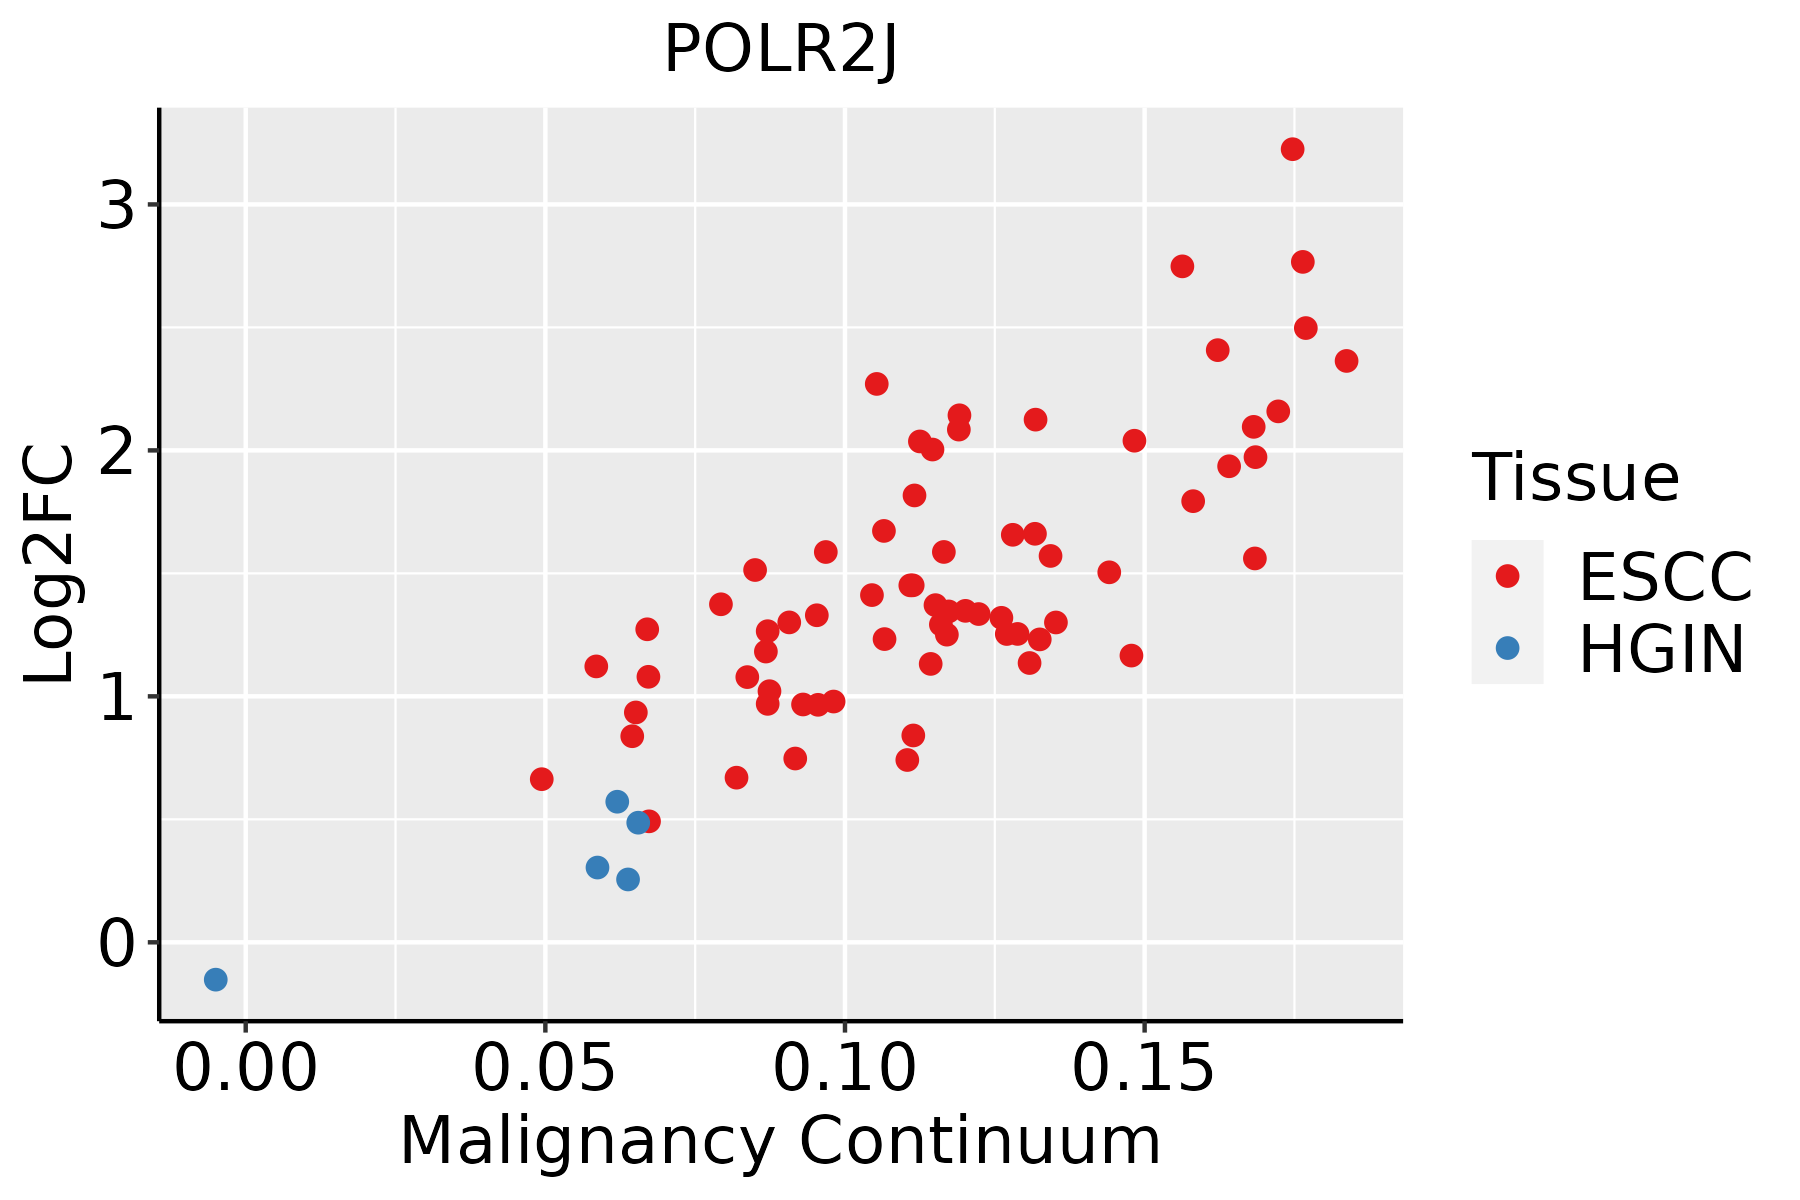 | ESCC: Esophageal squamous cell carcinoma |
| HGIN: High-grade intraepithelial neoplasias | ||
| LGIN: Low-grade intraepithelial neoplasias | ||
| Liver | 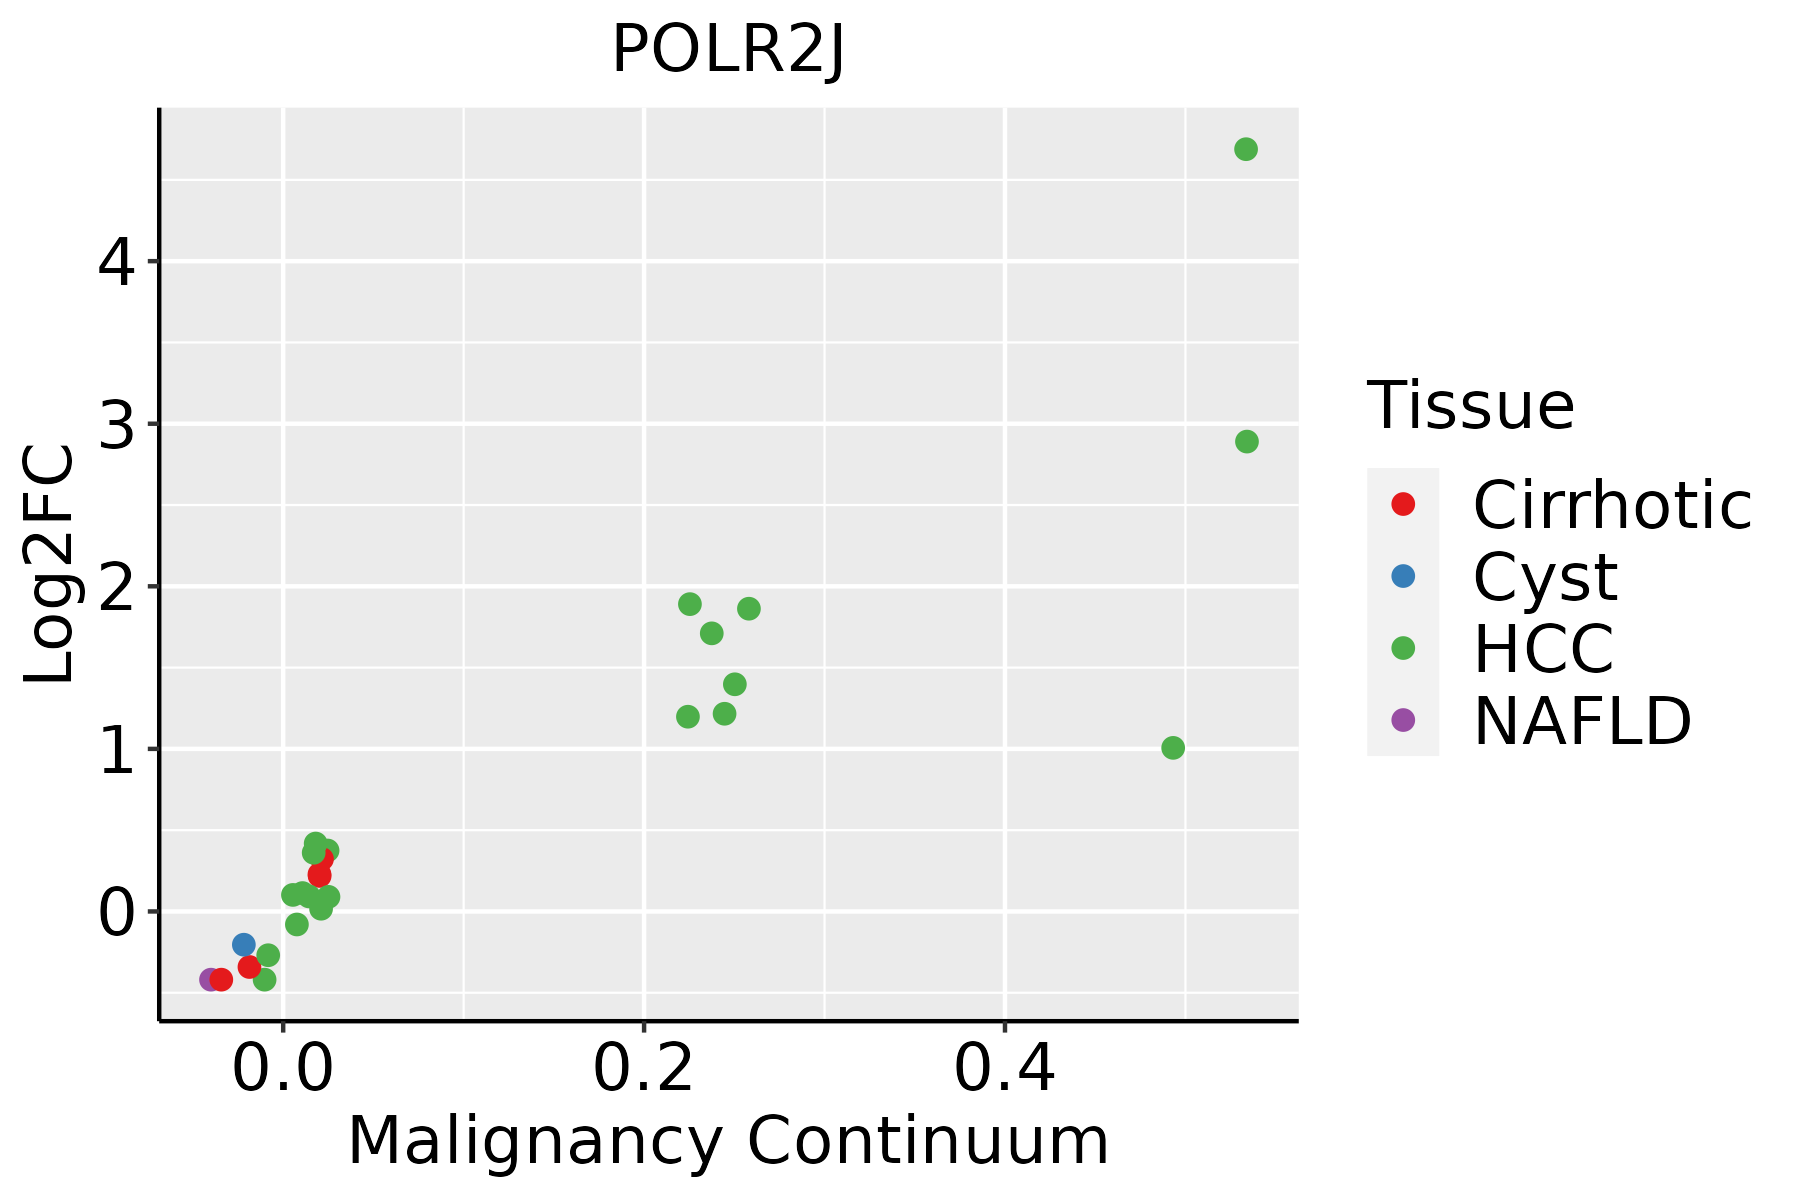 | HCC: Hepatocellular carcinoma |
| NAFLD: Non-alcoholic fatty liver disease | ||
| Oral Cavity | 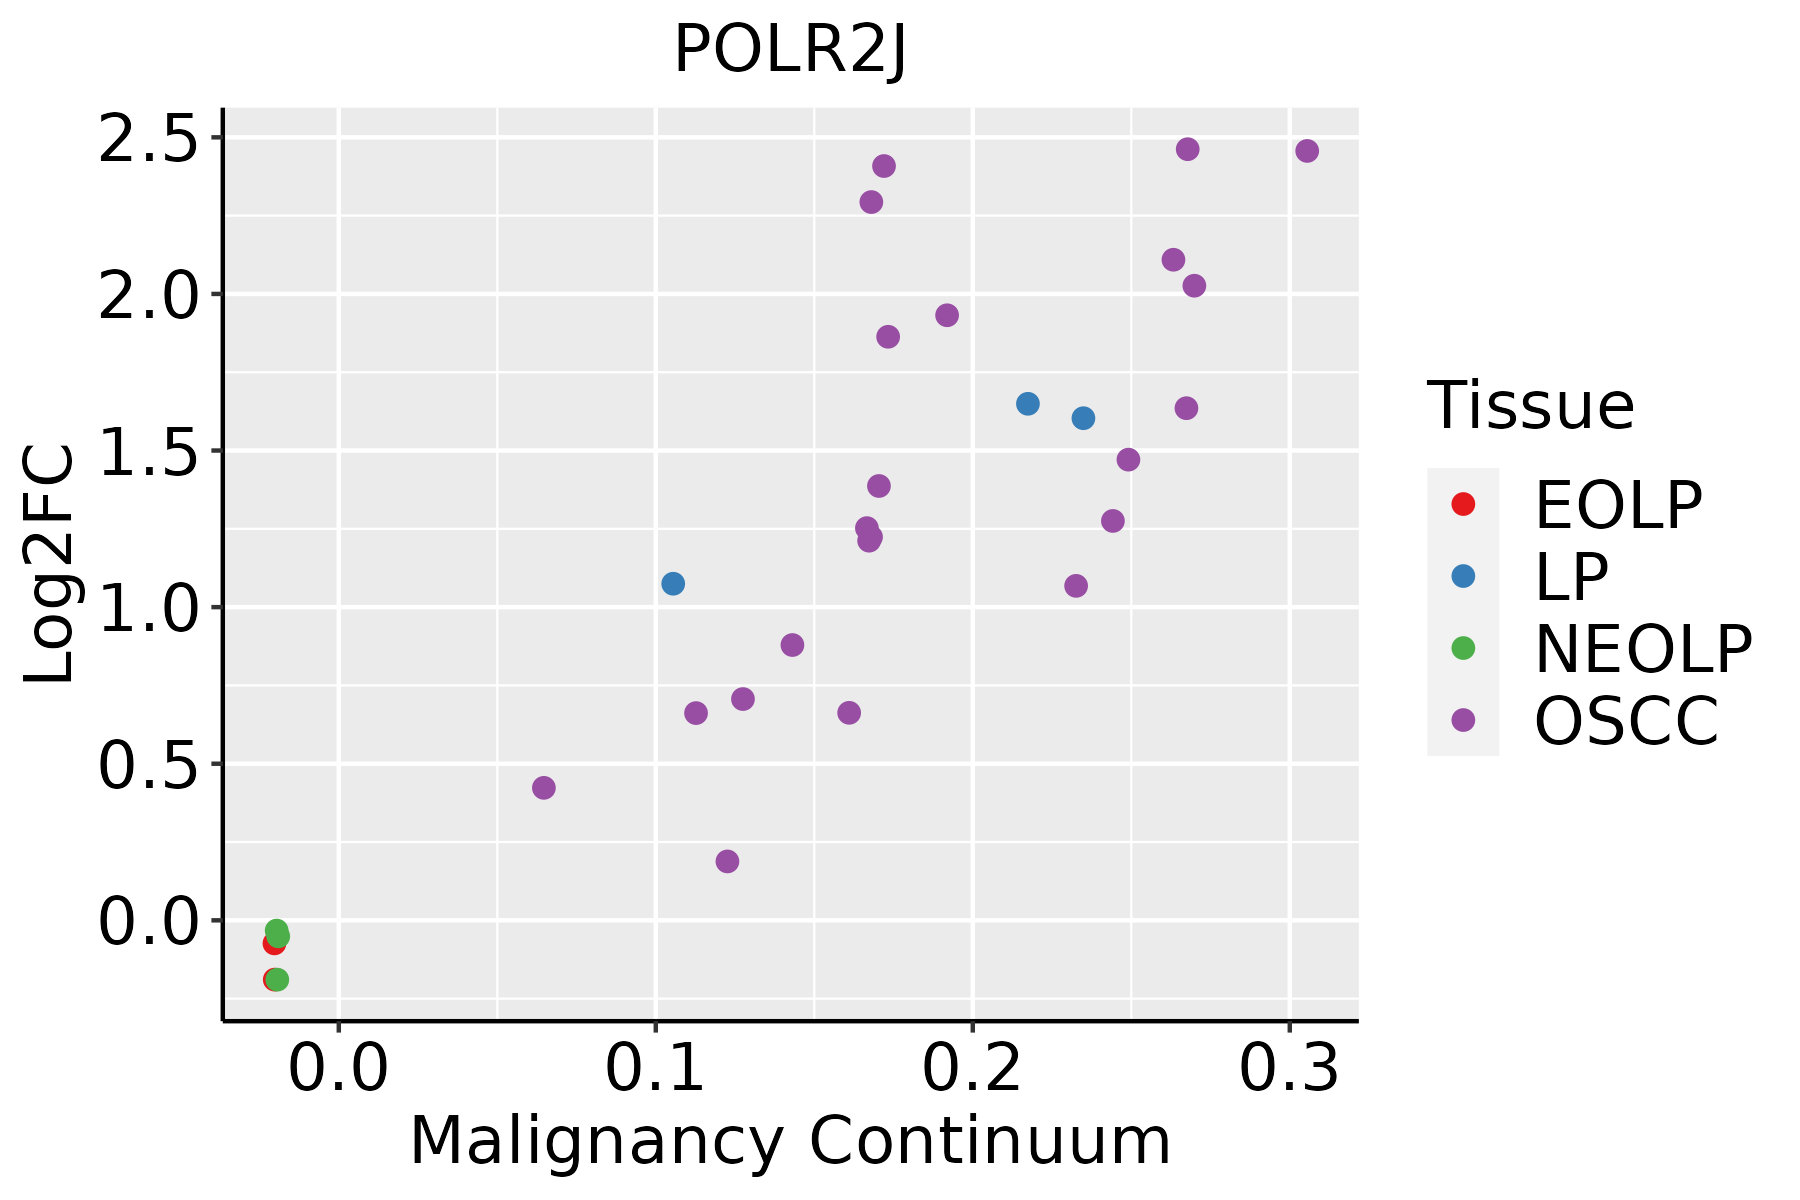 | EOLP: Erosive Oral lichen planus |
| LP: leukoplakia | ||
| NEOLP: Non-erosive oral lichen planus | ||
| OSCC: Oral squamous cell carcinoma | ||
| Prostate | 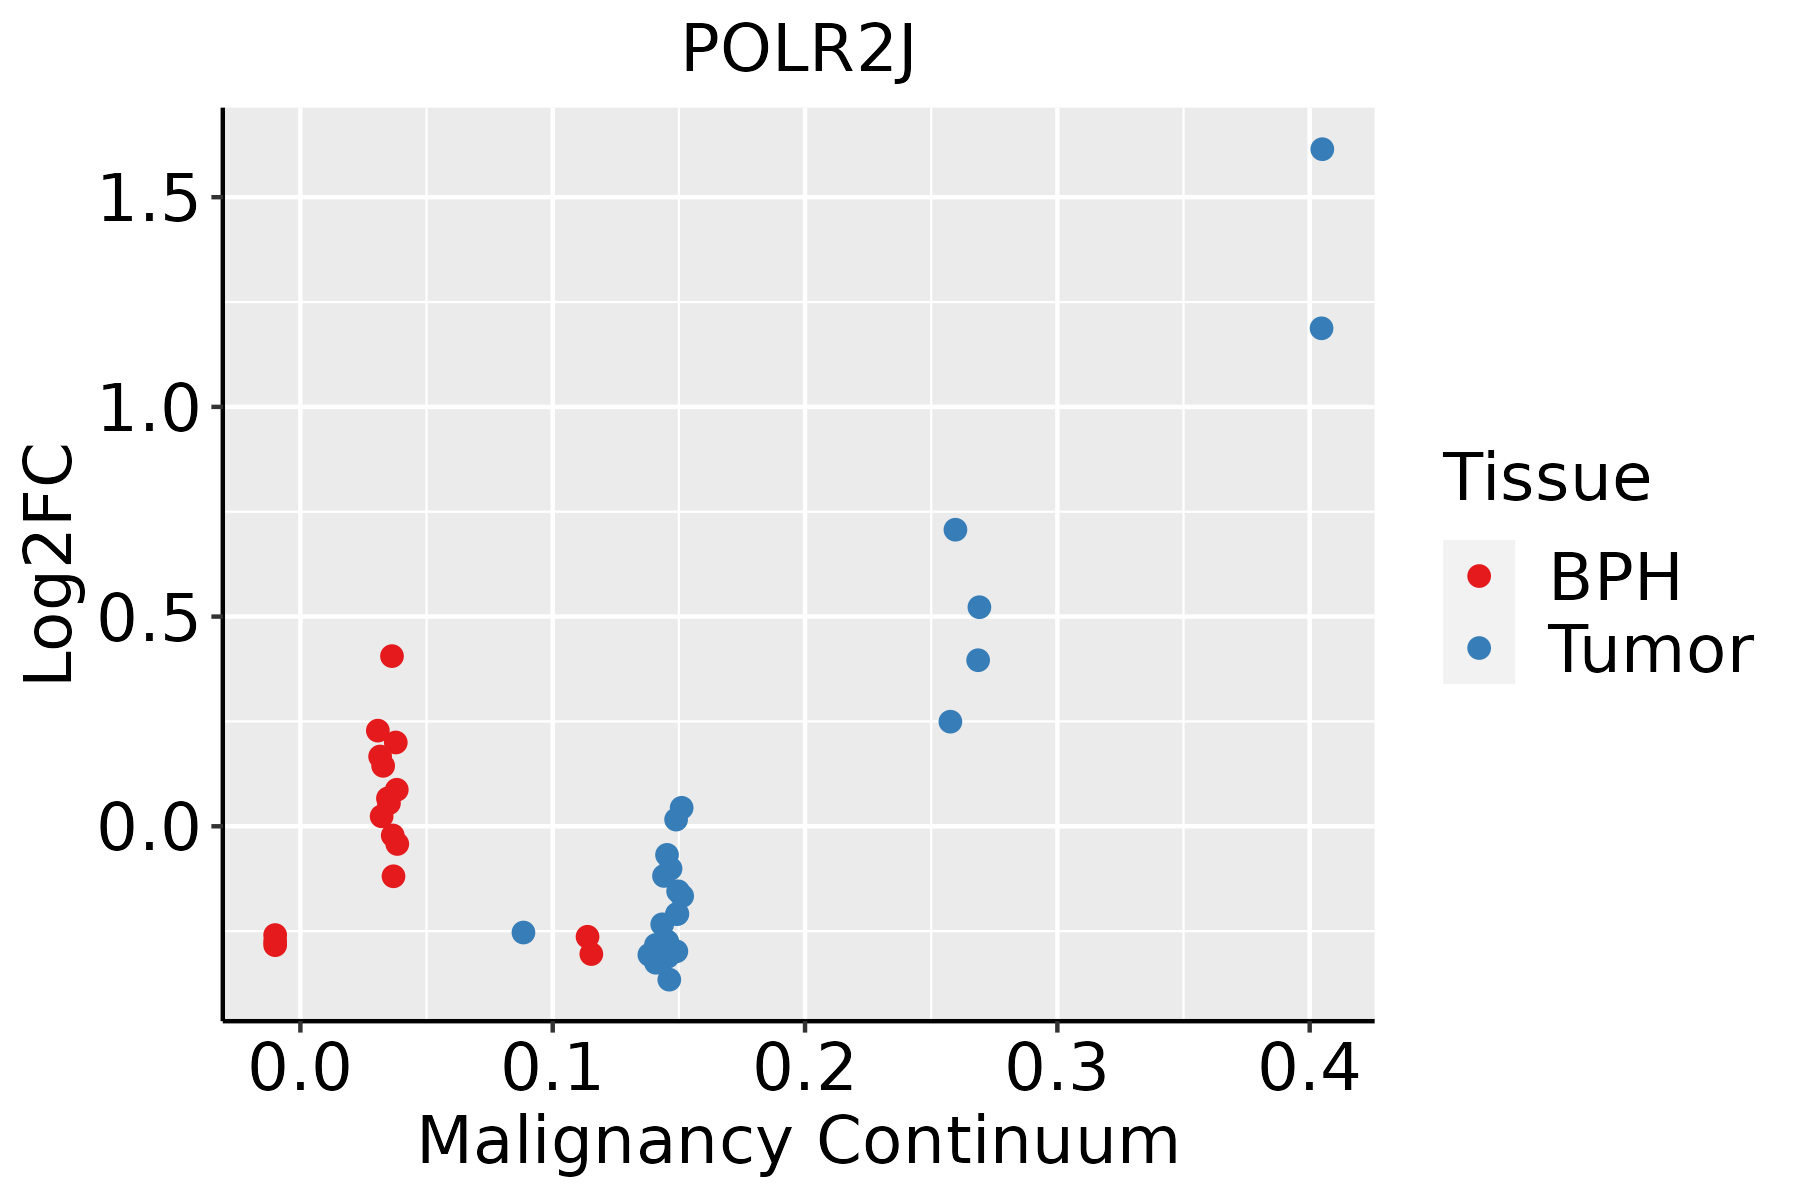 | BPH: Benign Prostatic Hyperplasia |
| Skin |  | AK: Actinic keratosis |
| cSCC: Cutaneous squamous cell carcinoma | ||
| SCCIS:squamous cell carcinoma in situ | ||
| Thyroid |  | ATC: Anaplastic thyroid cancer |
| HT: Hashimoto's thyroiditis | ||
| PTC: Papillary thyroid cancer |
| ∗log2FC in expression of this searched gene in stem-like cells from each diseased tissue sample relative to stem-like cells in normal samples in each tissue plotted against the malignancy continuum. Samples are colored based on if they are from different disease stage. |
Top |
Malignant transformation related pathway analysis |
| Find out the enriched GO biological processes and KEGG pathways involved in transition from healthy to precancer to cancer |
| Tissue | Disease Stage | Enriched GO biological Processes |
| Colorectum | AD |  |
| Colorectum | SER |  |
| Colorectum | MSS |  |
| Colorectum | MSI-H |  |
| Colorectum | FAP |  |
| ∗Top 15 enriched GO BP terms are showed in the bar plot of each disease state in each tissue. Each row represents a significant GO biological process which is colored according to the -log10(p.adjust). |
| Page: 1 2 3 4 5 6 7 8 9 |
| GO ID | Tissue | Disease Stage | Description | Gene Ratio | Bg Ratio | pvalue | p.adjust | Count |
| Page: 1 |
| Pathway ID | Tissue | Disease Stage | Description | Gene Ratio | Bg Ratio | pvalue | p.adjust | qvalue | Count |
| hsa0501623 | Breast | IDC | Huntington disease | 103/867 | 306/8465 | 5.14e-30 | 4.17e-28 | 3.12e-28 | 103 |
| hsa0501633 | Breast | IDC | Huntington disease | 103/867 | 306/8465 | 5.14e-30 | 4.17e-28 | 3.12e-28 | 103 |
| hsa0501643 | Breast | DCIS | Huntington disease | 101/846 | 306/8465 | 1.54e-29 | 1.24e-27 | 9.13e-28 | 101 |
| hsa0501653 | Breast | DCIS | Huntington disease | 101/846 | 306/8465 | 1.54e-29 | 1.24e-27 | 9.13e-28 | 101 |
| hsa05016 | Colorectum | AD | Huntington disease | 147/2092 | 306/8465 | 1.93e-19 | 9.26e-18 | 5.91e-18 | 147 |
| hsa050161 | Colorectum | AD | Huntington disease | 147/2092 | 306/8465 | 1.93e-19 | 9.26e-18 | 5.91e-18 | 147 |
| hsa050162 | Colorectum | SER | Huntington disease | 127/1580 | 306/8465 | 3.29e-21 | 1.37e-19 | 9.92e-20 | 127 |
| hsa050163 | Colorectum | SER | Huntington disease | 127/1580 | 306/8465 | 3.29e-21 | 1.37e-19 | 9.92e-20 | 127 |
| hsa050164 | Colorectum | MSS | Huntington disease | 141/1875 | 306/8465 | 2.90e-21 | 1.62e-19 | 9.92e-20 | 141 |
| hsa050165 | Colorectum | MSS | Huntington disease | 141/1875 | 306/8465 | 2.90e-21 | 1.62e-19 | 9.92e-20 | 141 |
| hsa0501620 | Endometrium | AEH | Huntington disease | 118/1197 | 306/8465 | 3.00e-27 | 2.44e-25 | 1.78e-25 | 118 |
| hsa05016110 | Endometrium | AEH | Huntington disease | 118/1197 | 306/8465 | 3.00e-27 | 2.44e-25 | 1.78e-25 | 118 |
| hsa0501625 | Endometrium | EEC | Huntington disease | 120/1237 | 306/8465 | 3.86e-27 | 4.23e-25 | 3.15e-25 | 120 |
| hsa0501635 | Endometrium | EEC | Huntington disease | 120/1237 | 306/8465 | 3.86e-27 | 4.23e-25 | 3.15e-25 | 120 |
| hsa0501630 | Esophagus | HGIN | Huntington disease | 129/1383 | 306/8465 | 6.81e-28 | 7.41e-26 | 5.88e-26 | 129 |
| hsa034205 | Esophagus | HGIN | Nucleotide excision repair | 29/1383 | 63/8465 | 2.96e-08 | 5.36e-07 | 4.26e-07 | 29 |
| hsa030205 | Esophagus | HGIN | RNA polymerase | 12/1383 | 34/8465 | 5.62e-03 | 3.99e-02 | 3.17e-02 | 12 |
| hsa05016113 | Esophagus | HGIN | Huntington disease | 129/1383 | 306/8465 | 6.81e-28 | 7.41e-26 | 5.88e-26 | 129 |
| hsa0342012 | Esophagus | HGIN | Nucleotide excision repair | 29/1383 | 63/8465 | 2.96e-08 | 5.36e-07 | 4.26e-07 | 29 |
| hsa0302012 | Esophagus | HGIN | RNA polymerase | 12/1383 | 34/8465 | 5.62e-03 | 3.99e-02 | 3.17e-02 | 12 |
| Page: 1 2 3 |
Top |
Cell-cell communication analysis |
| Identification of potential cell-cell interactions between two cell types and their ligand-receptor pairs for different disease states |
| Ligand | Receptor | LRpair | Pathway | Tissue | Disease Stage |
| Page: 1 |
Top |
Single-cell gene regulatory network inference analysis |
| Find out the significant the regulons (TFs) and the target genes of each regulon across cell types for different disease states |
| TF | Cell Type | Tissue | Disease Stage | Target Gene | RSS | Regulon Activity |
| ∗The dot plots of a searched regulon are shown for all cell subpopulations in each disease state of each tissue based on the regulon specific score inferred using pySCENIC and by calculating the average expression. |
| Page: 1 |
Top |
Somatic mutation of malignant transformation related genes |
| Annotation of somatic variants for genes involved in malignant transformation |
| Hugo Symbol | Variant Class | Variant Classification | dbSNP RS | HGVSc | HGVSp | HGVSp Short | SWISSPROT | BIOTYPE | SIFT | PolyPhen | Tumor Sample Barcode | Tissue | Histology | Sex | Age | Stage | Therapy Types | Drugs | Outcome |
| POLR2J | SNV | Missense_Mutation | rs771355970 | c.316N>T | p.Arg106Trp | p.R106W | P52435 | protein_coding | deleterious(0) | possibly_damaging(0.614) | TCGA-A2-A3Y0-01 | Breast | breast invasive carcinoma | Female | <65 | I/II | Chemotherapy | adriamycin | CR |
| POLR2J | SNV | Missense_Mutation | novel | c.83N>A | p.Pro28His | p.P28H | P52435 | protein_coding | deleterious(0) | possibly_damaging(0.846) | TCGA-D8-A1JN-01 | Breast | breast invasive carcinoma | Female | >=65 | III/IV | Hormone Therapy | anastrozolum | SD |
| POLR2J | SNV | Missense_Mutation | novel | c.134N>C | p.Ile45Thr | p.I45T | P52435 | protein_coding | deleterious(0.02) | benign(0.243) | TCGA-AA-A029-01 | Colorectum | colon adenocarcinoma | Male | >=65 | I/II | Unknown | Unknown | SD |
| POLR2J | SNV | Missense_Mutation | rs746099610 | c.310N>T | p.Arg104Cys | p.R104C | P52435 | protein_coding | deleterious(0.01) | probably_damaging(0.976) | TCGA-G4-6304-01 | Colorectum | colon adenocarcinoma | Female | >=65 | I/II | Chemotherapy | fluorouracil | PD |
| POLR2J | SNV | Missense_Mutation | novel | c.122N>T | p.Thr41Ile | p.T41I | P52435 | protein_coding | deleterious(0) | probably_damaging(0.995) | TCGA-AJ-A3EK-01 | Endometrium | uterine corpus endometrioid carcinoma | Female | <65 | I/II | Chemotherapy | carboplatin | CR |
| POLR2J | SNV | Missense_Mutation | rs766396668 | c.323N>T | p.Ala108Val | p.A108V | P52435 | protein_coding | deleterious(0.04) | benign(0.175) | TCGA-AX-A0J1-01 | Endometrium | uterine corpus endometrioid carcinoma | Female | >=65 | I/II | Unknown | Unknown | SD |
| POLR2J | SNV | Missense_Mutation | novel | c.40N>C | p.Glu14Gln | p.E14Q | P52435 | protein_coding | deleterious(0.02) | benign(0.187) | TCGA-55-6987-01 | Lung | lung adenocarcinoma | Male | >=65 | I/II | Unknown | Unknown | SD |
| POLR2J | SNV | Missense_Mutation | novel | c.170N>A | p.Leu57Gln | p.L57Q | P52435 | protein_coding | deleterious(0.02) | probably_damaging(0.982) | TCGA-90-A59Q-01 | Lung | lung squamous cell carcinoma | Female | <65 | I/II | Chemotherapy | cisplatin | PD |
| POLR2J | SNV | Missense_Mutation | novel | c.21N>G | p.Phe7Leu | p.F7L | P52435 | protein_coding | deleterious(0.02) | benign(0.225) | TCGA-CN-A6V1-01 | Oral cavity | head & neck squamous cell carcinoma | Male | <65 | I/II | Immunotherapy | erbitux | CR |
| POLR2J | insertion | Frame_Shift_Ins | novel | c.157_158insCCCTC | p.Asp53AlafsTer59 | p.D53Afs*59 | P52435 | protein_coding | TCGA-IM-A41Z-01 | Thyroid | thyroid carcinoma | Female | <65 | I/II | Hormone Therapy | synthroid | SD |
| Page: 1 |
Top |
Related drugs of malignant transformation related genes |
| Identification of chemicals and drugs interact with genes involved in malignant transfromation |
| (DGIdb 4.0) |
| Entrez ID | Symbol | Category | Interaction Types | Drug Claim Name | Drug Name | PMIDs |
| Page: 1 |

Copyright 2023-Present -The University of Texas Health Science Center at Houston |