
|
|||||
|
 | |
| |
| |
| |
| |
| |
|
Gene: POLR2G |
Gene summary for POLR2G |
| Gene information | Species | Human | Gene symbol | POLR2G | Gene ID | 5436 |
| Gene name | RNA polymerase II subunit G | |
| Gene Alias | RPB19 | |
| Cytomap | 11q12.3 | |
| Gene Type | protein-coding | GO ID | GO:0000288 | UniProtAcc | P62487 |
Top |
Malignant transformation analysis |
| Identification of the aberrant gene expression in precancerous and cancerous lesions by comparing the gene expression of stem-like cells in diseased tissues with normal stem cells |
| Entrez ID | Symbol | Replicates | Species | Organ | Tissue | Adj P-value | Log2FC | Malignancy |
| 5436 | POLR2G | GSM4909281 | Human | Breast | IDC | 7.32e-08 | 3.01e-01 | 0.21 |
| 5436 | POLR2G | GSM4909285 | Human | Breast | IDC | 1.45e-07 | 3.17e-01 | 0.21 |
| 5436 | POLR2G | GSM4909286 | Human | Breast | IDC | 2.71e-02 | 9.60e-02 | 0.1081 |
| 5436 | POLR2G | GSM4909290 | Human | Breast | IDC | 1.48e-03 | 2.66e-01 | 0.2096 |
| 5436 | POLR2G | GSM4909291 | Human | Breast | IDC | 8.03e-03 | 2.64e-01 | 0.1753 |
| 5436 | POLR2G | GSM4909293 | Human | Breast | IDC | 4.25e-02 | 1.36e-01 | 0.1581 |
| 5436 | POLR2G | GSM4909296 | Human | Breast | IDC | 2.17e-04 | 2.90e-01 | 0.1524 |
| 5436 | POLR2G | GSM4909304 | Human | Breast | IDC | 1.89e-02 | 2.54e-01 | 0.1636 |
| 5436 | POLR2G | GSM4909305 | Human | Breast | IDC | 3.00e-06 | 2.92e-01 | 0.0436 |
| 5436 | POLR2G | GSM4909307 | Human | Breast | IDC | 4.84e-02 | 2.78e-01 | 0.1569 |
| 5436 | POLR2G | GSM4909308 | Human | Breast | IDC | 2.56e-06 | 2.80e-01 | 0.158 |
| 5436 | POLR2G | GSM4909311 | Human | Breast | IDC | 1.55e-11 | -2.09e-02 | 0.1534 |
| 5436 | POLR2G | GSM4909317 | Human | Breast | IDC | 3.04e-04 | 2.03e-01 | 0.1355 |
| 5436 | POLR2G | GSM4909319 | Human | Breast | IDC | 1.09e-22 | 2.72e-02 | 0.1563 |
| 5436 | POLR2G | GSM4909320 | Human | Breast | IDC | 1.38e-02 | 1.58e-01 | 0.1575 |
| 5436 | POLR2G | GSM4909321 | Human | Breast | IDC | 1.26e-09 | 3.13e-01 | 0.1559 |
| 5436 | POLR2G | brca1 | Human | Breast | Precancer | 1.17e-06 | 3.10e-01 | -0.0338 |
| 5436 | POLR2G | brca2 | Human | Breast | Precancer | 9.35e-09 | 3.09e-01 | -0.024 |
| 5436 | POLR2G | brca3 | Human | Breast | Precancer | 2.84e-02 | 1.94e-01 | -0.0263 |
| 5436 | POLR2G | M2 | Human | Breast | IDC | 4.18e-08 | 5.69e-01 | 0.21 |
| Page: 1 2 3 4 5 6 7 8 9 10 |
| Tissue | Expression Dynamics | Abbreviation |
| Breast | 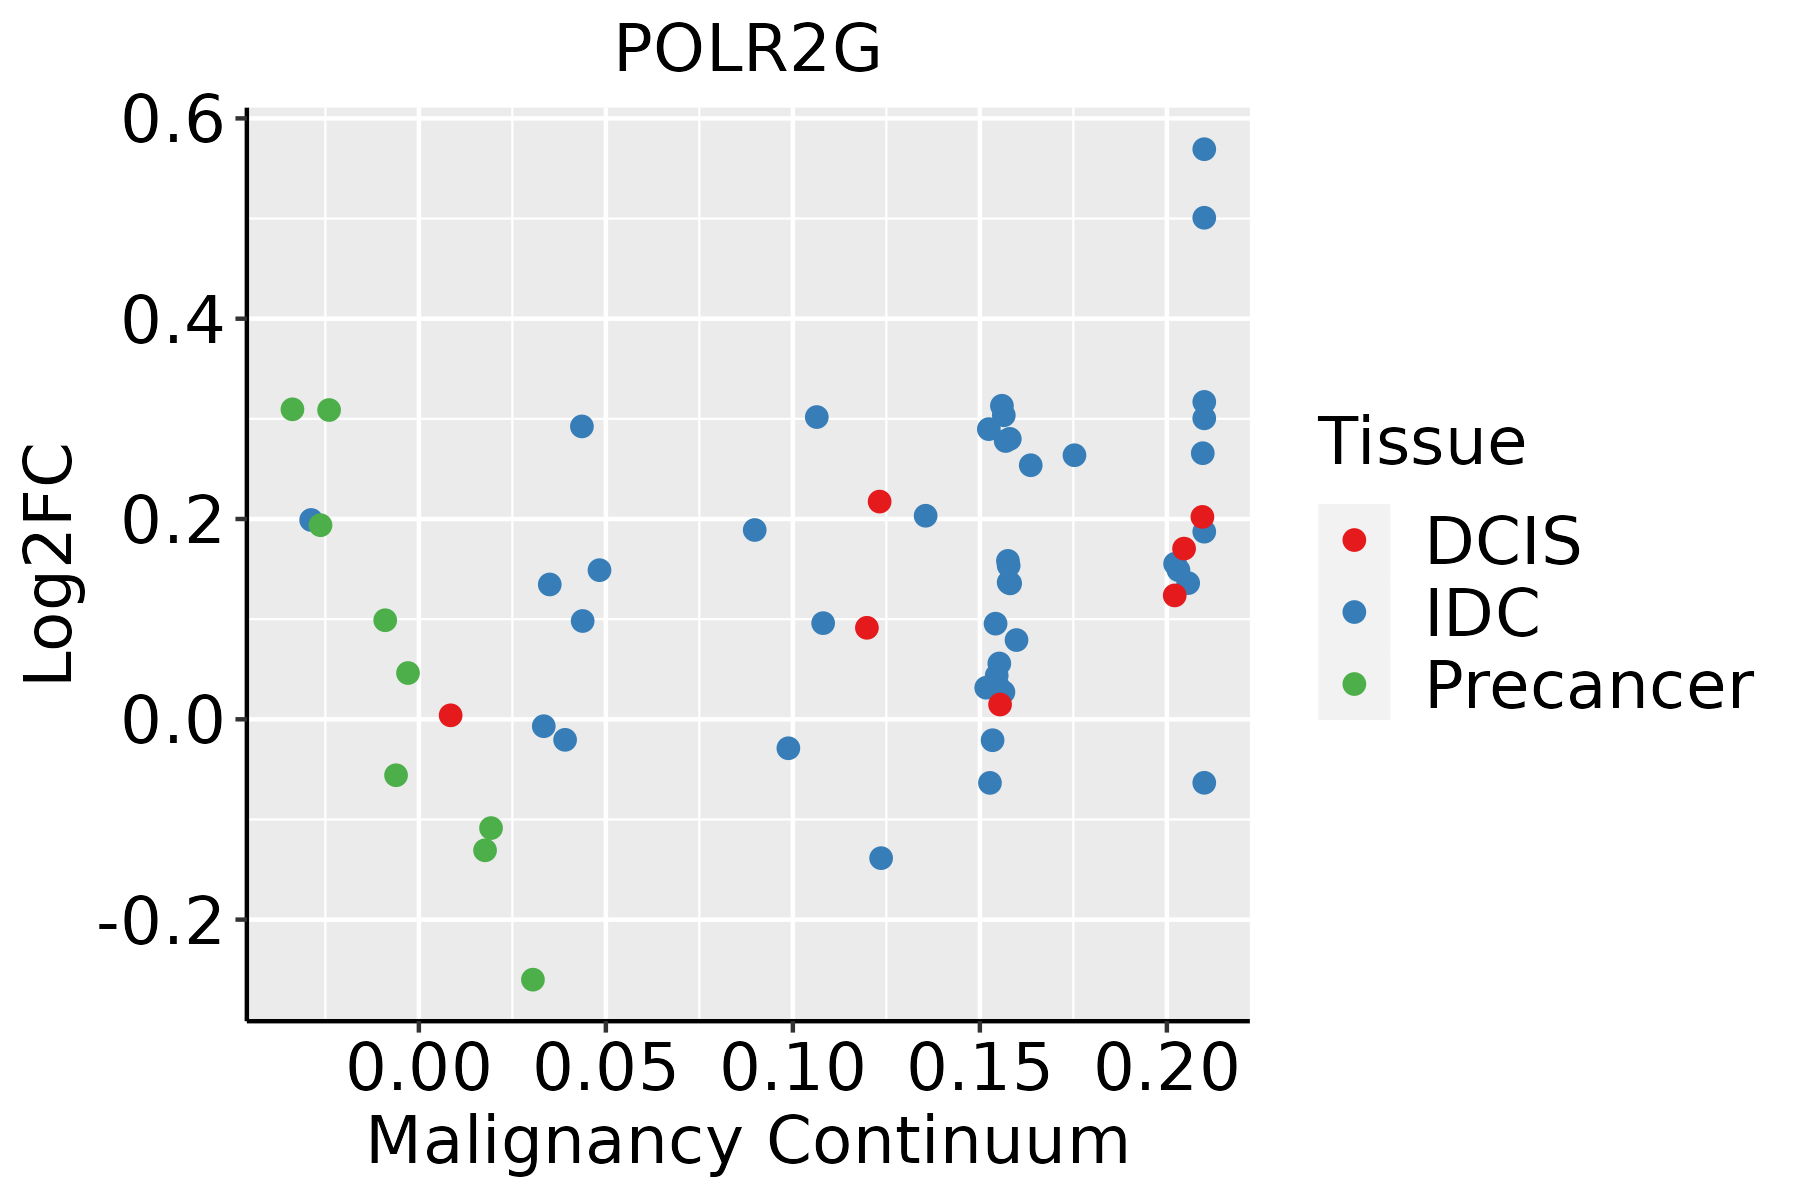 | IDC: Invasive ductal carcinoma |
| DCIS: Ductal carcinoma in situ | ||
| Precancer(BRCA1-mut): Precancerous lesion from BRCA1 mutation carriers | ||
| Colorectum (GSE201348) | 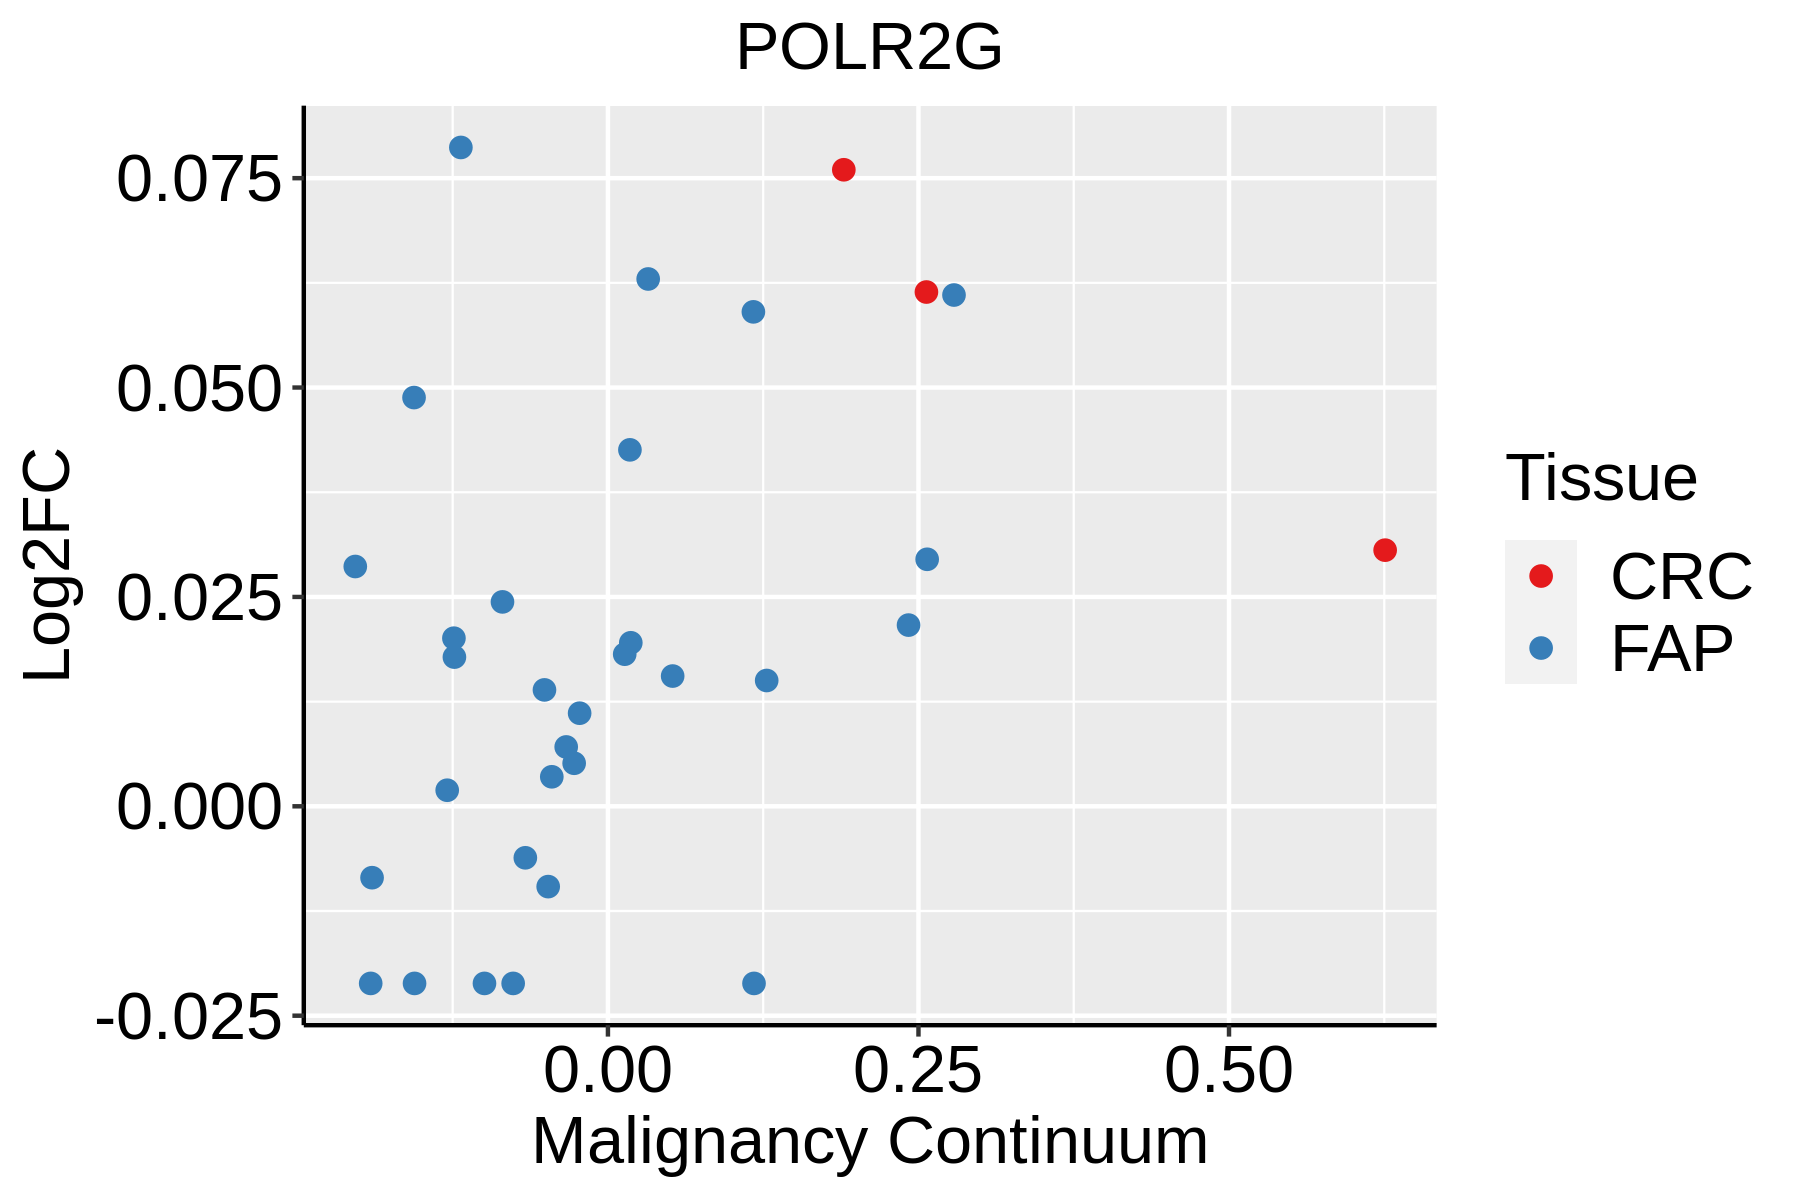 | FAP: Familial adenomatous polyposis |
| CRC: Colorectal cancer | ||
| Colorectum (HTA11) |  | AD: Adenomas |
| SER: Sessile serrated lesions | ||
| MSI-H: Microsatellite-high colorectal cancer | ||
| MSS: Microsatellite stable colorectal cancer | ||
| Endometrium | 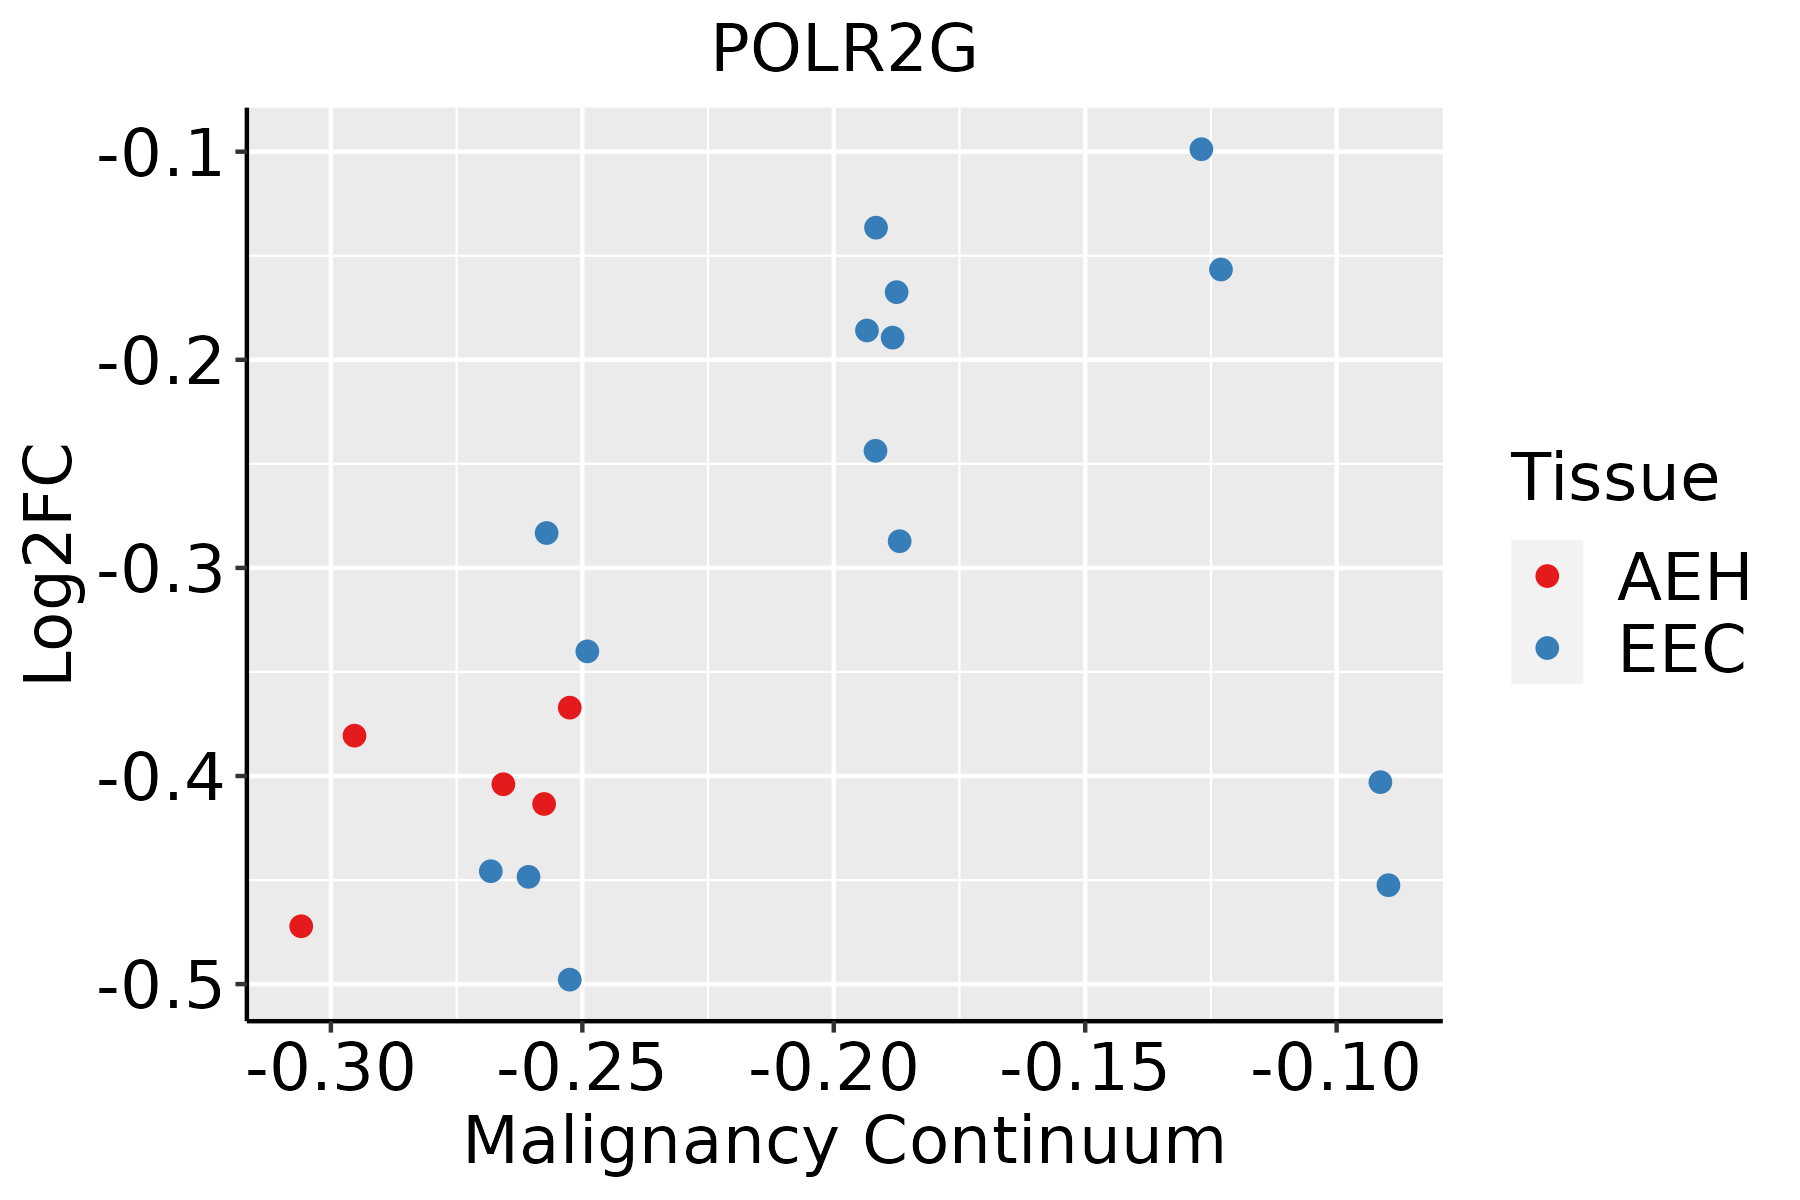 | AEH: Atypical endometrial hyperplasia |
| EEC: Endometrioid Cancer | ||
| Esophagus |  | ESCC: Esophageal squamous cell carcinoma |
| HGIN: High-grade intraepithelial neoplasias | ||
| LGIN: Low-grade intraepithelial neoplasias | ||
| Liver |  | HCC: Hepatocellular carcinoma |
| NAFLD: Non-alcoholic fatty liver disease | ||
| Oral Cavity | 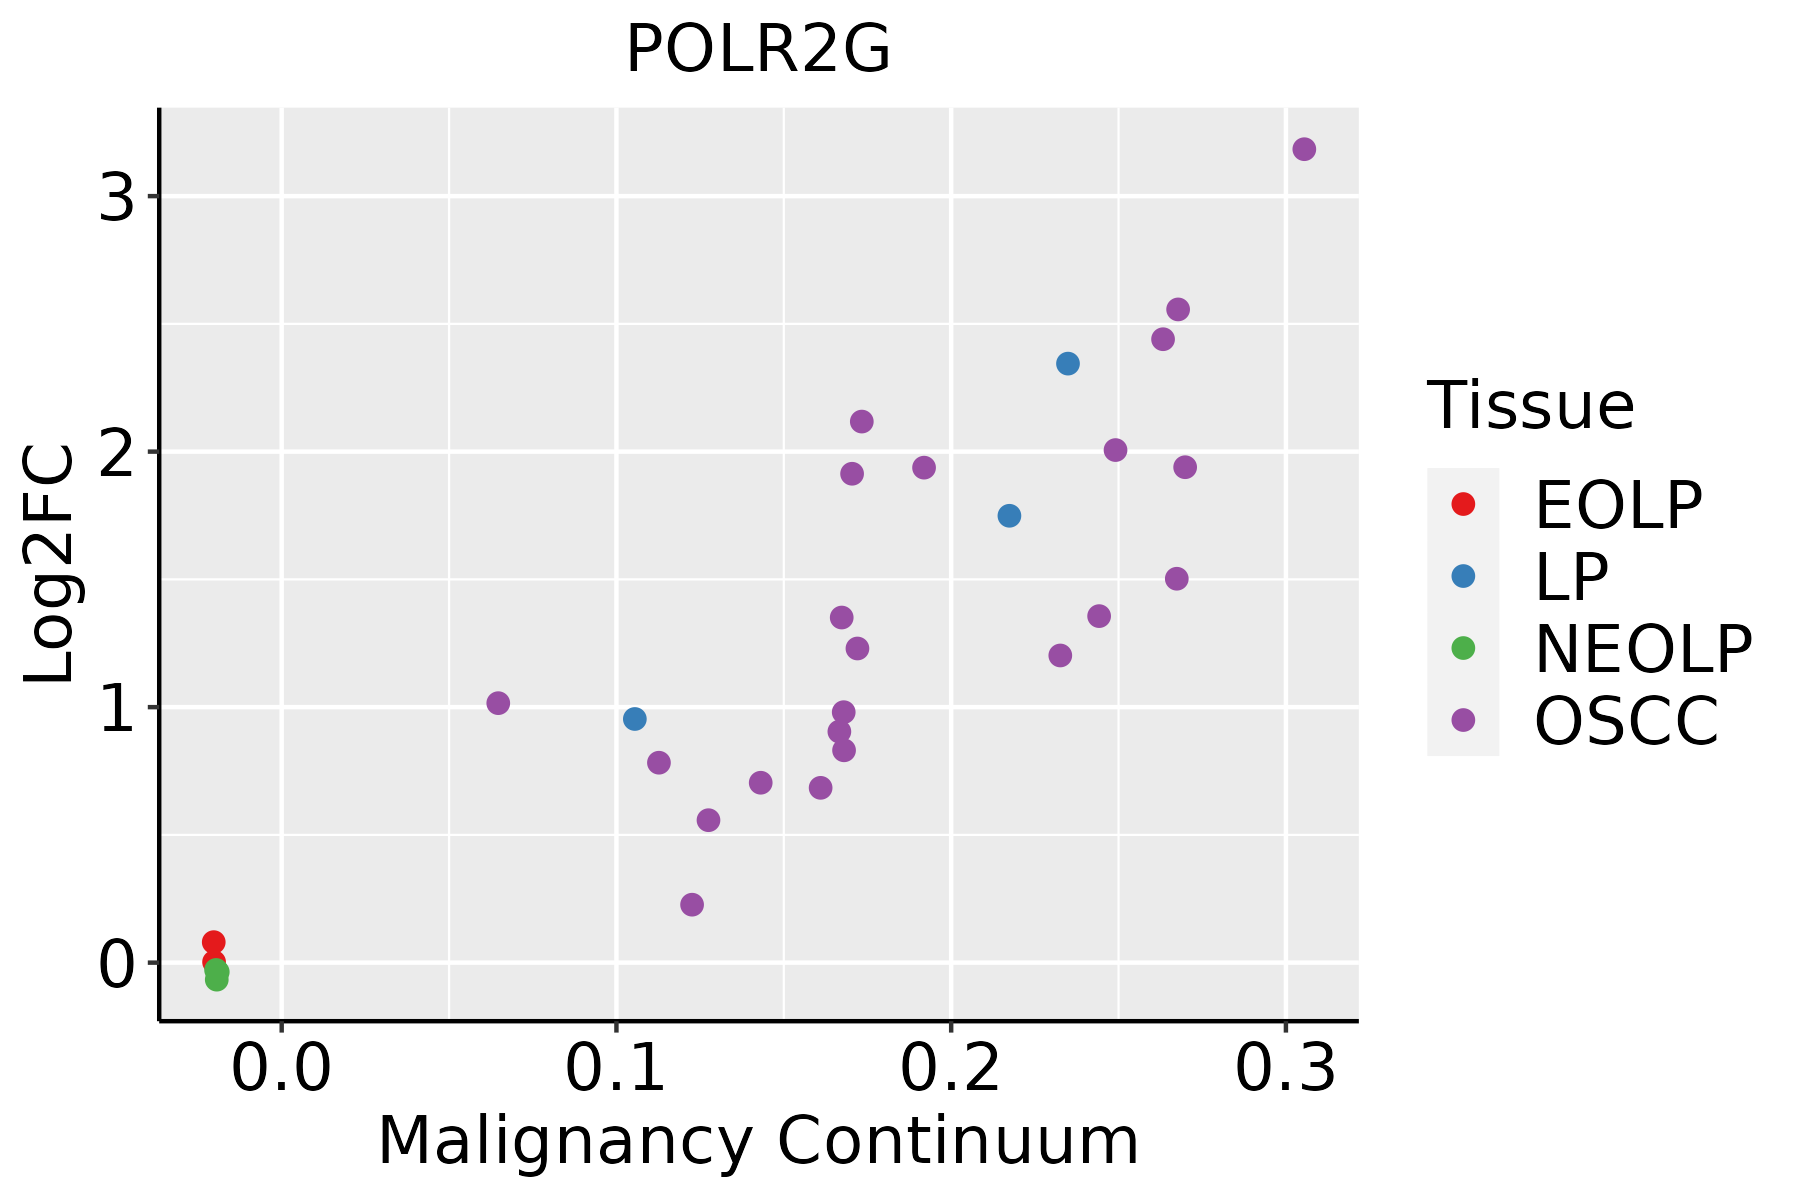 | EOLP: Erosive Oral lichen planus |
| LP: leukoplakia | ||
| NEOLP: Non-erosive oral lichen planus | ||
| OSCC: Oral squamous cell carcinoma | ||
| Prostate | 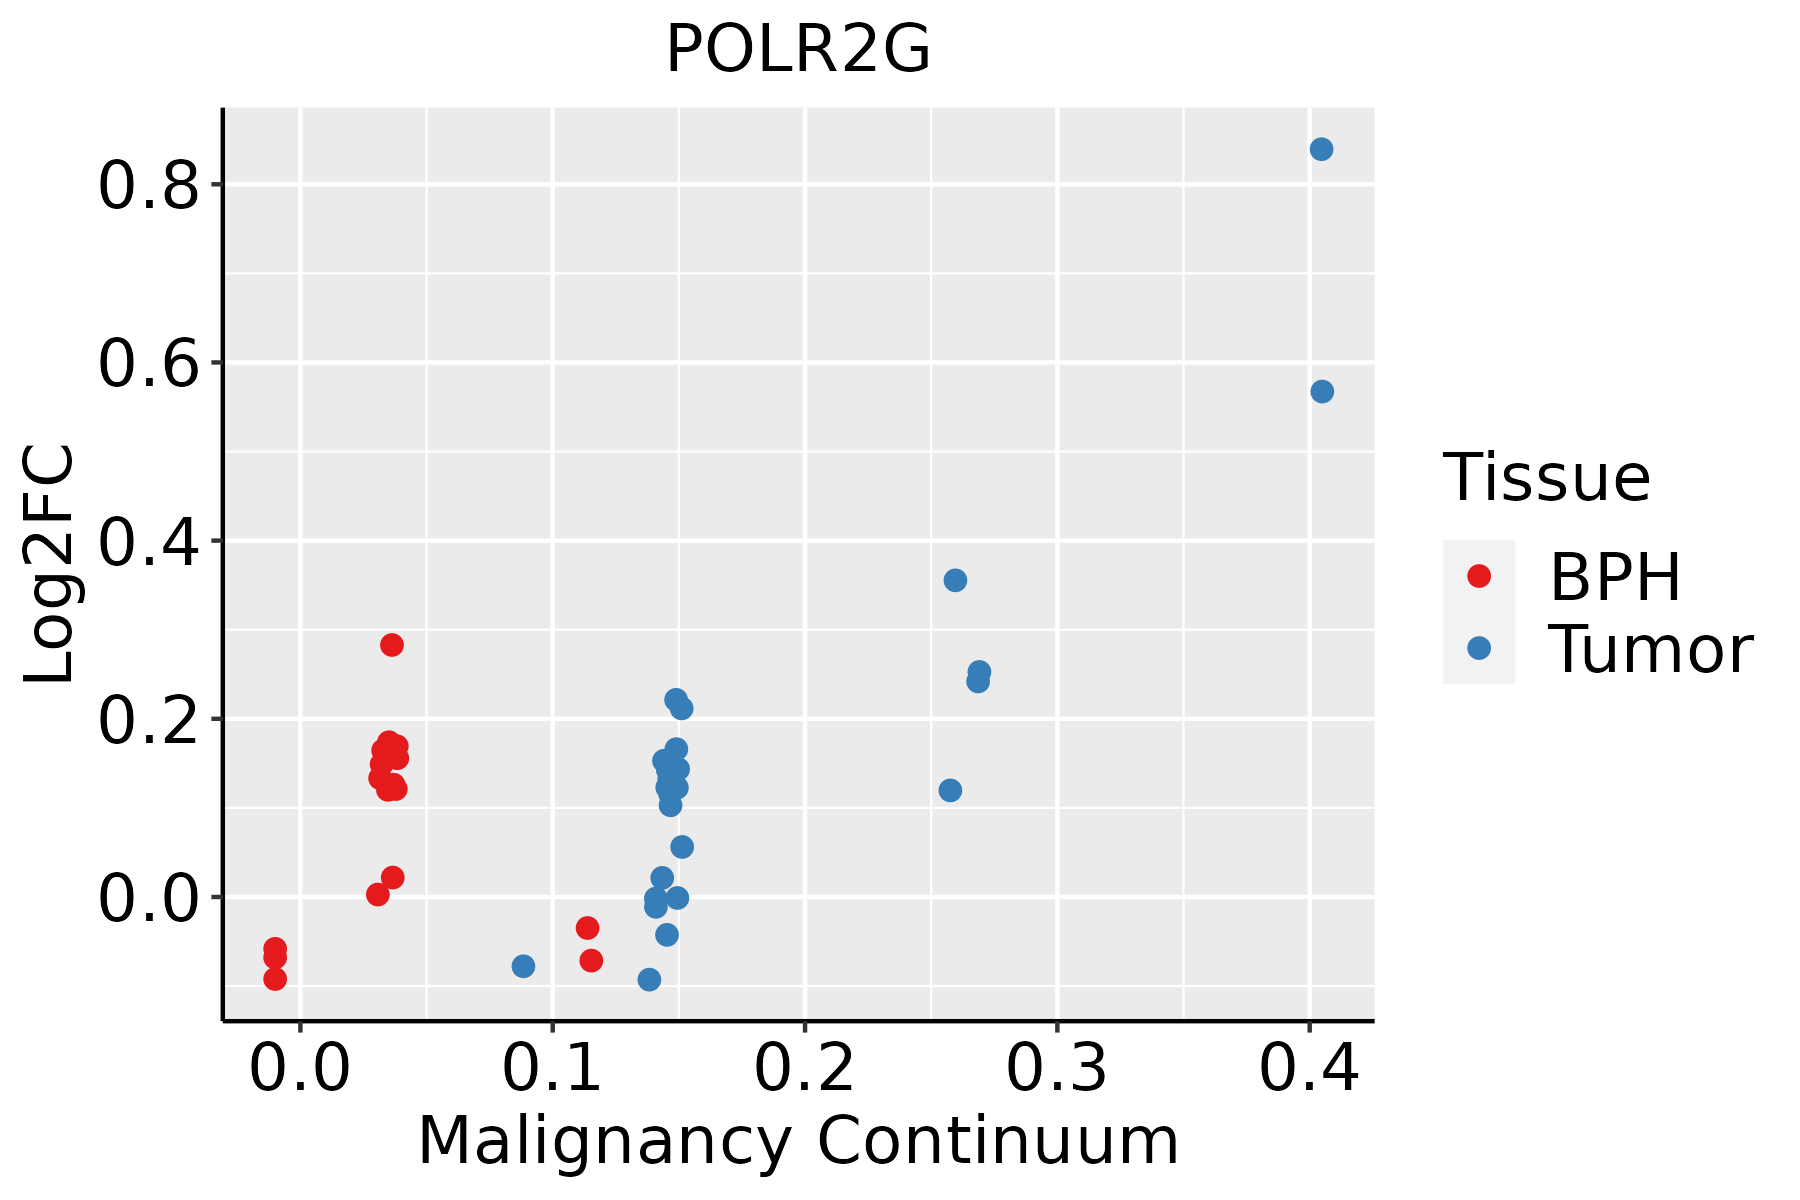 | BPH: Benign Prostatic Hyperplasia |
| Skin | 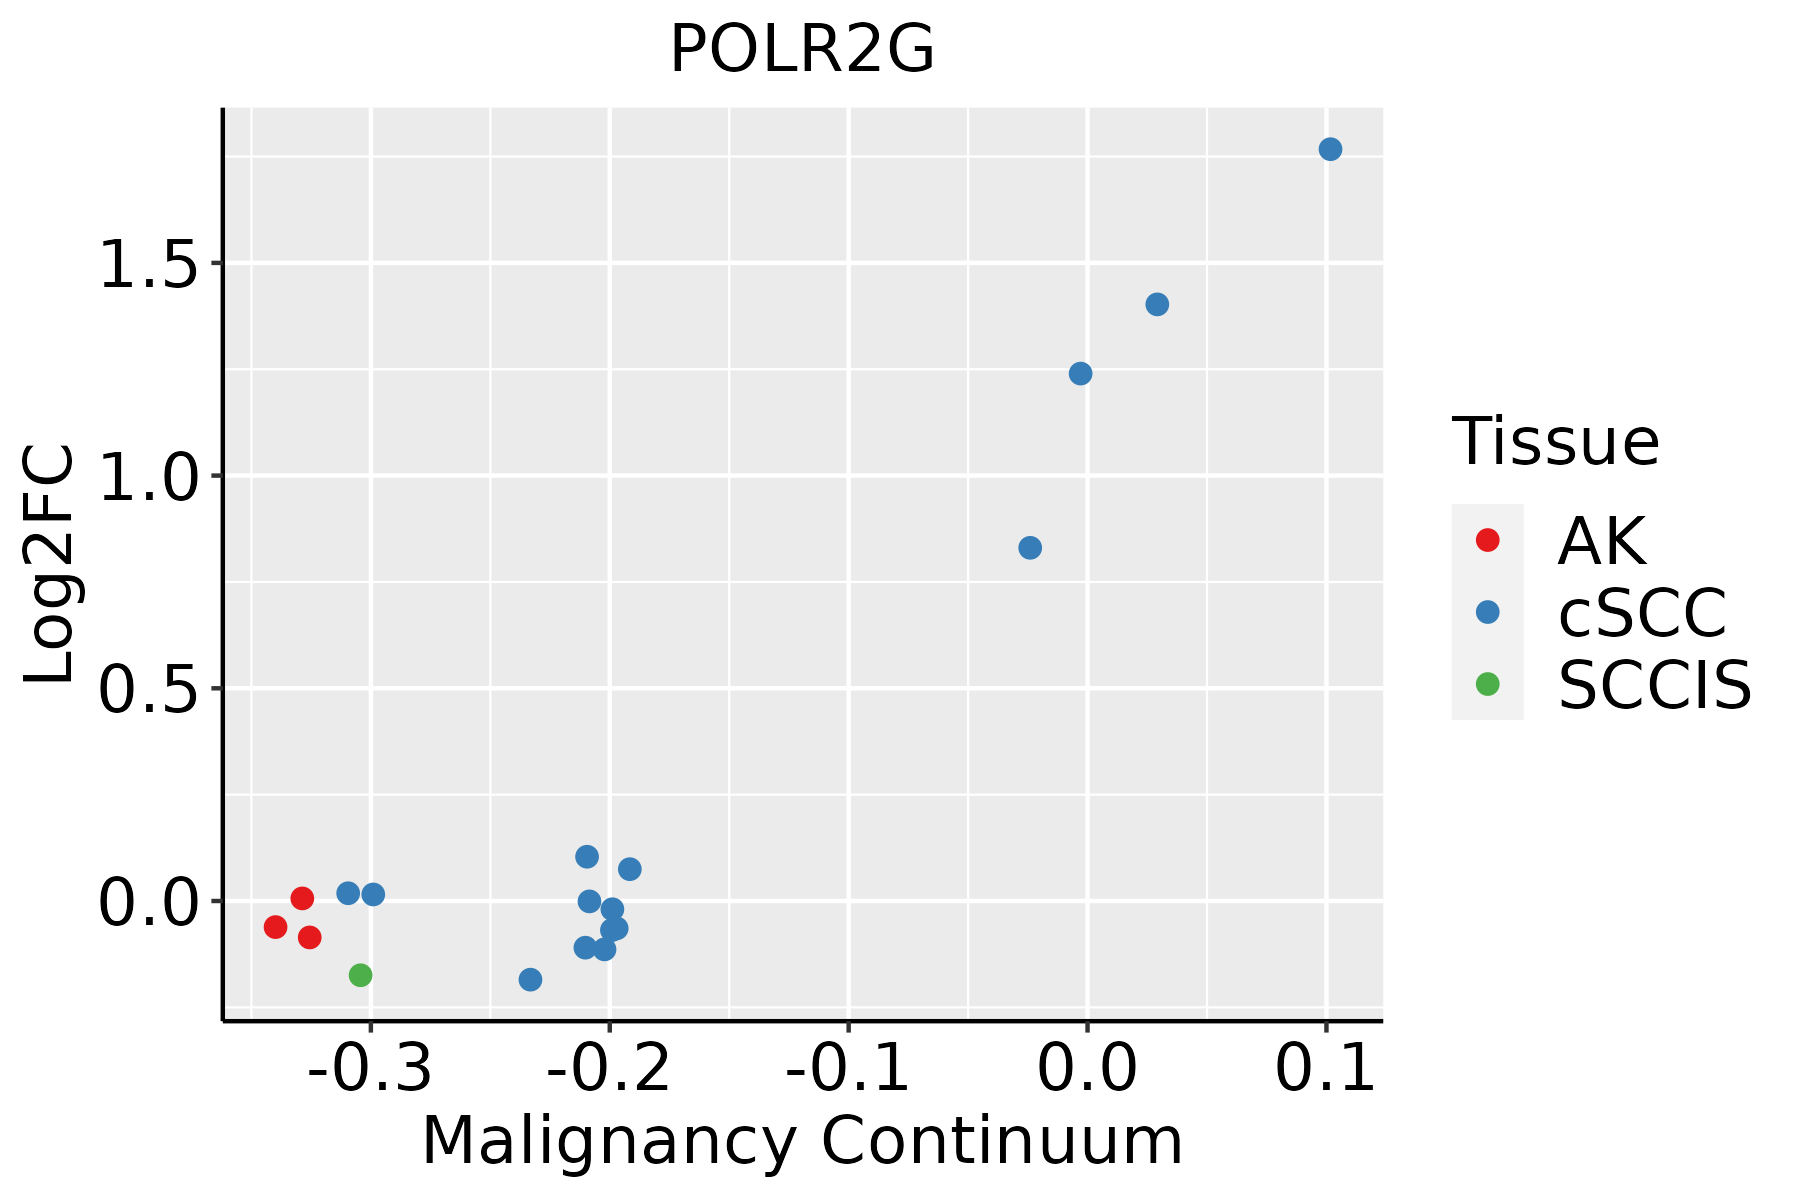 | AK: Actinic keratosis |
| cSCC: Cutaneous squamous cell carcinoma | ||
| SCCIS:squamous cell carcinoma in situ | ||
| Thyroid | 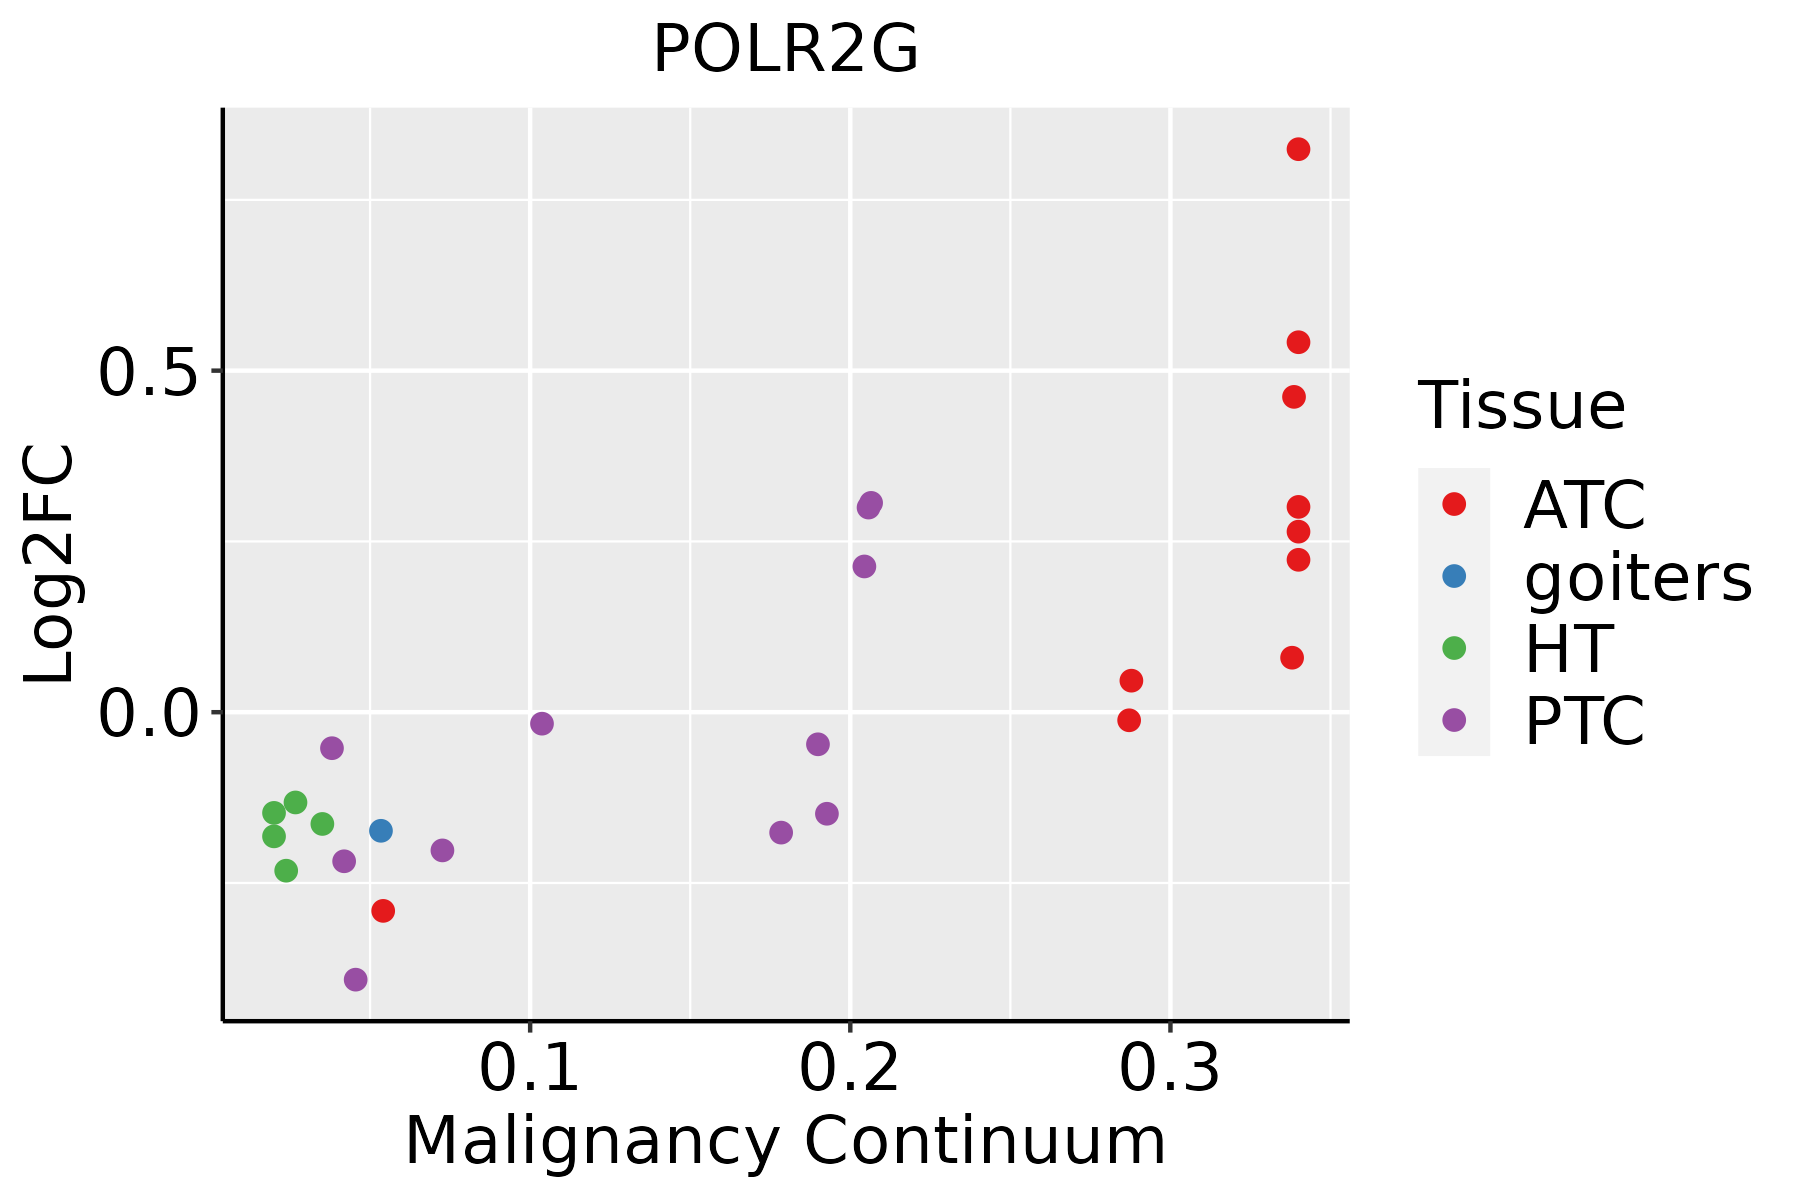 | ATC: Anaplastic thyroid cancer |
| HT: Hashimoto's thyroiditis | ||
| PTC: Papillary thyroid cancer |
| ∗log2FC in expression of this searched gene in stem-like cells from each diseased tissue sample relative to stem-like cells in normal samples in each tissue plotted against the malignancy continuum. Samples are colored based on if they are from different disease stage. |
Top |
Malignant transformation related pathway analysis |
| Find out the enriched GO biological processes and KEGG pathways involved in transition from healthy to precancer to cancer |
| Tissue | Disease Stage | Enriched GO biological Processes |
| Colorectum | AD |  |
| Colorectum | SER |  |
| Colorectum | MSS |  |
| Colorectum | MSI-H |  |
| Colorectum | FAP |  |
| ∗Top 15 enriched GO BP terms are showed in the bar plot of each disease state in each tissue. Each row represents a significant GO biological process which is colored according to the -log10(p.adjust). |
| Page: 1 2 3 4 5 6 7 8 9 |
| GO ID | Tissue | Disease Stage | Description | Gene Ratio | Bg Ratio | pvalue | p.adjust | Count |
| GO:00064138 | Breast | Precancer | translational initiation | 30/1080 | 118/18723 | 3.23e-12 | 5.58e-10 | 30 |
| GO:00064179 | Breast | Precancer | regulation of translation | 67/1080 | 468/18723 | 4.71e-12 | 7.64e-10 | 67 |
| GO:00457279 | Breast | Precancer | positive regulation of translation | 32/1080 | 136/18723 | 5.89e-12 | 9.27e-10 | 32 |
| GO:00342509 | Breast | Precancer | positive regulation of cellular amide metabolic process | 33/1080 | 162/18723 | 1.72e-10 | 1.77e-08 | 33 |
| GO:00064466 | Breast | Precancer | regulation of translational initiation | 19/1080 | 79/18723 | 7.99e-08 | 4.60e-06 | 19 |
| GO:19033118 | Breast | Precancer | regulation of mRNA metabolic process | 38/1080 | 288/18723 | 1.63e-06 | 5.97e-05 | 38 |
| GO:00064028 | Breast | Precancer | mRNA catabolic process | 31/1080 | 232/18723 | 1.12e-05 | 2.93e-04 | 31 |
| GO:00064018 | Breast | Precancer | RNA catabolic process | 34/1080 | 278/18723 | 2.88e-05 | 6.39e-04 | 34 |
| GO:00346558 | Breast | Precancer | nucleobase-containing compound catabolic process | 42/1080 | 407/18723 | 1.91e-04 | 3.06e-03 | 42 |
| GO:00098969 | Breast | Precancer | positive regulation of catabolic process | 48/1080 | 492/18723 | 2.62e-04 | 3.84e-03 | 48 |
| GO:00313319 | Breast | Precancer | positive regulation of cellular catabolic process | 43/1080 | 427/18723 | 2.75e-04 | 4.00e-03 | 43 |
| GO:00467007 | Breast | Precancer | heterocycle catabolic process | 44/1080 | 445/18723 | 3.49e-04 | 4.88e-03 | 44 |
| GO:00442708 | Breast | Precancer | cellular nitrogen compound catabolic process | 44/1080 | 451/18723 | 4.64e-04 | 6.12e-03 | 44 |
| GO:00602138 | Breast | Precancer | positive regulation of nuclear-transcribed mRNA poly(A) tail shortening | 5/1080 | 13/18723 | 5.51e-04 | 7.05e-03 | 5 |
| GO:00009566 | Breast | Precancer | nuclear-transcribed mRNA catabolic process | 16/1080 | 112/18723 | 6.87e-04 | 8.36e-03 | 16 |
| GO:00194397 | Breast | Precancer | aromatic compound catabolic process | 44/1080 | 467/18723 | 9.55e-04 | 1.07e-02 | 44 |
| GO:00602118 | Breast | Precancer | regulation of nuclear-transcribed mRNA poly(A) tail shortening | 5/1080 | 15/18723 | 1.17e-03 | 1.26e-02 | 5 |
| GO:19013617 | Breast | Precancer | organic cyclic compound catabolic process | 45/1080 | 495/18723 | 1.73e-03 | 1.74e-02 | 45 |
| GO:00434888 | Breast | Precancer | regulation of mRNA stability | 19/1080 | 158/18723 | 1.92e-03 | 1.86e-02 | 19 |
| GO:00610138 | Breast | Precancer | regulation of mRNA catabolic process | 19/1080 | 166/18723 | 3.36e-03 | 2.83e-02 | 19 |
| Page: 1 2 3 4 5 6 7 8 9 10 11 12 13 14 15 16 17 18 19 20 21 22 23 24 25 26 27 |
| Pathway ID | Tissue | Disease Stage | Description | Gene Ratio | Bg Ratio | pvalue | p.adjust | qvalue | Count |
| hsa0501616 | Breast | Precancer | Huntington disease | 98/684 | 306/8465 | 2.85e-35 | 2.25e-33 | 1.72e-33 | 98 |
| hsa0501617 | Breast | Precancer | Huntington disease | 98/684 | 306/8465 | 2.85e-35 | 2.25e-33 | 1.72e-33 | 98 |
| hsa0501623 | Breast | IDC | Huntington disease | 103/867 | 306/8465 | 5.14e-30 | 4.17e-28 | 3.12e-28 | 103 |
| hsa0501633 | Breast | IDC | Huntington disease | 103/867 | 306/8465 | 5.14e-30 | 4.17e-28 | 3.12e-28 | 103 |
| hsa0501643 | Breast | DCIS | Huntington disease | 101/846 | 306/8465 | 1.54e-29 | 1.24e-27 | 9.13e-28 | 101 |
| hsa0501653 | Breast | DCIS | Huntington disease | 101/846 | 306/8465 | 1.54e-29 | 1.24e-27 | 9.13e-28 | 101 |
| hsa05016 | Colorectum | AD | Huntington disease | 147/2092 | 306/8465 | 1.93e-19 | 9.26e-18 | 5.91e-18 | 147 |
| hsa050161 | Colorectum | AD | Huntington disease | 147/2092 | 306/8465 | 1.93e-19 | 9.26e-18 | 5.91e-18 | 147 |
| hsa050162 | Colorectum | SER | Huntington disease | 127/1580 | 306/8465 | 3.29e-21 | 1.37e-19 | 9.92e-20 | 127 |
| hsa050163 | Colorectum | SER | Huntington disease | 127/1580 | 306/8465 | 3.29e-21 | 1.37e-19 | 9.92e-20 | 127 |
| hsa050164 | Colorectum | MSS | Huntington disease | 141/1875 | 306/8465 | 2.90e-21 | 1.62e-19 | 9.92e-20 | 141 |
| hsa050165 | Colorectum | MSS | Huntington disease | 141/1875 | 306/8465 | 2.90e-21 | 1.62e-19 | 9.92e-20 | 141 |
| hsa050166 | Colorectum | MSI-H | Huntington disease | 83/797 | 306/8465 | 7.06e-20 | 3.81e-18 | 3.20e-18 | 83 |
| hsa050167 | Colorectum | MSI-H | Huntington disease | 83/797 | 306/8465 | 7.06e-20 | 3.81e-18 | 3.20e-18 | 83 |
| hsa0501620 | Endometrium | AEH | Huntington disease | 118/1197 | 306/8465 | 3.00e-27 | 2.44e-25 | 1.78e-25 | 118 |
| hsa05016110 | Endometrium | AEH | Huntington disease | 118/1197 | 306/8465 | 3.00e-27 | 2.44e-25 | 1.78e-25 | 118 |
| hsa0501625 | Endometrium | EEC | Huntington disease | 120/1237 | 306/8465 | 3.86e-27 | 4.23e-25 | 3.15e-25 | 120 |
| hsa0501635 | Endometrium | EEC | Huntington disease | 120/1237 | 306/8465 | 3.86e-27 | 4.23e-25 | 3.15e-25 | 120 |
| hsa0501630 | Esophagus | HGIN | Huntington disease | 129/1383 | 306/8465 | 6.81e-28 | 7.41e-26 | 5.88e-26 | 129 |
| hsa034205 | Esophagus | HGIN | Nucleotide excision repair | 29/1383 | 63/8465 | 2.96e-08 | 5.36e-07 | 4.26e-07 | 29 |
| Page: 1 2 3 |
Top |
Cell-cell communication analysis |
| Identification of potential cell-cell interactions between two cell types and their ligand-receptor pairs for different disease states |
| Ligand | Receptor | LRpair | Pathway | Tissue | Disease Stage |
| Page: 1 |
Top |
Single-cell gene regulatory network inference analysis |
| Find out the significant the regulons (TFs) and the target genes of each regulon across cell types for different disease states |
| TF | Cell Type | Tissue | Disease Stage | Target Gene | RSS | Regulon Activity |
| ∗The dot plots of a searched regulon are shown for all cell subpopulations in each disease state of each tissue based on the regulon specific score inferred using pySCENIC and by calculating the average expression. |
| Page: 1 |
Top |
Somatic mutation of malignant transformation related genes |
| Annotation of somatic variants for genes involved in malignant transformation |
| Hugo Symbol | Variant Class | Variant Classification | dbSNP RS | HGVSc | HGVSp | HGVSp Short | SWISSPROT | BIOTYPE | SIFT | PolyPhen | Tumor Sample Barcode | Tissue | Histology | Sex | Age | Stage | Therapy Types | Drugs | Outcome |
| POLR2G | SNV | Missense_Mutation | novel | c.158N>C | p.Asn53Thr | p.N53T | P62487 | protein_coding | tolerated(0.18) | benign(0.003) | TCGA-A5-A2K5-01 | Endometrium | uterine corpus endometrioid carcinoma | Female | >=65 | I/II | Unknown | Unknown | SD |
| POLR2G | SNV | Missense_Mutation | novel | c.62A>G | p.Asn21Ser | p.N21S | P62487 | protein_coding | tolerated(0.13) | benign(0.02) | TCGA-B5-A1MR-01 | Endometrium | uterine corpus endometrioid carcinoma | Female | >=65 | III/IV | Unknown | Unknown | SD |
| POLR2G | SNV | Missense_Mutation | rs766011367 | c.219N>T | p.Lys73Asn | p.K73N | P62487 | protein_coding | deleterious(0.02) | benign(0.374) | TCGA-B5-A3FC-01 | Endometrium | uterine corpus endometrioid carcinoma | Female | <65 | I/II | Unknown | Unknown | SD |
| POLR2G | SNV | Missense_Mutation | novel | c.467N>G | p.Asp156Gly | p.D156G | P62487 | protein_coding | tolerated(0.13) | benign(0.029) | TCGA-EO-A22R-01 | Endometrium | uterine corpus endometrioid carcinoma | Female | <65 | I/II | Unknown | Unknown | SD |
| POLR2G | SNV | Missense_Mutation | novel | c.30N>C | p.Glu10Asp | p.E10D | P62487 | protein_coding | tolerated(0.32) | benign(0.003) | TCGA-EO-A3B0-01 | Endometrium | uterine corpus endometrioid carcinoma | Female | <65 | III/IV | Unknown | Unknown | SD |
| POLR2G | SNV | Missense_Mutation | c.511G>T | p.Val171Leu | p.V171L | P62487 | protein_coding | tolerated(0.29) | benign(0) | TCGA-DD-A3A8-01 | Liver | liver hepatocellular carcinoma | Male | >=65 | I/II | Unknown | Unknown | SD | |
| POLR2G | SNV | Missense_Mutation | c.344N>T | p.Ser115Leu | p.S115L | P62487 | protein_coding | tolerated(0.14) | benign(0.038) | TCGA-05-4389-01 | Lung | lung adenocarcinoma | Male | >=65 | I/II | Unknown | Unknown | SD | |
| POLR2G | SNV | Missense_Mutation | novel | c.163N>T | p.Gly55Cys | p.G55C | P62487 | protein_coding | deleterious(0) | probably_damaging(0.999) | TCGA-05-4396-01 | Lung | lung adenocarcinoma | Male | >=65 | III/IV | Unknown | Unknown | SD |
| POLR2G | deletion | Frame_Shift_Del | novel | c.369delC | p.Asn124ThrfsTer13 | p.N124Tfs*13 | P62487 | protein_coding | TCGA-46-3769-01 | Lung | lung squamous cell carcinoma | Male | <65 | III/IV | Chemotherapy | cisplatin | SD | ||
| POLR2G | SNV | Missense_Mutation | c.344N>T | p.Ser115Leu | p.S115L | P62487 | protein_coding | tolerated(0.14) | benign(0.038) | TCGA-CV-6933-01 | Oral cavity | head & neck squamous cell carcinoma | Male | <65 | III/IV | Unknown | Unknown | SD |
| Page: 1 2 |
Top |
Related drugs of malignant transformation related genes |
| Identification of chemicals and drugs interact with genes involved in malignant transfromation |
| (DGIdb 4.0) |
| Entrez ID | Symbol | Category | Interaction Types | Drug Claim Name | Drug Name | PMIDs |
| Page: 1 |

Copyright 2023-Present -The University of Texas Health Science Center at Houston |