
|
|||||
|
 | |
| |
| |
| |
| |
| |
|
Gene: POLR2F |
Gene summary for POLR2F |
| Gene information | Species | Human | Gene symbol | POLR2F | Gene ID | 5435 |
| Gene name | RNA polymerase II, I and III subunit F | |
| Gene Alias | HRBP14.4 | |
| Cytomap | 22q13.1 | |
| Gene Type | protein-coding | GO ID | GO:0006139 | UniProtAcc | B0QYL9 |
Top |
Malignant transformation analysis |
| Identification of the aberrant gene expression in precancerous and cancerous lesions by comparing the gene expression of stem-like cells in diseased tissues with normal stem cells |
| Entrez ID | Symbol | Replicates | Species | Organ | Tissue | Adj P-value | Log2FC | Malignancy |
| 5435 | POLR2F | GSM4909281 | Human | Breast | IDC | 6.54e-25 | 6.48e-01 | 0.21 |
| 5435 | POLR2F | GSM4909282 | Human | Breast | IDC | 1.60e-04 | 3.38e-01 | -0.0288 |
| 5435 | POLR2F | GSM4909285 | Human | Breast | IDC | 2.20e-04 | 2.51e-01 | 0.21 |
| 5435 | POLR2F | GSM4909286 | Human | Breast | IDC | 2.68e-40 | 7.56e-01 | 0.1081 |
| 5435 | POLR2F | GSM4909290 | Human | Breast | IDC | 7.71e-08 | 3.52e-01 | 0.2096 |
| 5435 | POLR2F | GSM4909293 | Human | Breast | IDC | 2.02e-02 | -2.08e-01 | 0.1581 |
| 5435 | POLR2F | GSM4909294 | Human | Breast | IDC | 7.84e-04 | -1.22e-01 | 0.2022 |
| 5435 | POLR2F | GSM4909296 | Human | Breast | IDC | 1.62e-10 | -1.41e-01 | 0.1524 |
| 5435 | POLR2F | GSM4909297 | Human | Breast | IDC | 4.93e-15 | -4.04e-02 | 0.1517 |
| 5435 | POLR2F | GSM4909307 | Human | Breast | IDC | 3.03e-02 | 2.75e-01 | 0.1569 |
| 5435 | POLR2F | GSM4909308 | Human | Breast | IDC | 1.31e-05 | 2.64e-01 | 0.158 |
| 5435 | POLR2F | GSM4909309 | Human | Breast | IDC | 3.16e-05 | 2.05e-01 | 0.0483 |
| 5435 | POLR2F | GSM4909311 | Human | Breast | IDC | 1.98e-36 | -8.76e-02 | 0.1534 |
| 5435 | POLR2F | GSM4909312 | Human | Breast | IDC | 8.81e-17 | -2.11e-02 | 0.1552 |
| 5435 | POLR2F | GSM4909313 | Human | Breast | IDC | 3.69e-03 | 8.25e-03 | 0.0391 |
| 5435 | POLR2F | GSM4909319 | Human | Breast | IDC | 1.62e-44 | -2.36e-01 | 0.1563 |
| 5435 | POLR2F | GSM4909320 | Human | Breast | IDC | 2.17e-10 | 4.17e-02 | 0.1575 |
| 5435 | POLR2F | GSM4909321 | Human | Breast | IDC | 1.16e-16 | -5.08e-02 | 0.1559 |
| 5435 | POLR2F | brca2 | Human | Breast | Precancer | 4.93e-02 | 2.09e-01 | -0.024 |
| 5435 | POLR2F | M2 | Human | Breast | IDC | 3.54e-02 | -5.27e-02 | 0.21 |
| Page: 1 2 3 4 5 6 7 8 9 10 11 12 |
| Tissue | Expression Dynamics | Abbreviation |
| Breast | 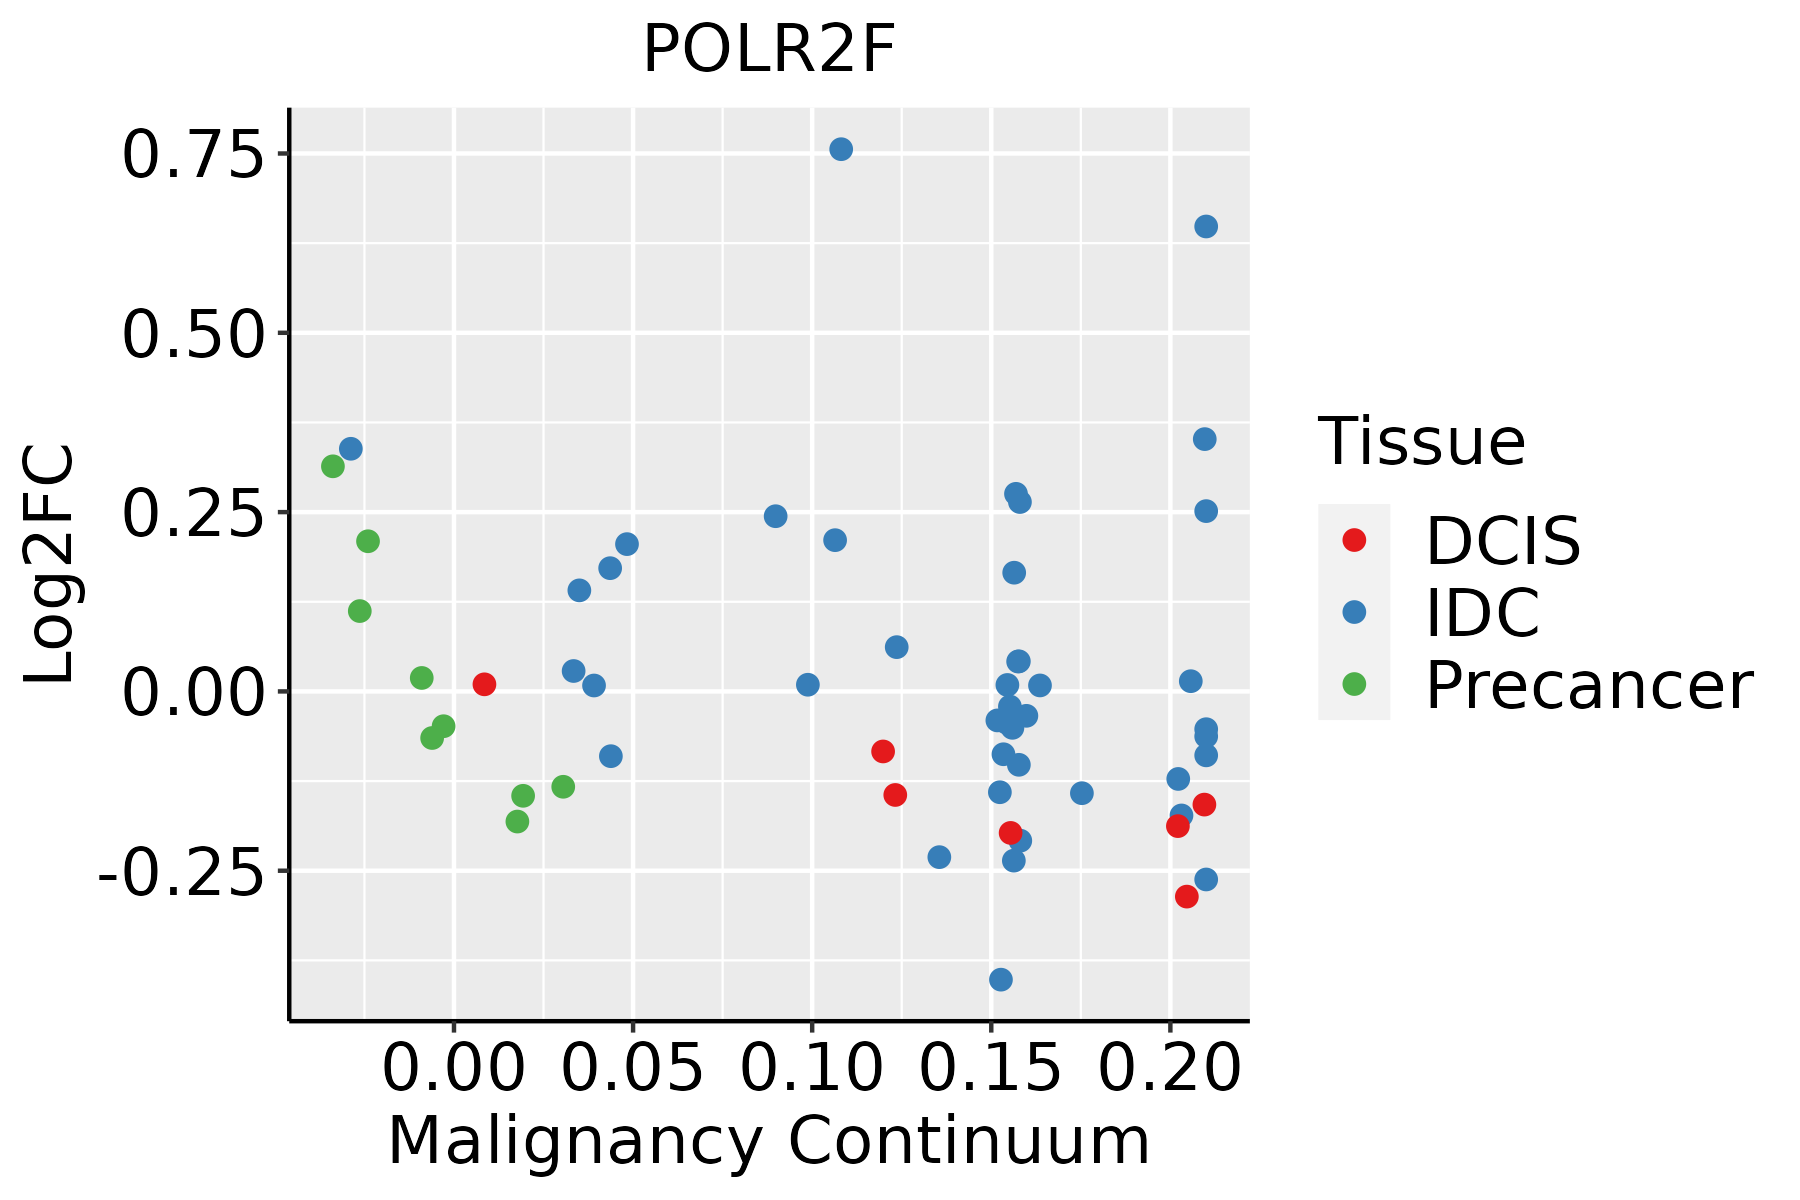 | IDC: Invasive ductal carcinoma |
| DCIS: Ductal carcinoma in situ | ||
| Precancer(BRCA1-mut): Precancerous lesion from BRCA1 mutation carriers | ||
| Endometrium | 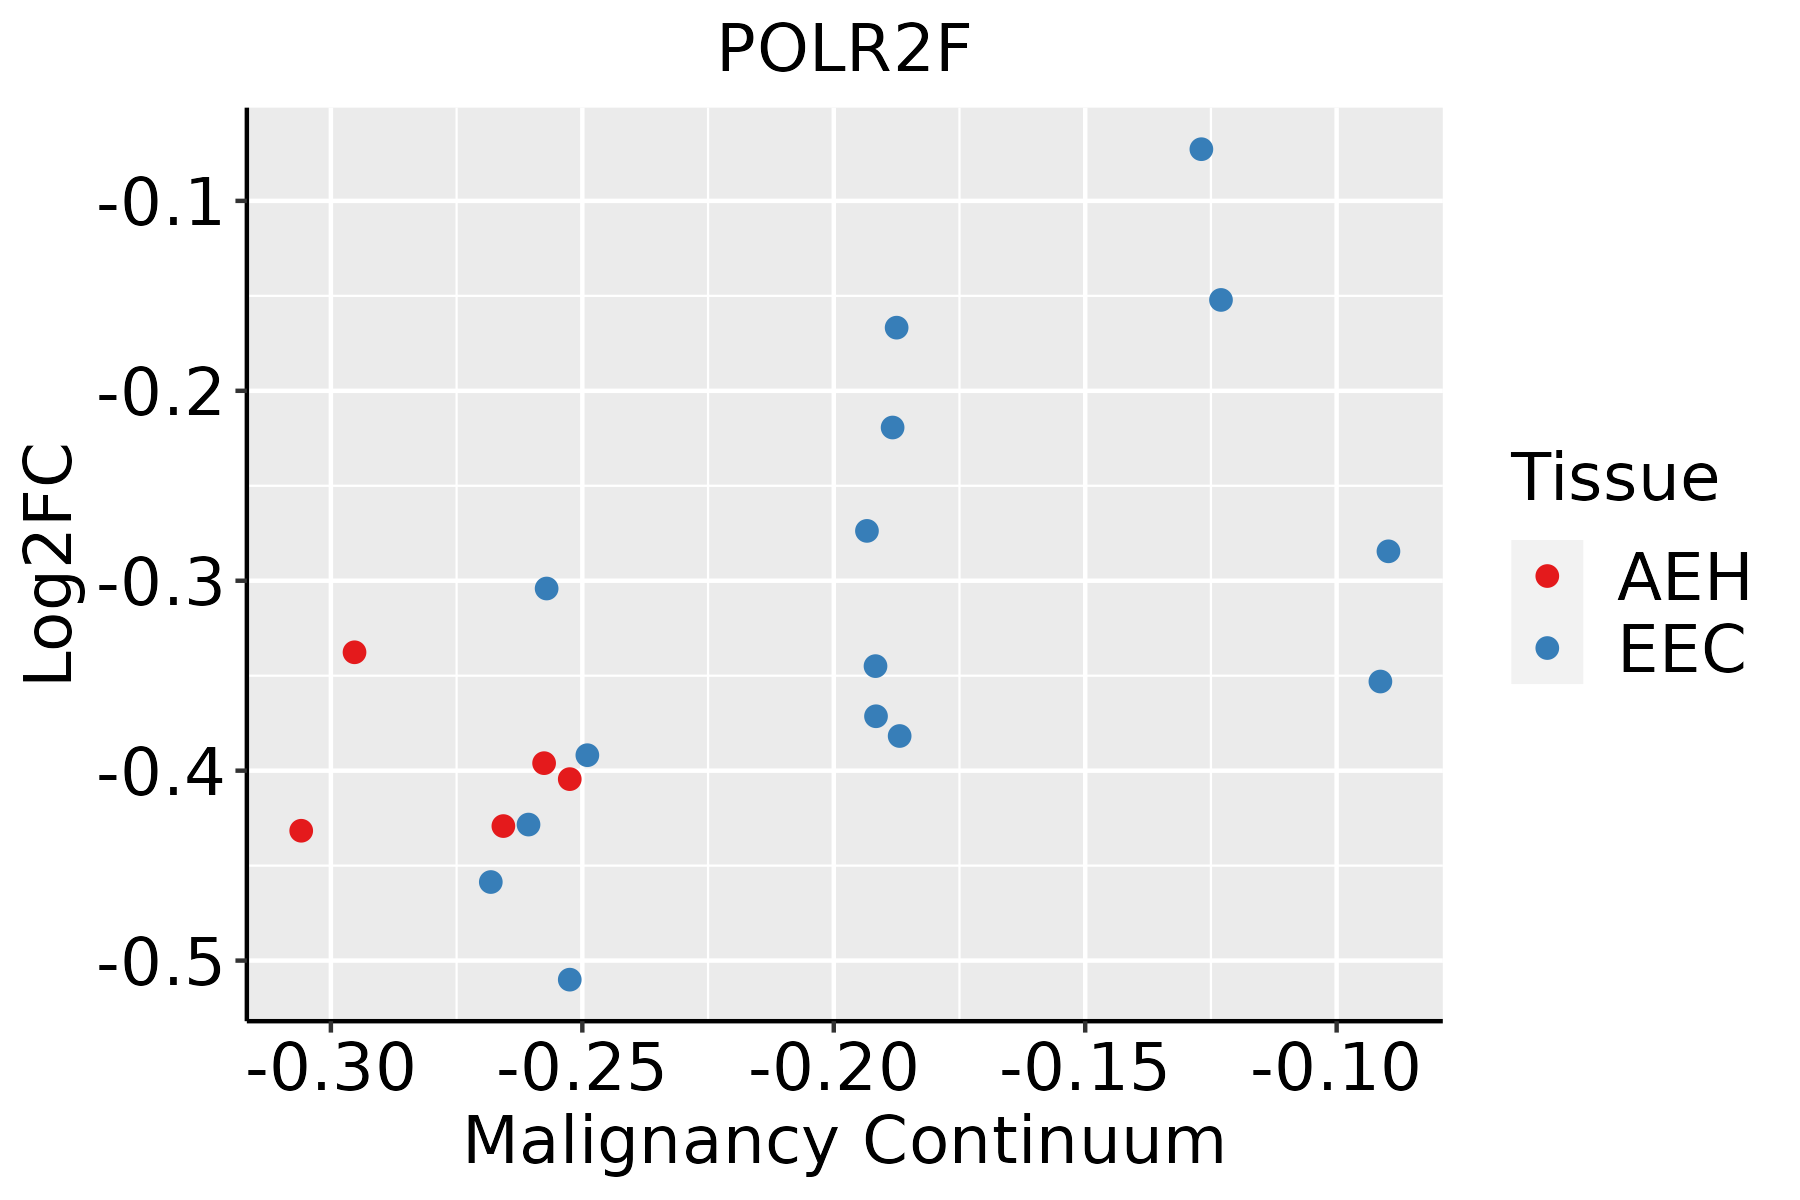 | AEH: Atypical endometrial hyperplasia |
| EEC: Endometrioid Cancer | ||
| Esophagus | 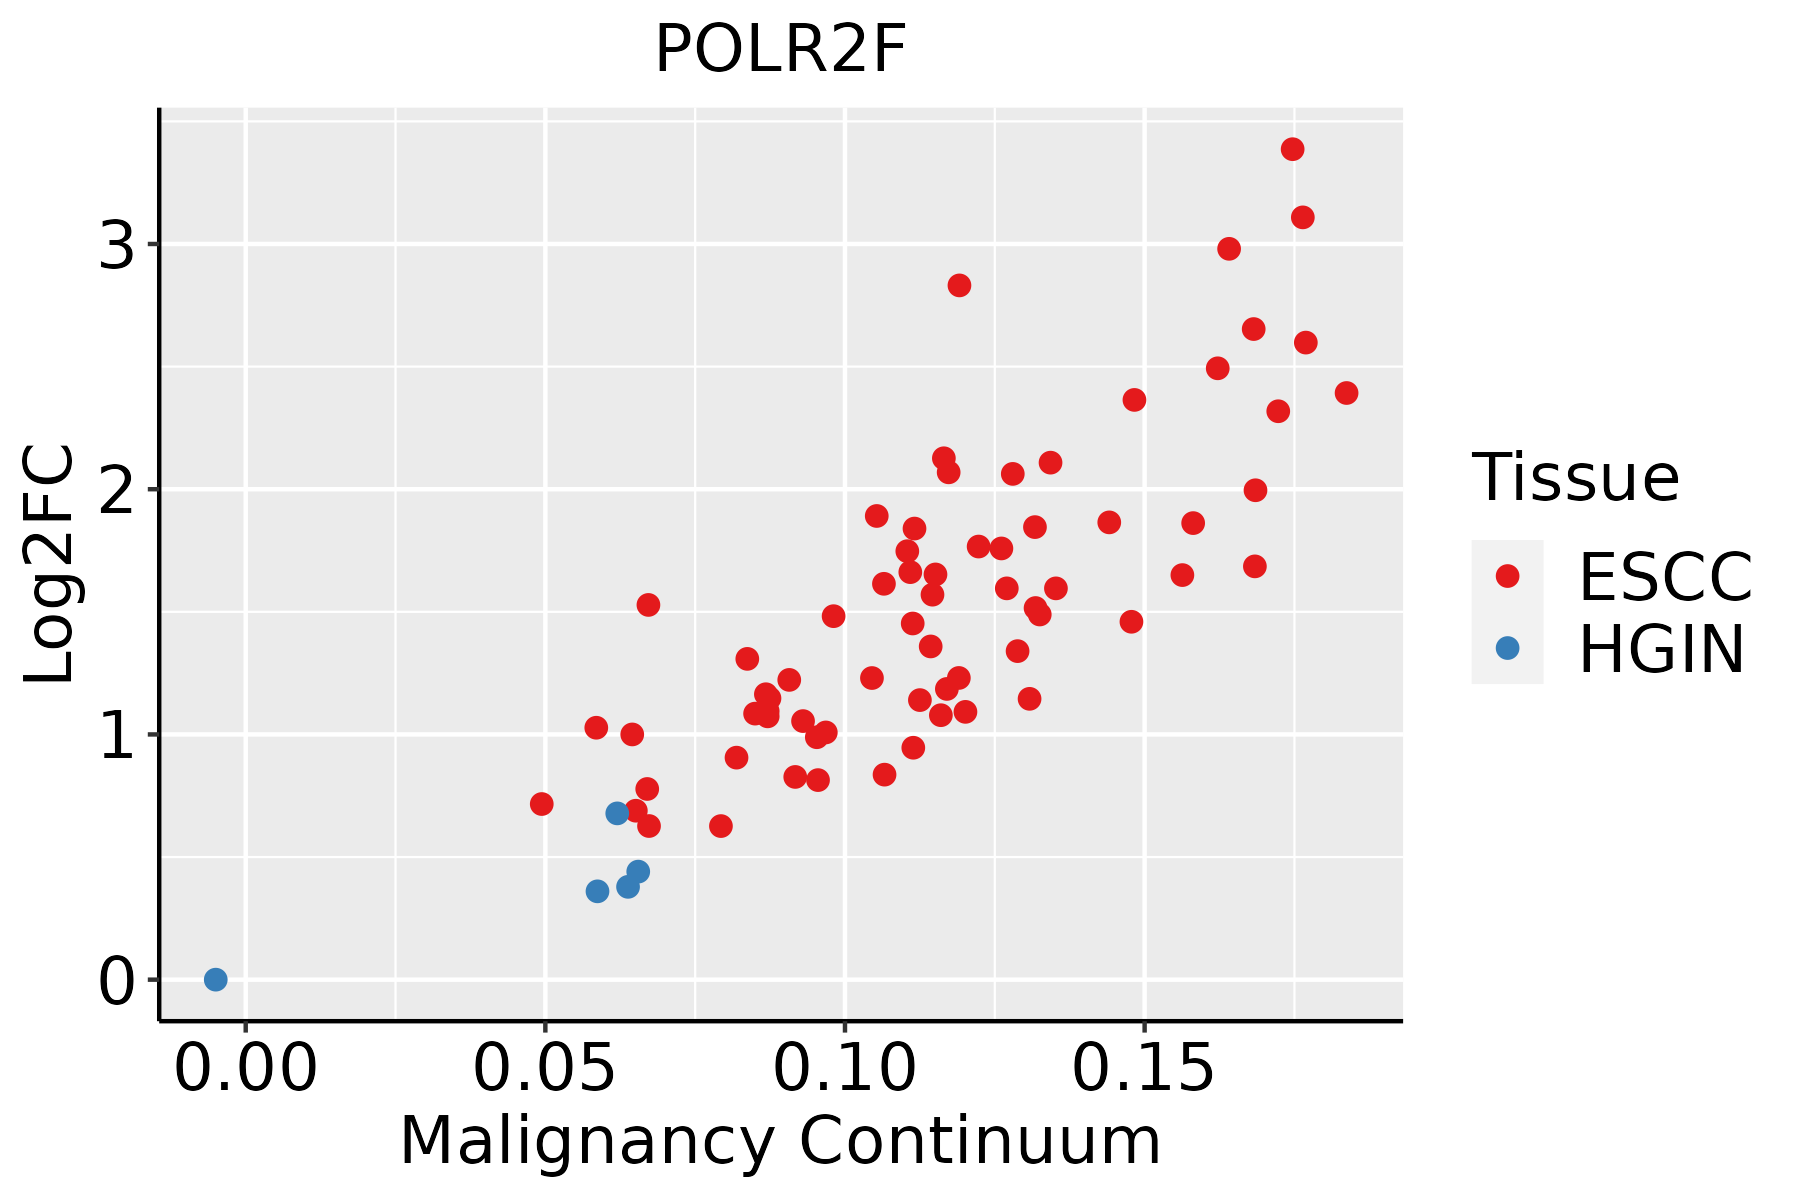 | ESCC: Esophageal squamous cell carcinoma |
| HGIN: High-grade intraepithelial neoplasias | ||
| LGIN: Low-grade intraepithelial neoplasias | ||
| GC |  | CAG: Chronic atrophic gastritis |
| CAG with IM: Chronic atrophic gastritis with intestinal metaplasia | ||
| CSG: Chronic superficial gastritis | ||
| GC: Gastric cancer | ||
| SIM: Severe intestinal metaplasia | ||
| WIM: Wild intestinal metaplasia | ||
| Liver | 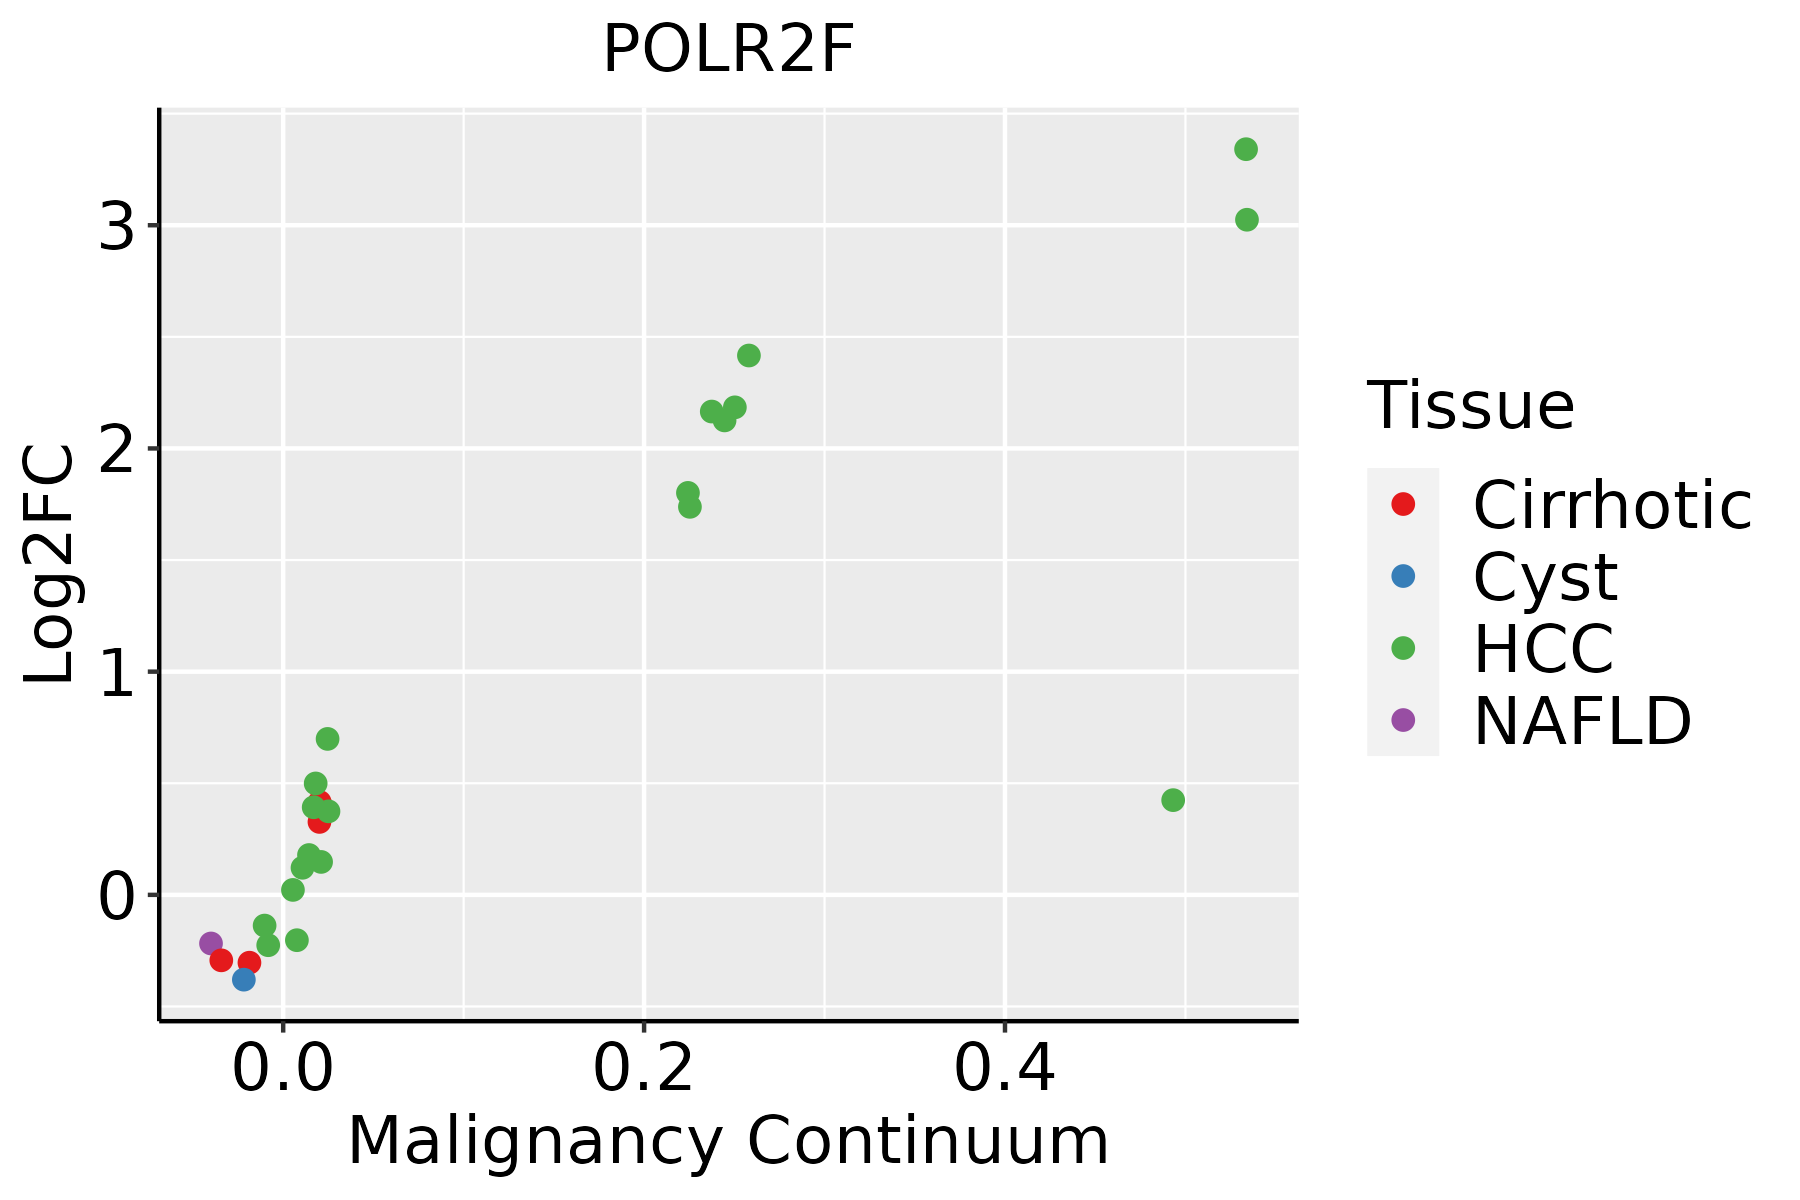 | HCC: Hepatocellular carcinoma |
| NAFLD: Non-alcoholic fatty liver disease | ||
| Oral Cavity | 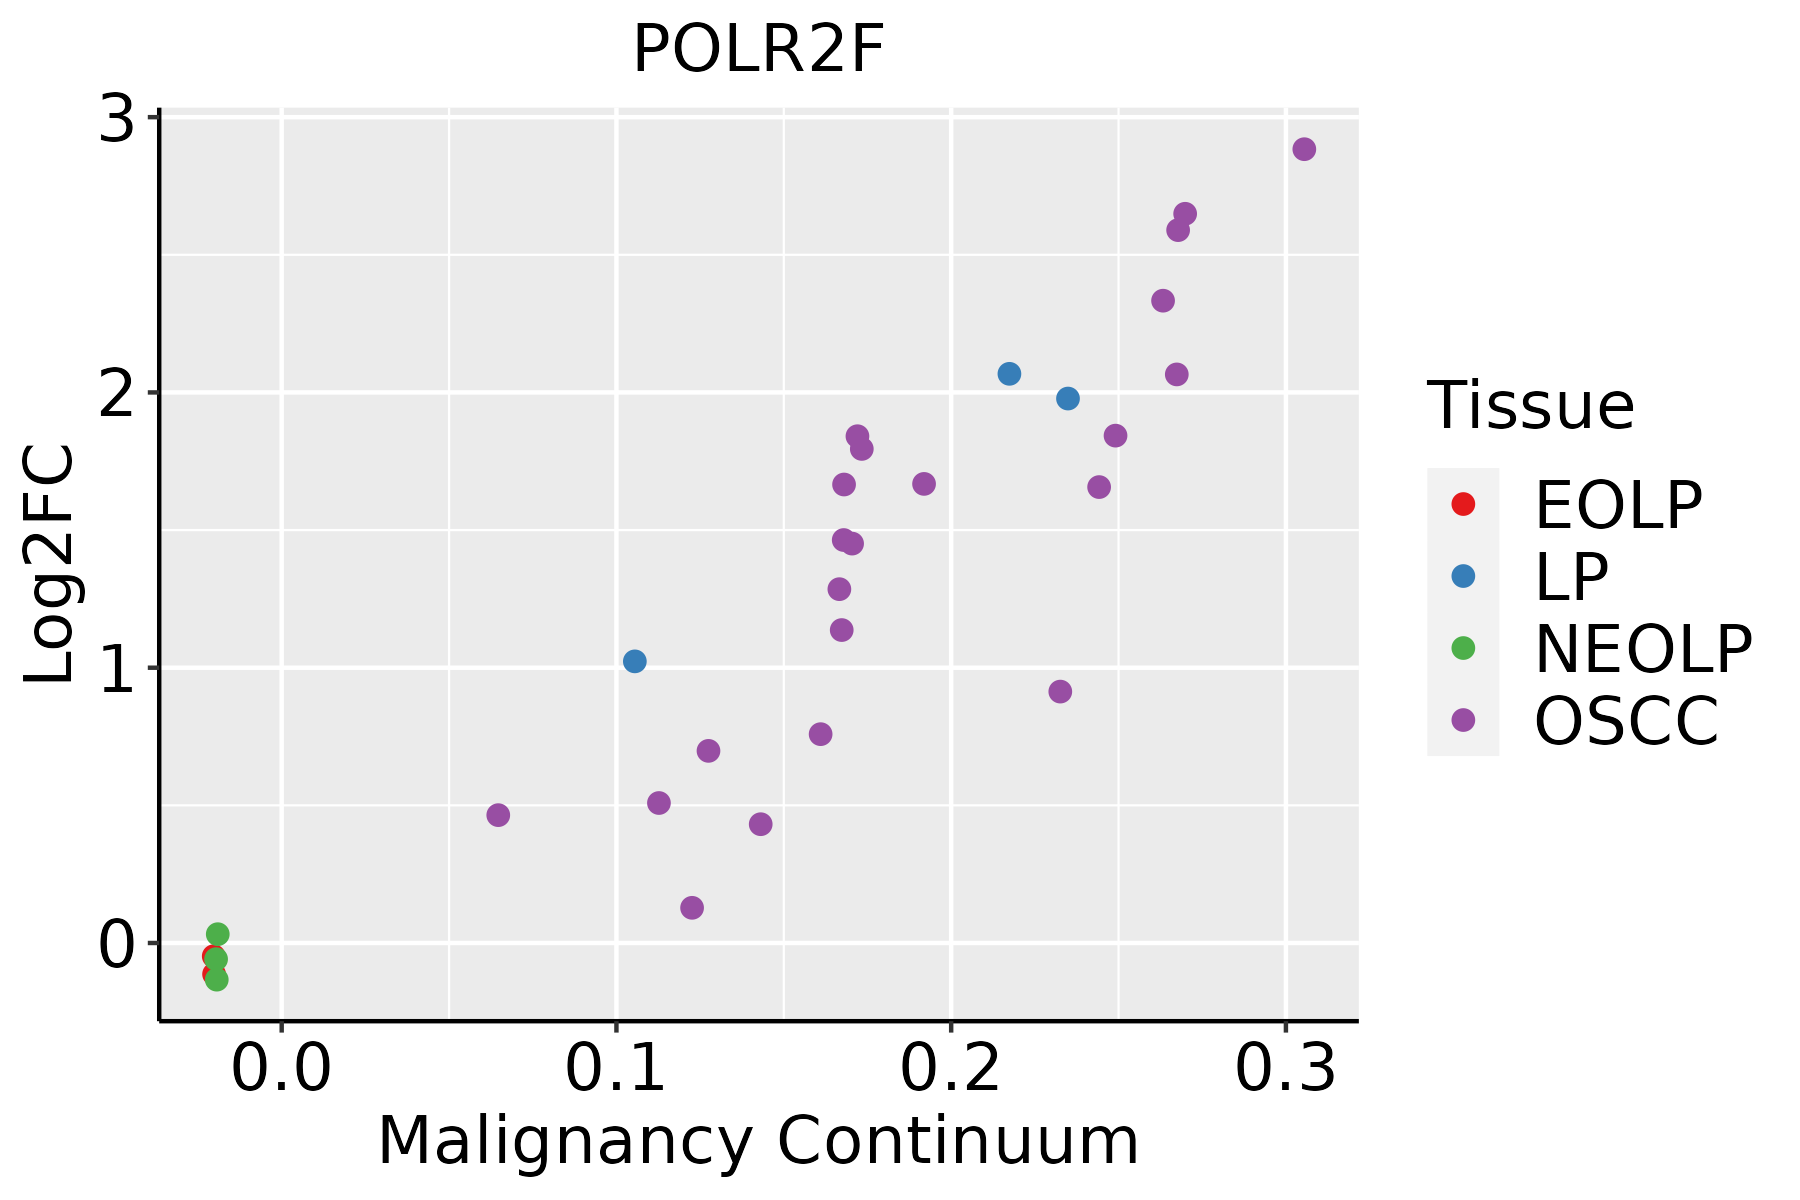 | EOLP: Erosive Oral lichen planus |
| LP: leukoplakia | ||
| NEOLP: Non-erosive oral lichen planus | ||
| OSCC: Oral squamous cell carcinoma | ||
| Prostate | 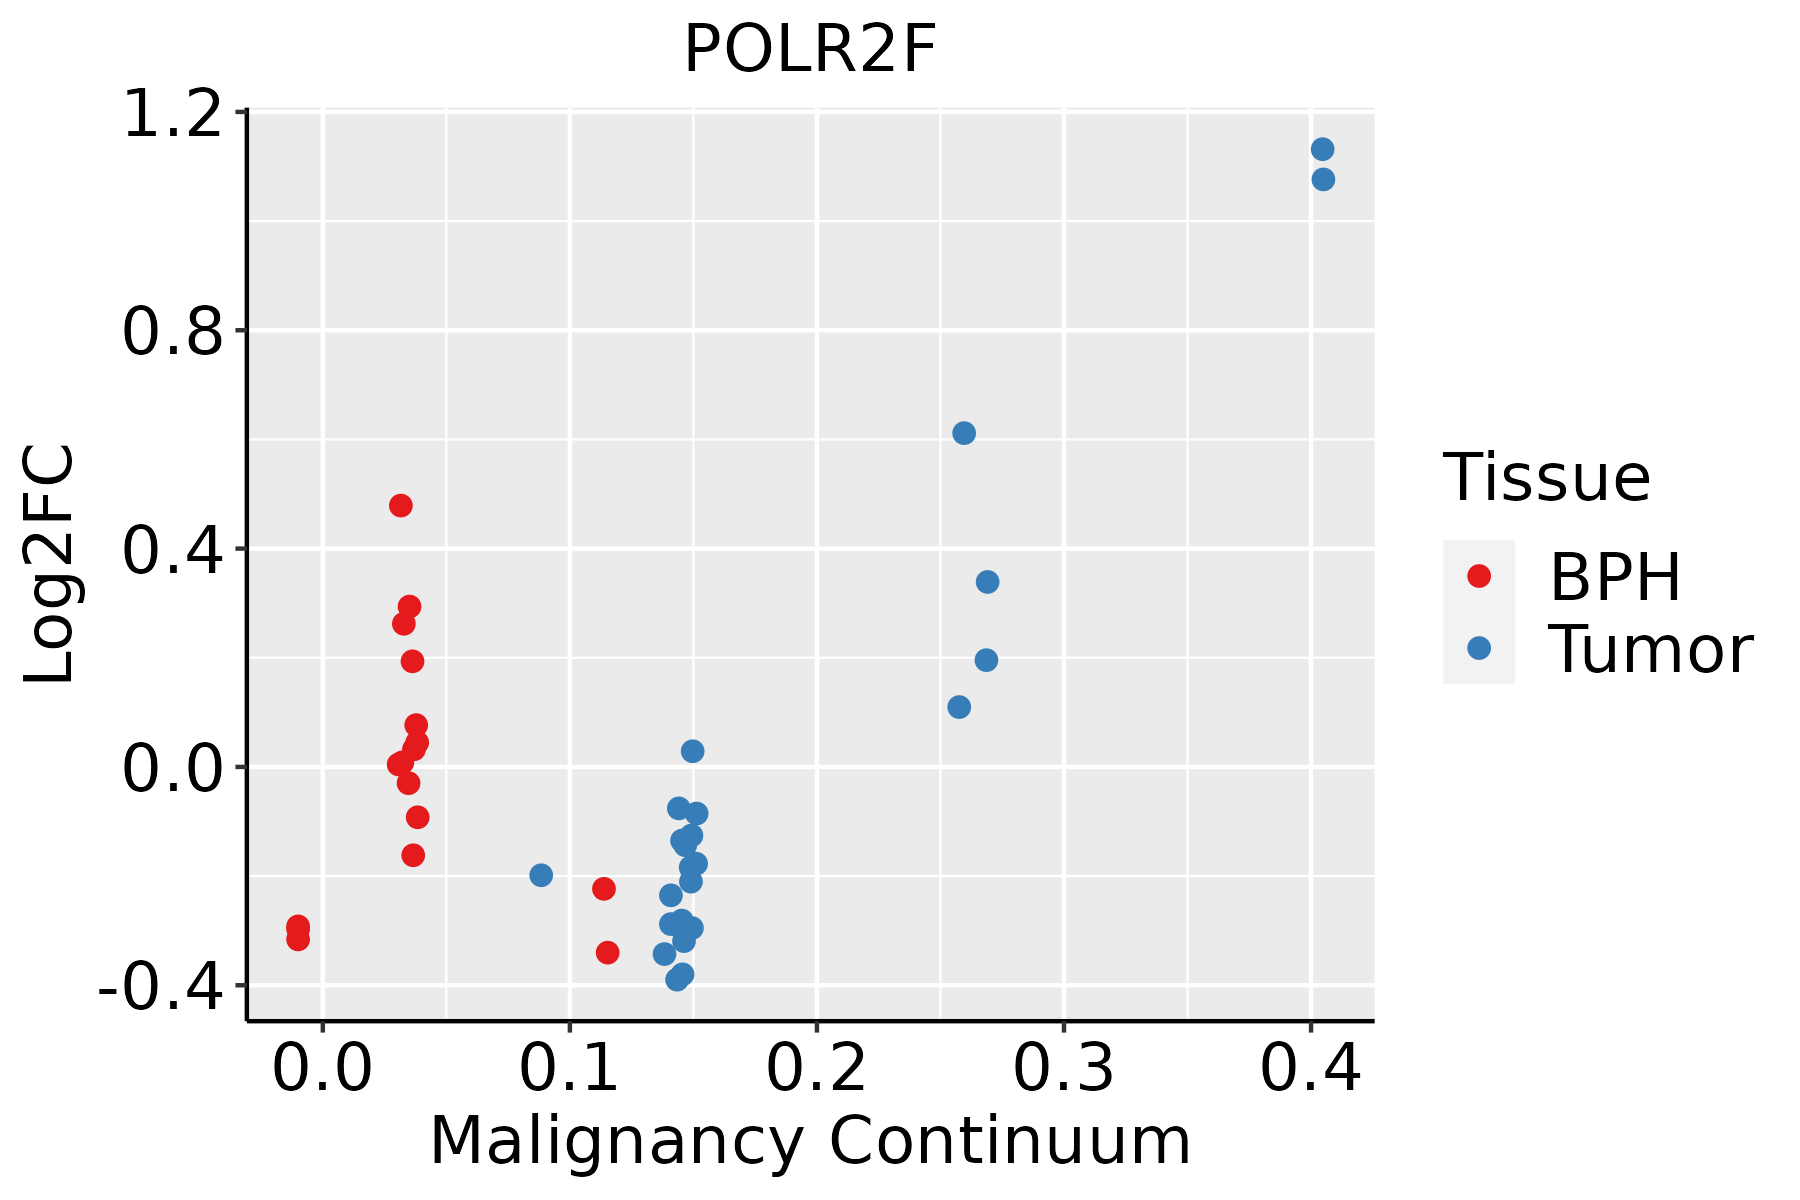 | BPH: Benign Prostatic Hyperplasia |
| Skin | 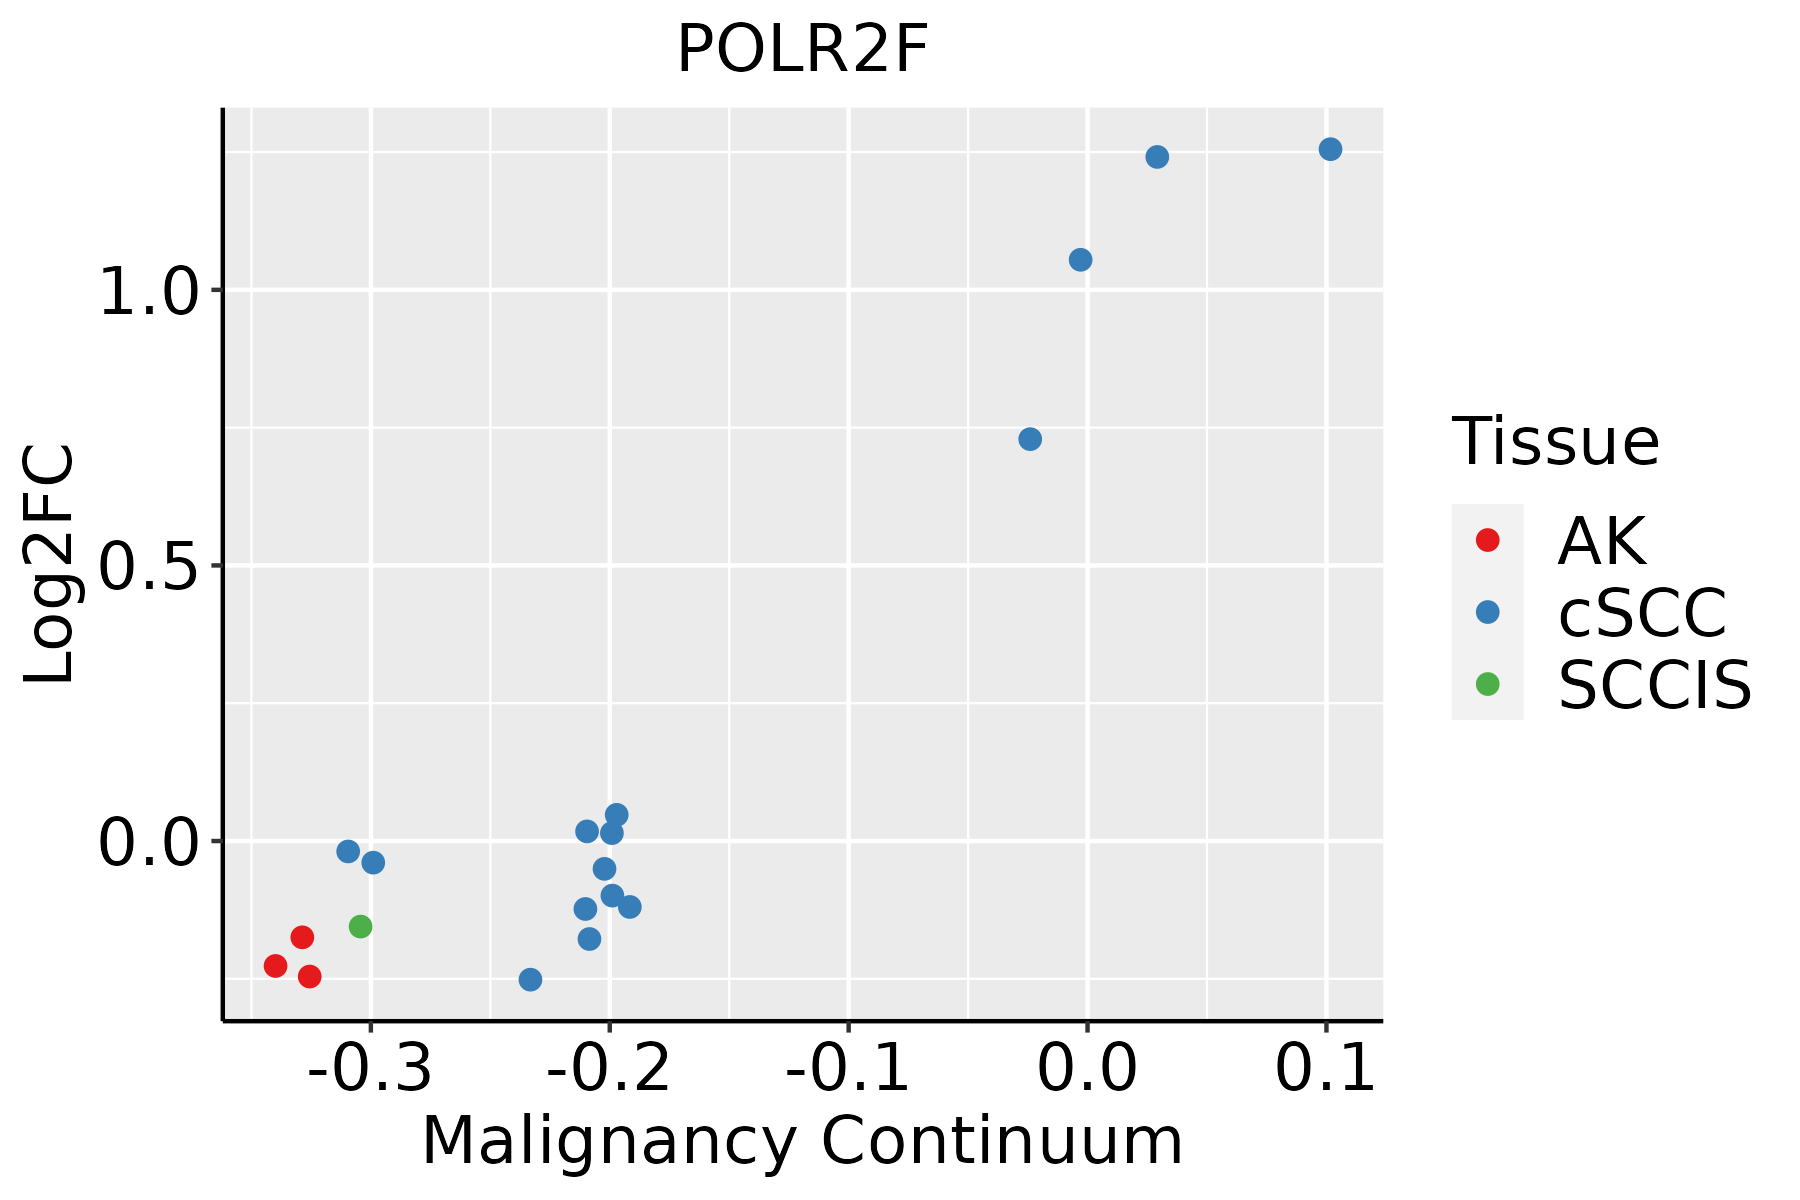 | AK: Actinic keratosis |
| cSCC: Cutaneous squamous cell carcinoma | ||
| SCCIS:squamous cell carcinoma in situ | ||
| Thyroid | 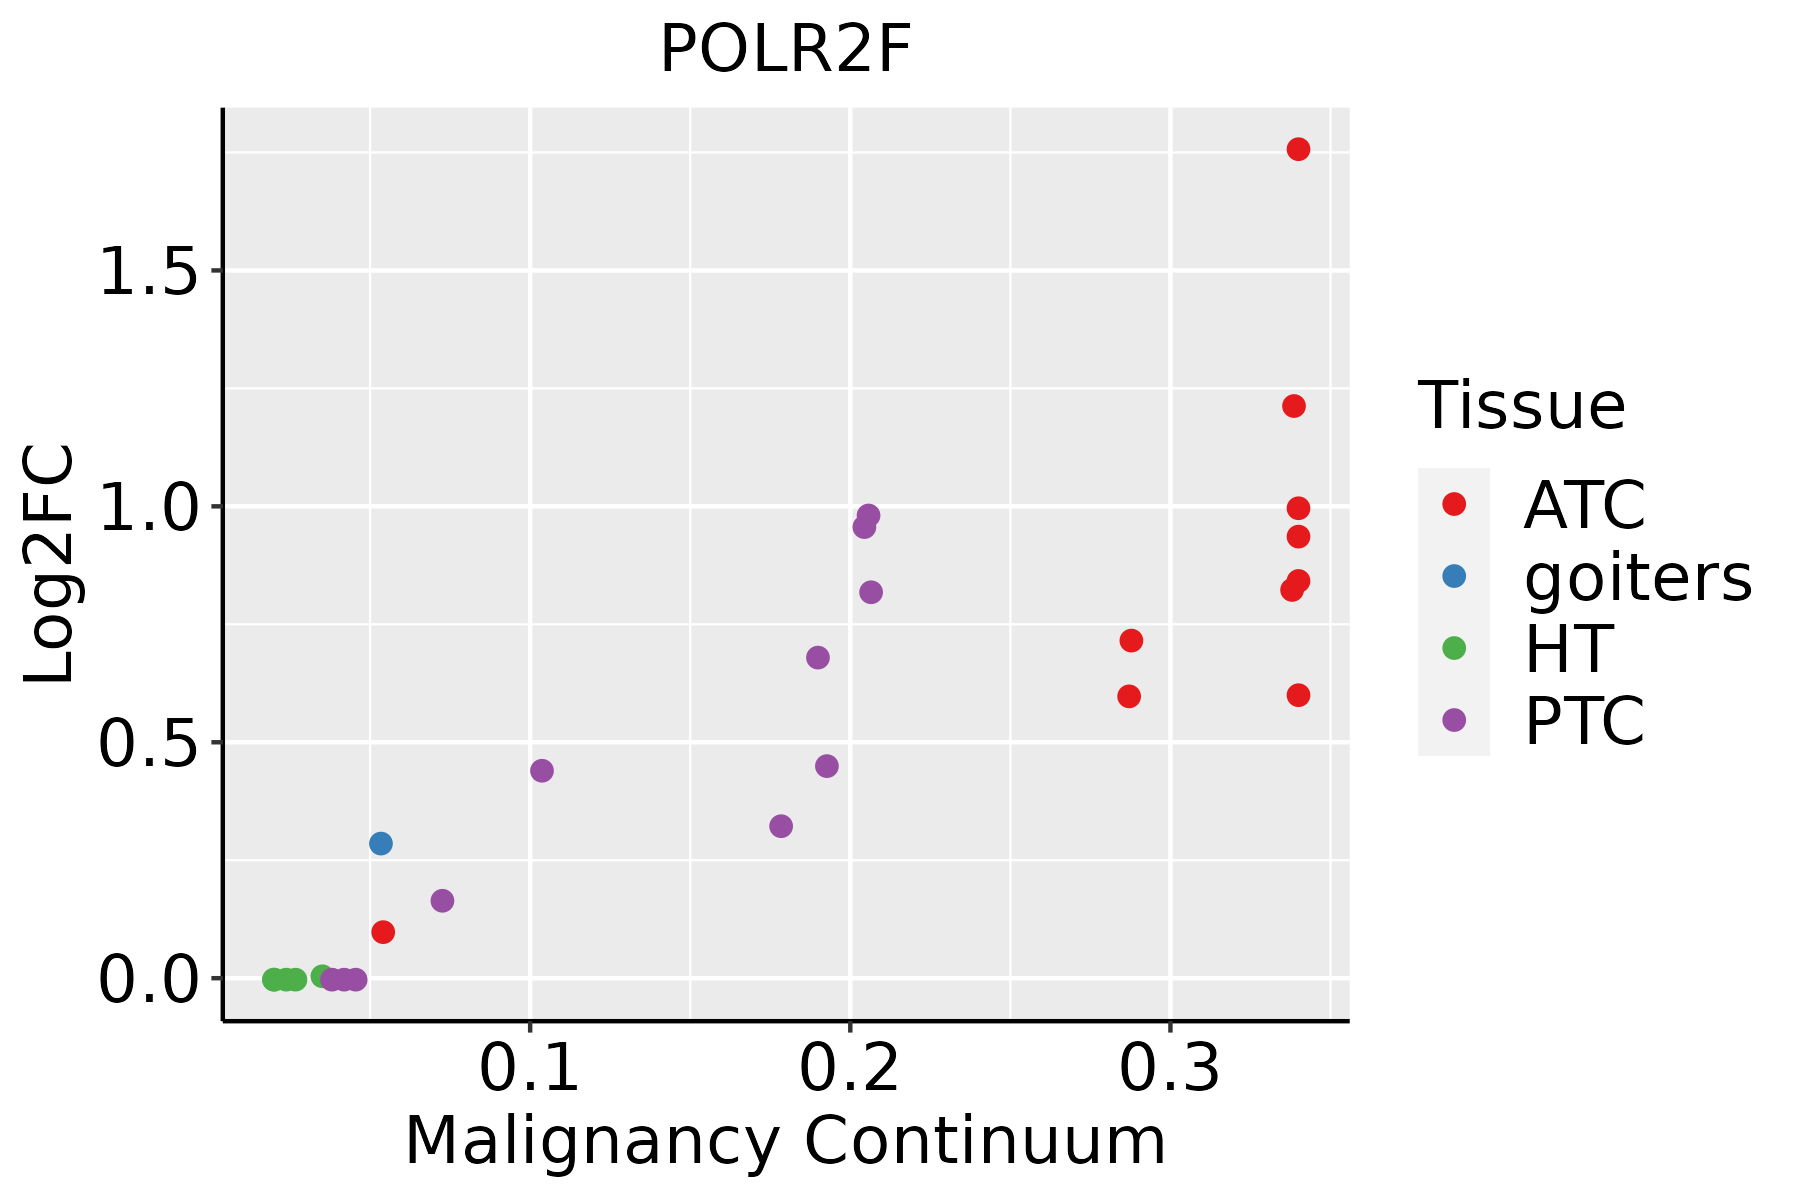 | ATC: Anaplastic thyroid cancer |
| HT: Hashimoto's thyroiditis | ||
| PTC: Papillary thyroid cancer |
| ∗log2FC in expression of this searched gene in stem-like cells from each diseased tissue sample relative to stem-like cells in normal samples in each tissue plotted against the malignancy continuum. Samples are colored based on if they are from different disease stage. |
Top |
Malignant transformation related pathway analysis |
| Find out the enriched GO biological processes and KEGG pathways involved in transition from healthy to precancer to cancer |
| Tissue | Disease Stage | Enriched GO biological Processes |
| Colorectum | AD |  |
| Colorectum | SER |  |
| Colorectum | MSS |  |
| Colorectum | MSI-H |  |
| Colorectum | FAP |  |
| ∗Top 15 enriched GO BP terms are showed in the bar plot of each disease state in each tissue. Each row represents a significant GO biological process which is colored according to the -log10(p.adjust). |
| Page: 1 2 3 4 5 6 7 8 9 |
| GO ID | Tissue | Disease Stage | Description | Gene Ratio | Bg Ratio | pvalue | p.adjust | Count |
| Page: 1 |
| Pathway ID | Tissue | Disease Stage | Description | Gene Ratio | Bg Ratio | pvalue | p.adjust | qvalue | Count |
| hsa0501616 | Breast | Precancer | Huntington disease | 98/684 | 306/8465 | 2.85e-35 | 2.25e-33 | 1.72e-33 | 98 |
| hsa0501617 | Breast | Precancer | Huntington disease | 98/684 | 306/8465 | 2.85e-35 | 2.25e-33 | 1.72e-33 | 98 |
| hsa0501623 | Breast | IDC | Huntington disease | 103/867 | 306/8465 | 5.14e-30 | 4.17e-28 | 3.12e-28 | 103 |
| hsa0501633 | Breast | IDC | Huntington disease | 103/867 | 306/8465 | 5.14e-30 | 4.17e-28 | 3.12e-28 | 103 |
| hsa0501643 | Breast | DCIS | Huntington disease | 101/846 | 306/8465 | 1.54e-29 | 1.24e-27 | 9.13e-28 | 101 |
| hsa0501653 | Breast | DCIS | Huntington disease | 101/846 | 306/8465 | 1.54e-29 | 1.24e-27 | 9.13e-28 | 101 |
| hsa0501620 | Endometrium | AEH | Huntington disease | 118/1197 | 306/8465 | 3.00e-27 | 2.44e-25 | 1.78e-25 | 118 |
| hsa05016110 | Endometrium | AEH | Huntington disease | 118/1197 | 306/8465 | 3.00e-27 | 2.44e-25 | 1.78e-25 | 118 |
| hsa0501625 | Endometrium | EEC | Huntington disease | 120/1237 | 306/8465 | 3.86e-27 | 4.23e-25 | 3.15e-25 | 120 |
| hsa0501635 | Endometrium | EEC | Huntington disease | 120/1237 | 306/8465 | 3.86e-27 | 4.23e-25 | 3.15e-25 | 120 |
| hsa0501630 | Esophagus | HGIN | Huntington disease | 129/1383 | 306/8465 | 6.81e-28 | 7.41e-26 | 5.88e-26 | 129 |
| hsa034205 | Esophagus | HGIN | Nucleotide excision repair | 29/1383 | 63/8465 | 2.96e-08 | 5.36e-07 | 4.26e-07 | 29 |
| hsa030205 | Esophagus | HGIN | RNA polymerase | 12/1383 | 34/8465 | 5.62e-03 | 3.99e-02 | 3.17e-02 | 12 |
| hsa05016113 | Esophagus | HGIN | Huntington disease | 129/1383 | 306/8465 | 6.81e-28 | 7.41e-26 | 5.88e-26 | 129 |
| hsa0342012 | Esophagus | HGIN | Nucleotide excision repair | 29/1383 | 63/8465 | 2.96e-08 | 5.36e-07 | 4.26e-07 | 29 |
| hsa0302012 | Esophagus | HGIN | RNA polymerase | 12/1383 | 34/8465 | 5.62e-03 | 3.99e-02 | 3.17e-02 | 12 |
| hsa05016210 | Esophagus | ESCC | Huntington disease | 226/4205 | 306/8465 | 1.38e-18 | 8.72e-17 | 4.46e-17 | 226 |
| hsa0342022 | Esophagus | ESCC | Nucleotide excision repair | 54/4205 | 63/8465 | 2.01e-09 | 2.17e-08 | 1.11e-08 | 54 |
| hsa0302021 | Esophagus | ESCC | RNA polymerase | 28/4205 | 34/8465 | 8.19e-05 | 3.35e-04 | 1.71e-04 | 28 |
| hsa046234 | Esophagus | ESCC | Cytosolic DNA-sensing pathway | 49/4205 | 75/8465 | 4.35e-03 | 1.12e-02 | 5.74e-03 | 49 |
| Page: 1 2 3 4 |
Top |
Cell-cell communication analysis |
| Identification of potential cell-cell interactions between two cell types and their ligand-receptor pairs for different disease states |
| Ligand | Receptor | LRpair | Pathway | Tissue | Disease Stage |
| Page: 1 |
Top |
Single-cell gene regulatory network inference analysis |
| Find out the significant the regulons (TFs) and the target genes of each regulon across cell types for different disease states |
| TF | Cell Type | Tissue | Disease Stage | Target Gene | RSS | Regulon Activity |
| ∗The dot plots of a searched regulon are shown for all cell subpopulations in each disease state of each tissue based on the regulon specific score inferred using pySCENIC and by calculating the average expression. |
| Page: 1 |
Top |
Somatic mutation of malignant transformation related genes |
| Annotation of somatic variants for genes involved in malignant transformation |
| Hugo Symbol | Variant Class | Variant Classification | dbSNP RS | HGVSc | HGVSp | HGVSp Short | SWISSPROT | BIOTYPE | SIFT | PolyPhen | Tumor Sample Barcode | Tissue | Histology | Sex | Age | Stage | Therapy Types | Drugs | Outcome |
| POLR2F | SNV | Missense_Mutation | c.12C>A | p.Asn4Lys | p.N4K | protein_coding | deleterious_low_confidence(0) | possibly_damaging(0.834) | TCGA-AN-A0XT-01 | Breast | breast invasive carcinoma | Female | <65 | III/IV | Unknown | Unknown | SD | ||
| POLR2F | SNV | Missense_Mutation | rs763720250 | c.206G>A | p.Arg69Gln | p.R69Q | protein_coding | deleterious_low_confidence(0) | probably_damaging(0.999) | TCGA-AO-A03V-01 | Breast | breast invasive carcinoma | Female | <65 | I/II | Chemotherapy | fluorouracil | SD | |
| POLR2F | SNV | Missense_Mutation | rs759220077 | c.109N>A | p.Glu37Lys | p.E37K | protein_coding | tolerated_low_confidence(0.06) | benign(0) | TCGA-Q1-A73O-01 | Cervix | cervical & endocervical cancer | Female | <65 | I/II | Chemotherapy | cisplatin | CR | |
| POLR2F | SNV | Missense_Mutation | rs778818192 | c.461G>A | p.Arg154Gln | p.R154Q | protein_coding | unknown(0) | TCGA-A6-5661-01 | Colorectum | colon adenocarcinoma | Female | >=65 | I/II | Unknown | Unknown | SD | ||
| POLR2F | SNV | Missense_Mutation | rs771399849 | c.85N>A | p.Glu29Lys | p.E29K | protein_coding | deleterious_low_confidence(0.02) | benign(0) | TCGA-AA-3510-01 | Colorectum | colon adenocarcinoma | Male | >=65 | I/II | Unknown | Unknown | SD | |
| POLR2F | SNV | Missense_Mutation | rs760223334 | c.193N>A | p.Val65Met | p.V65M | protein_coding | deleterious_low_confidence(0) | probably_damaging(0.994) | TCGA-CM-6162-01 | Colorectum | colon adenocarcinoma | Female | <65 | III/IV | Chemotherapy | oxaliplatin | SD | |
| POLR2F | SNV | Missense_Mutation | c.190N>T | p.Arg64Cys | p.R64C | protein_coding | deleterious_low_confidence(0) | probably_damaging(0.999) | TCGA-DM-A288-01 | Colorectum | colon adenocarcinoma | Male | >=65 | III/IV | Unknown | Unknown | PD | ||
| POLR2F | insertion | Frame_Shift_Ins | novel | c.116_117insC | p.Ser41LeufsTer? | p.S41Lfs*? | protein_coding | TCGA-A6-5665-01 | Colorectum | colon adenocarcinoma | Female | >=65 | I/II | Unknown | Unknown | PD | |||
| POLR2F | SNV | Missense_Mutation | novel | c.469G>C | p.Glu157Gln | p.E157Q | protein_coding | unknown(0) | TCGA-AX-A3G3-01 | Endometrium | uterine corpus endometrioid carcinoma | Female | <65 | III/IV | Unknown | Unknown | SD | ||
| POLR2F | SNV | Missense_Mutation | novel | c.266N>A | p.Pro89His | p.P89H | protein_coding | deleterious_low_confidence(0) | probably_damaging(0.998) | TCGA-EY-A215-01 | Endometrium | uterine corpus endometrioid carcinoma | Female | <65 | I/II | Unknown | Unknown | SD |
| Page: 1 2 |
Top |
Related drugs of malignant transformation related genes |
| Identification of chemicals and drugs interact with genes involved in malignant transfromation |
| (DGIdb 4.0) |
| Entrez ID | Symbol | Category | Interaction Types | Drug Claim Name | Drug Name | PMIDs |
| Page: 1 |

Copyright 2023-Present -The University of Texas Health Science Center at Houston |