
|
|||||
|
 | |
| |
| |
| |
| |
| |
|
Gene: POLR2E |
Gene summary for POLR2E |
| Gene information | Species | Human | Gene symbol | POLR2E | Gene ID | 5434 |
| Gene name | RNA polymerase II, I and III subunit E | |
| Gene Alias | RPABC1 | |
| Cytomap | 19p13.3 | |
| Gene Type | protein-coding | GO ID | GO:0006139 | UniProtAcc | B4DJ89 |
Top |
Malignant transformation analysis |
| Identification of the aberrant gene expression in precancerous and cancerous lesions by comparing the gene expression of stem-like cells in diseased tissues with normal stem cells |
| Entrez ID | Symbol | Replicates | Species | Organ | Tissue | Adj P-value | Log2FC | Malignancy |
| 5434 | POLR2E | HTA11_2487_2000001011 | Human | Colorectum | SER | 5.01e-09 | 4.13e-01 | -0.1808 |
| 5434 | POLR2E | HTA11_1938_2000001011 | Human | Colorectum | AD | 5.31e-14 | 5.49e-01 | -0.0811 |
| 5434 | POLR2E | HTA11_78_2000001011 | Human | Colorectum | AD | 7.70e-07 | 3.36e-01 | -0.1088 |
| 5434 | POLR2E | HTA11_347_2000001011 | Human | Colorectum | AD | 6.38e-20 | 4.59e-01 | -0.1954 |
| 5434 | POLR2E | HTA11_411_2000001011 | Human | Colorectum | SER | 3.00e-03 | 5.82e-01 | -0.2602 |
| 5434 | POLR2E | HTA11_2112_2000001011 | Human | Colorectum | SER | 8.48e-08 | 7.90e-01 | -0.2196 |
| 5434 | POLR2E | HTA11_3361_2000001011 | Human | Colorectum | AD | 1.68e-13 | 6.30e-01 | -0.1207 |
| 5434 | POLR2E | HTA11_83_2000001011 | Human | Colorectum | SER | 6.19e-10 | 5.57e-01 | -0.1526 |
| 5434 | POLR2E | HTA11_696_2000001011 | Human | Colorectum | AD | 4.23e-20 | 6.06e-01 | -0.1464 |
| 5434 | POLR2E | HTA11_866_2000001011 | Human | Colorectum | AD | 1.16e-06 | 3.24e-01 | -0.1001 |
| 5434 | POLR2E | HTA11_1391_2000001011 | Human | Colorectum | AD | 1.59e-23 | 7.18e-01 | -0.059 |
| 5434 | POLR2E | HTA11_2992_2000001011 | Human | Colorectum | SER | 5.18e-08 | 5.74e-01 | -0.1706 |
| 5434 | POLR2E | HTA11_5212_2000001011 | Human | Colorectum | AD | 1.13e-03 | 3.53e-01 | -0.2061 |
| 5434 | POLR2E | HTA11_5216_2000001011 | Human | Colorectum | SER | 1.94e-02 | 4.65e-01 | -0.1462 |
| 5434 | POLR2E | HTA11_546_2000001011 | Human | Colorectum | AD | 7.65e-03 | 3.39e-01 | -0.0842 |
| 5434 | POLR2E | HTA11_866_3004761011 | Human | Colorectum | AD | 6.26e-18 | 5.18e-01 | 0.096 |
| 5434 | POLR2E | HTA11_4255_2000001011 | Human | Colorectum | SER | 6.40e-06 | 5.58e-01 | 0.0446 |
| 5434 | POLR2E | HTA11_7663_2000001011 | Human | Colorectum | SER | 3.92e-05 | 4.93e-01 | 0.0131 |
| 5434 | POLR2E | HTA11_10623_2000001011 | Human | Colorectum | AD | 3.77e-04 | 3.71e-01 | -0.0177 |
| 5434 | POLR2E | HTA11_10711_2000001011 | Human | Colorectum | AD | 8.66e-06 | 3.47e-01 | 0.0338 |
| Page: 1 2 3 4 5 6 7 8 |
| Tissue | Expression Dynamics | Abbreviation |
| Colorectum (GSE201348) |  | FAP: Familial adenomatous polyposis |
| CRC: Colorectal cancer | ||
| Colorectum (HTA11) |  | AD: Adenomas |
| SER: Sessile serrated lesions | ||
| MSI-H: Microsatellite-high colorectal cancer | ||
| MSS: Microsatellite stable colorectal cancer | ||
| Esophagus | 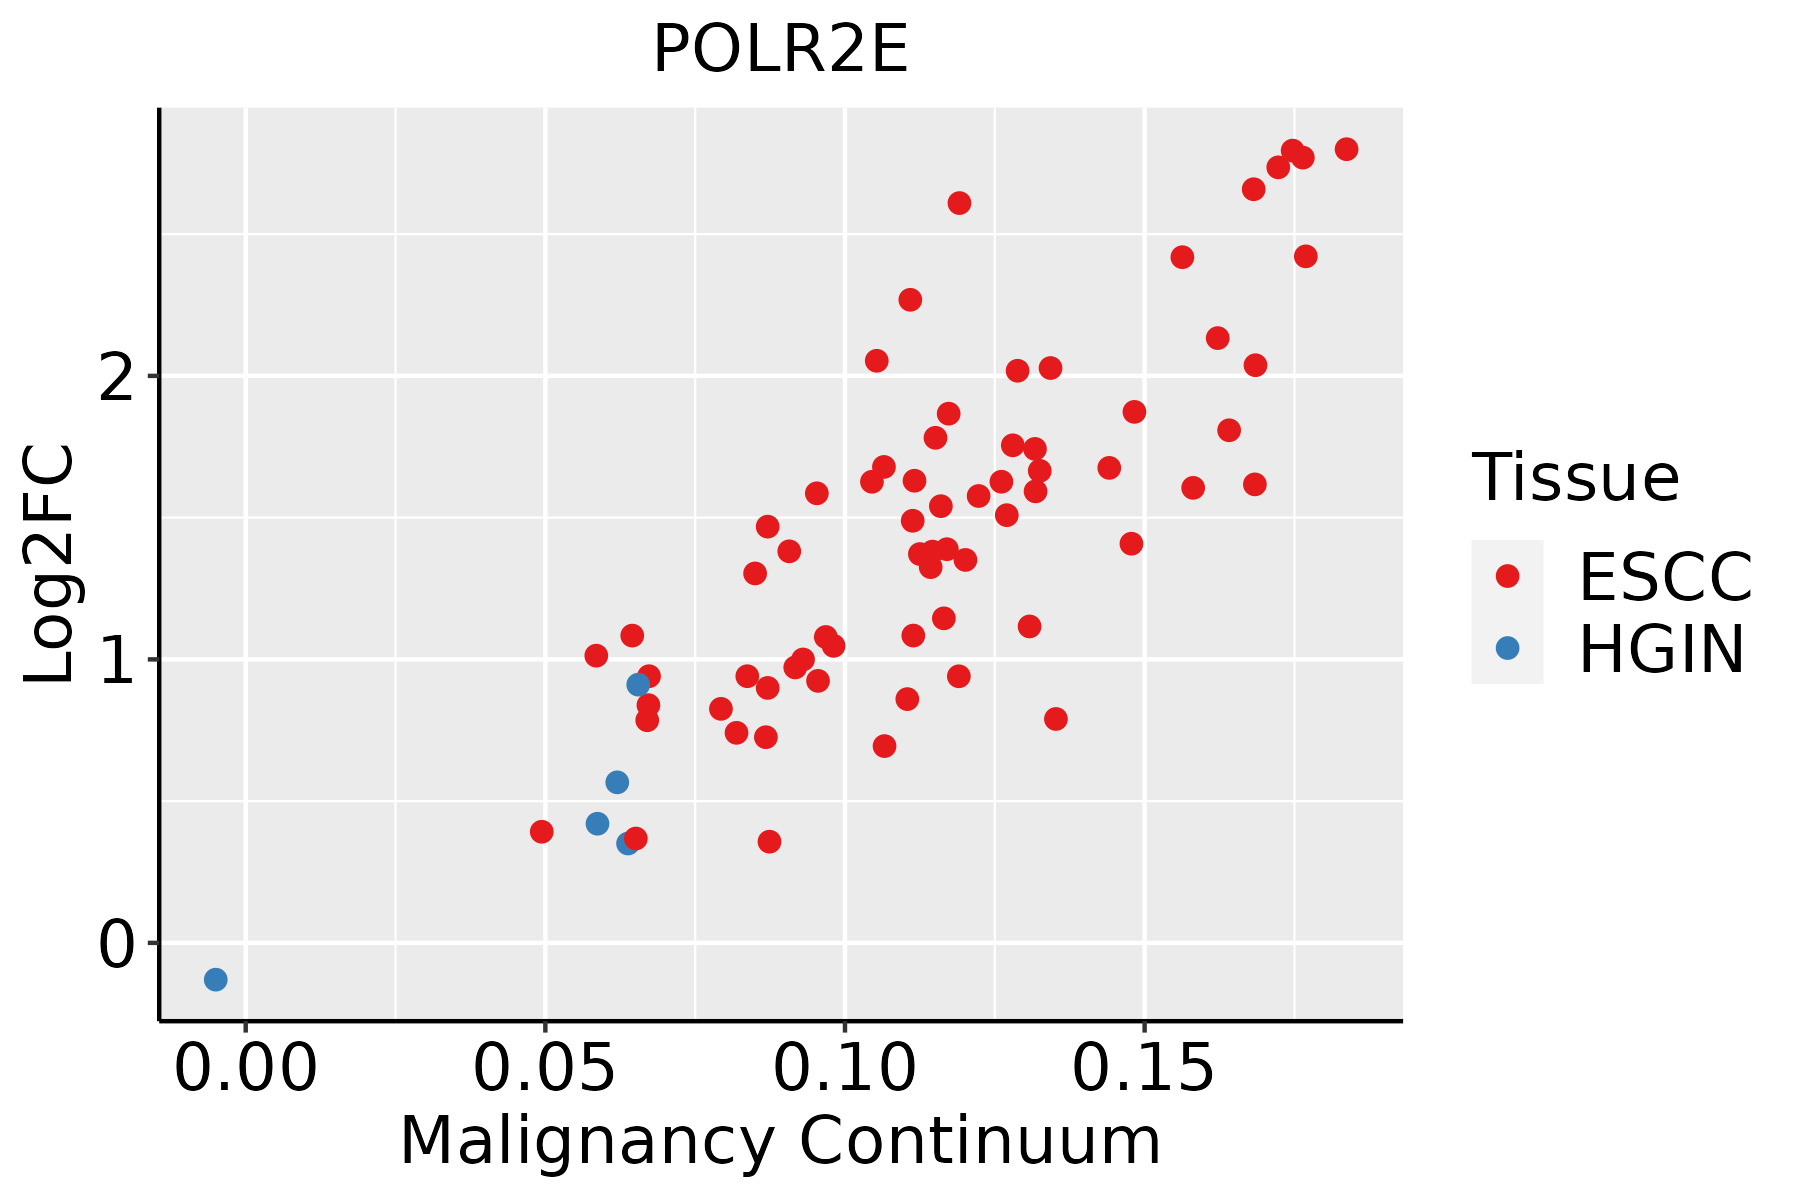 | ESCC: Esophageal squamous cell carcinoma |
| HGIN: High-grade intraepithelial neoplasias | ||
| LGIN: Low-grade intraepithelial neoplasias | ||
| Liver | 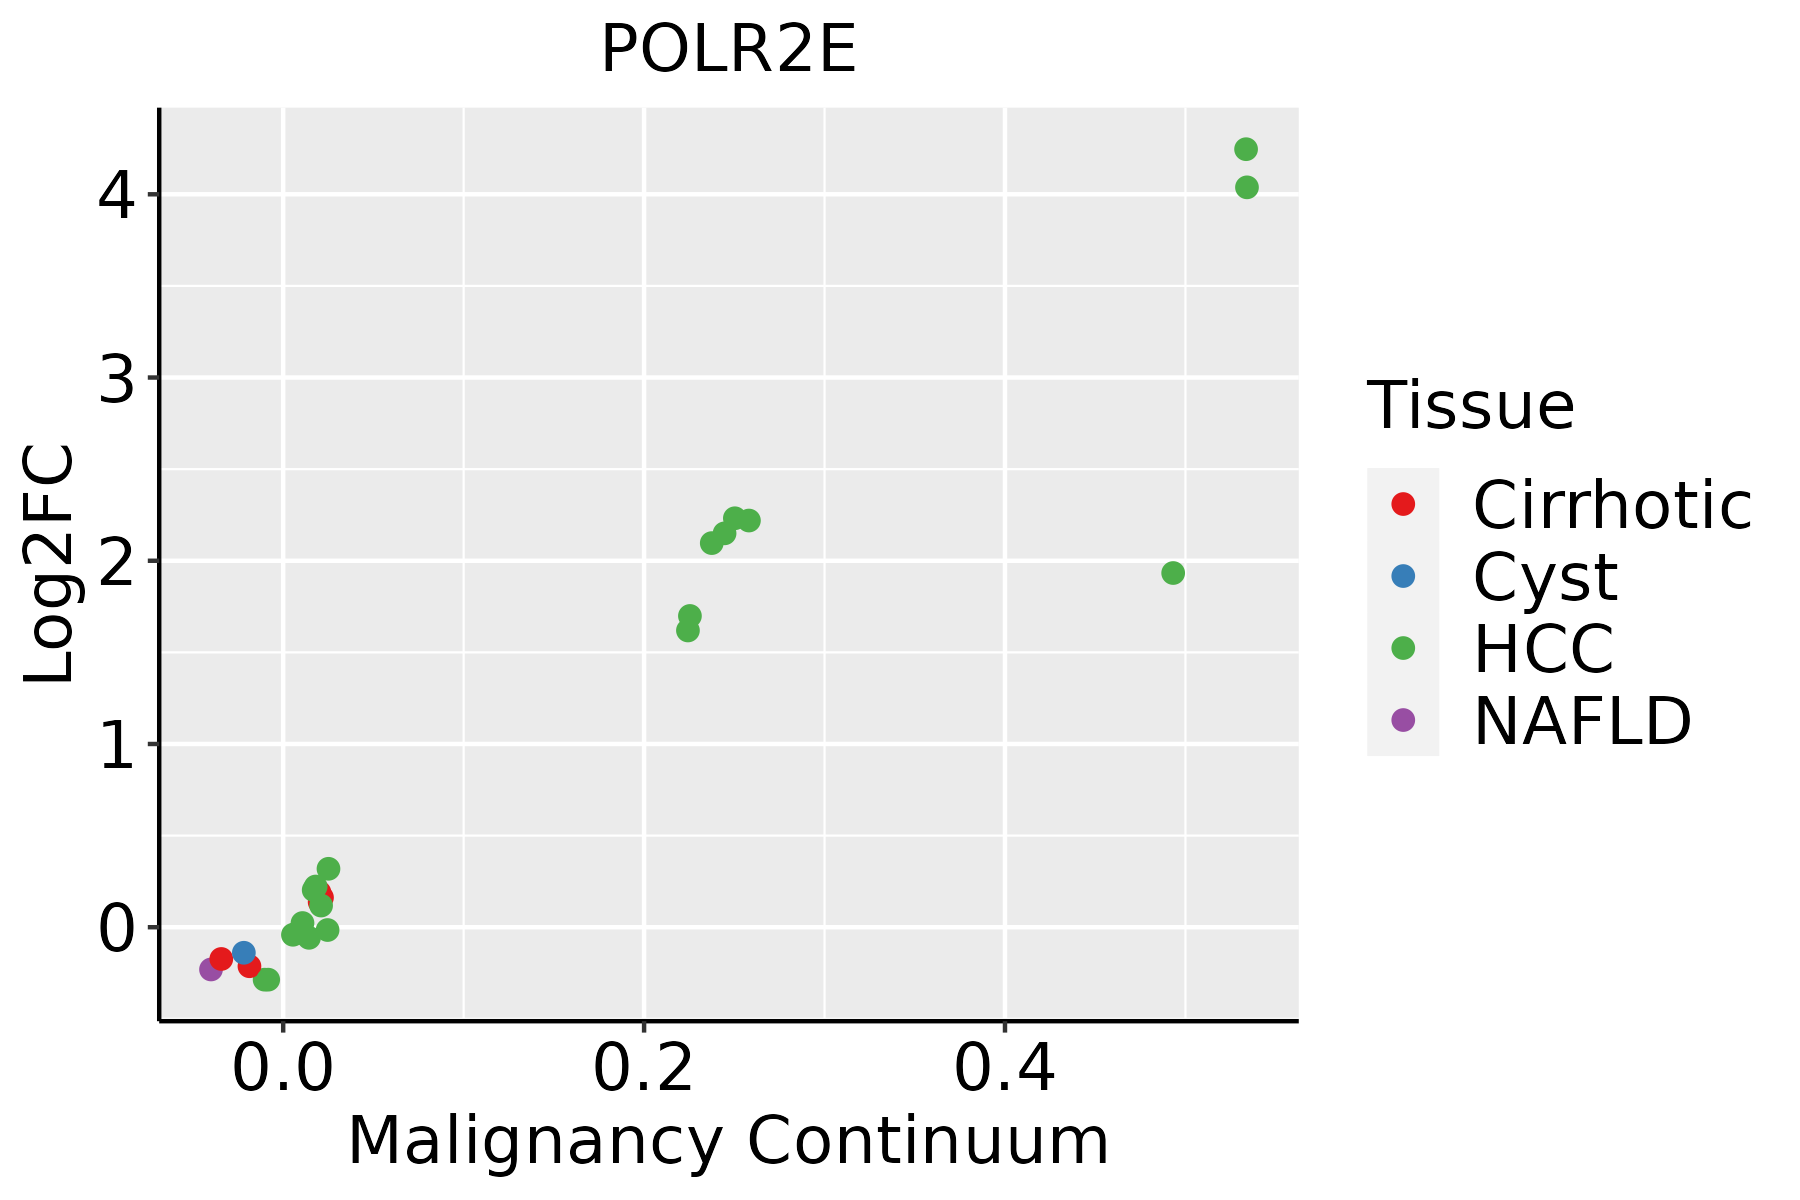 | HCC: Hepatocellular carcinoma |
| NAFLD: Non-alcoholic fatty liver disease | ||
| Oral Cavity | 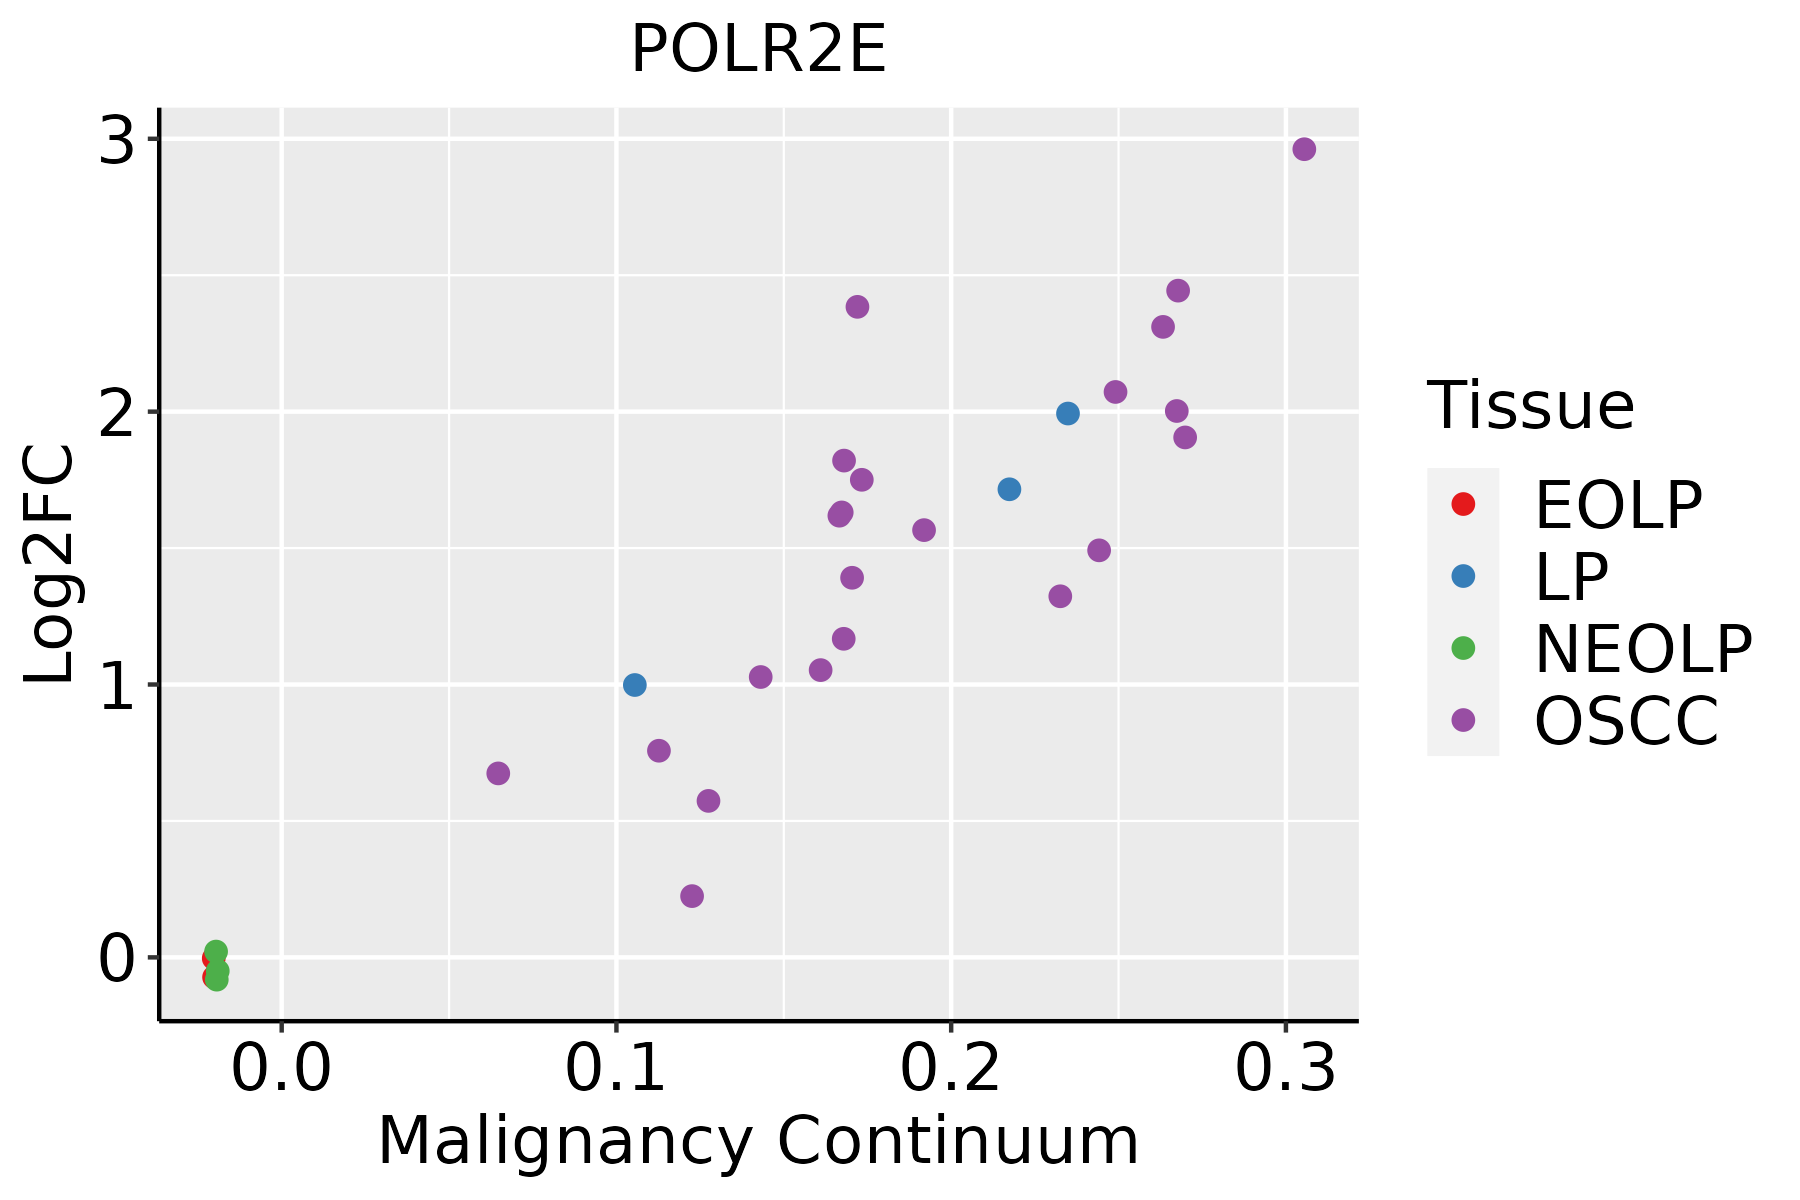 | EOLP: Erosive Oral lichen planus |
| LP: leukoplakia | ||
| NEOLP: Non-erosive oral lichen planus | ||
| OSCC: Oral squamous cell carcinoma | ||
| Skin | 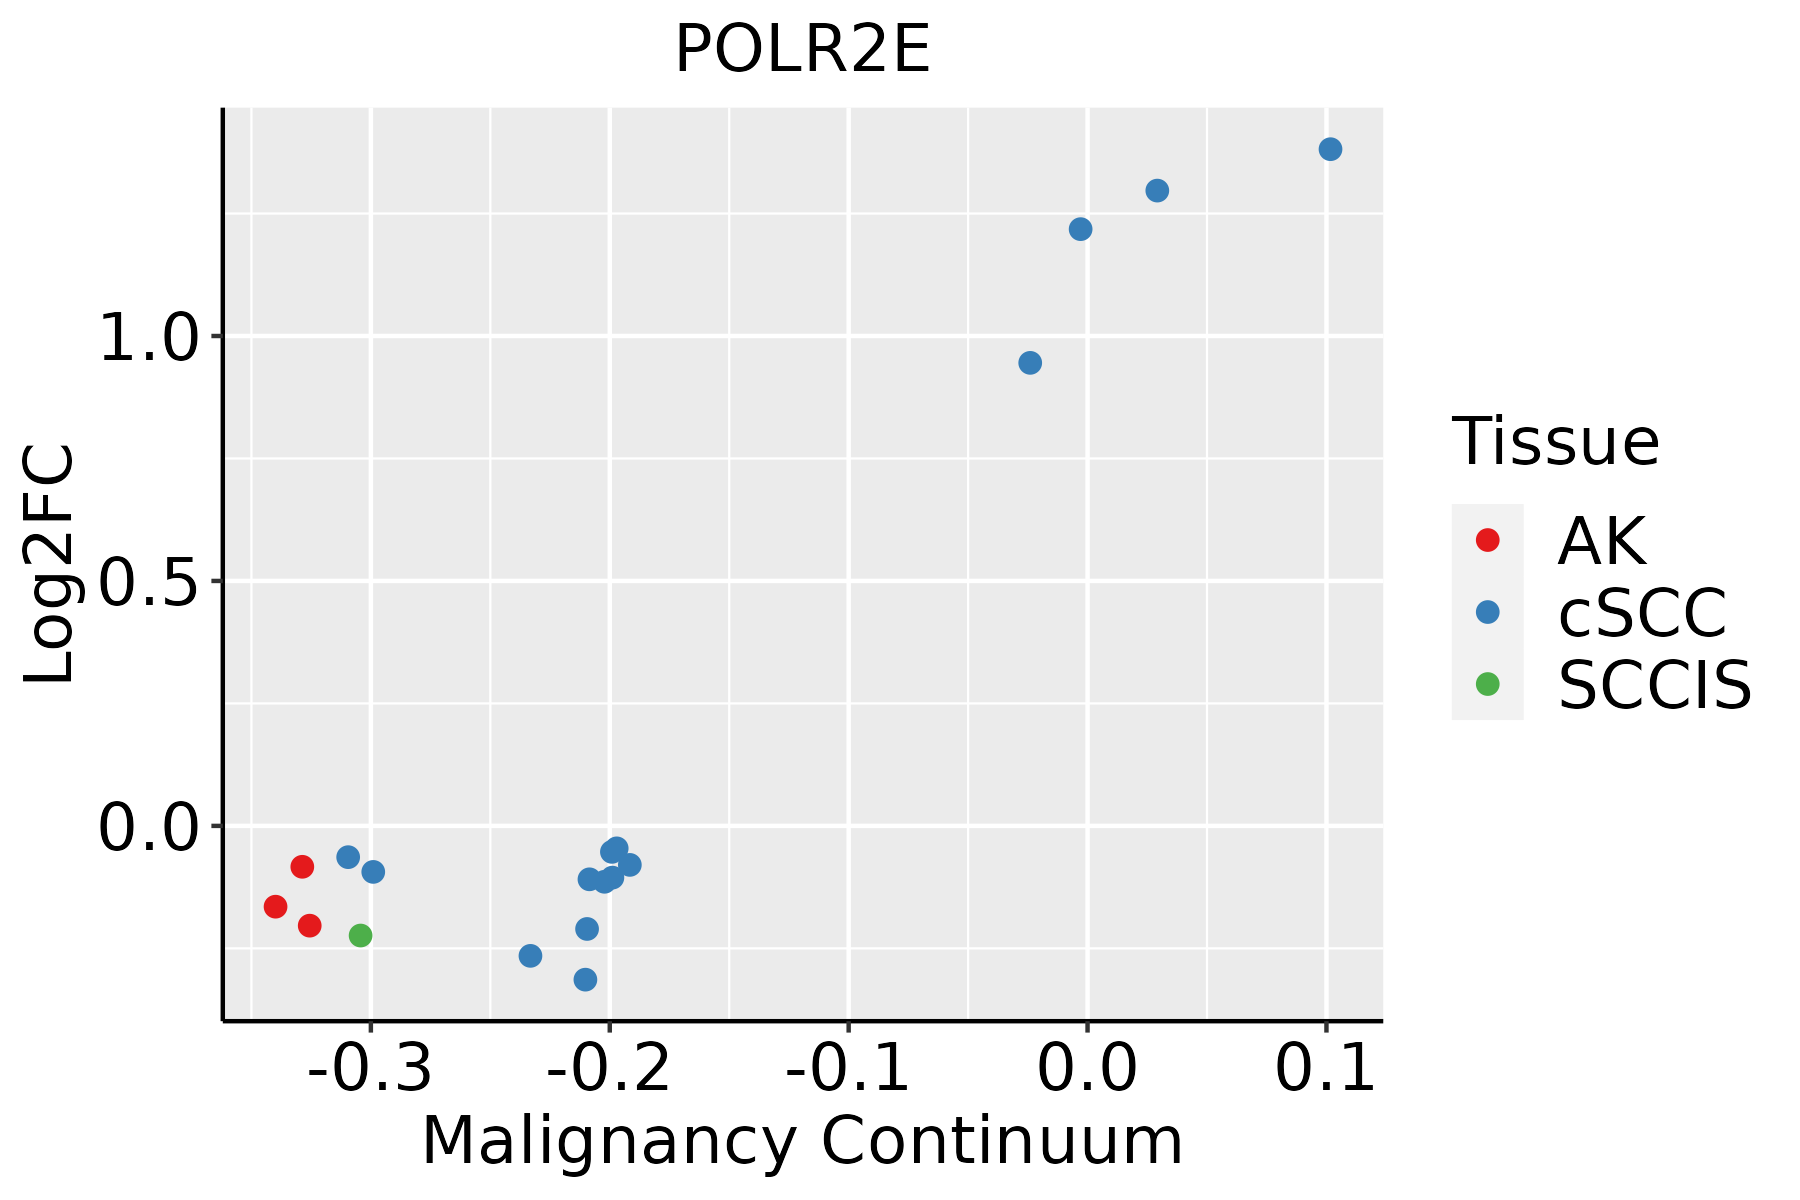 | AK: Actinic keratosis |
| cSCC: Cutaneous squamous cell carcinoma | ||
| SCCIS:squamous cell carcinoma in situ | ||
| Thyroid | 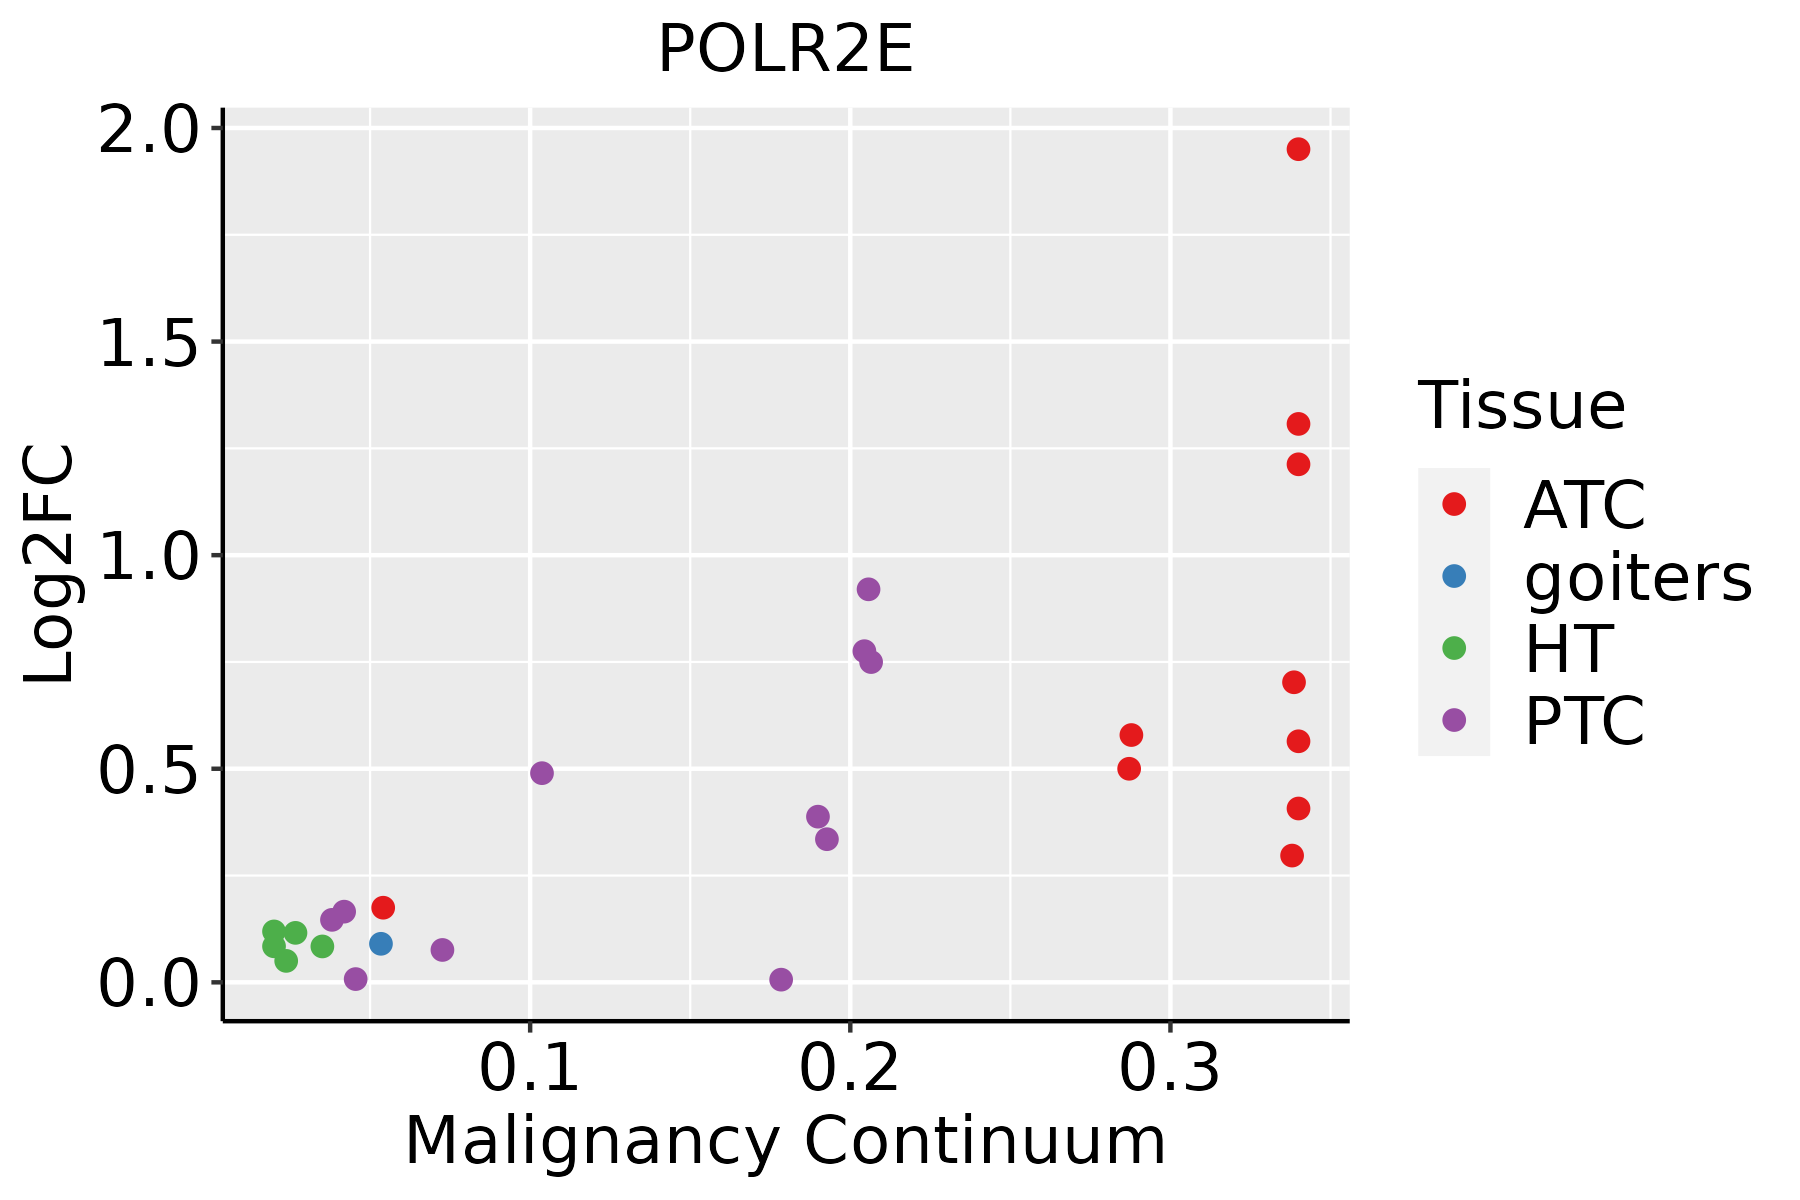 | ATC: Anaplastic thyroid cancer |
| HT: Hashimoto's thyroiditis | ||
| PTC: Papillary thyroid cancer |
| ∗log2FC in expression of this searched gene in stem-like cells from each diseased tissue sample relative to stem-like cells in normal samples in each tissue plotted against the malignancy continuum. Samples are colored based on if they are from different disease stage. |
Top |
Malignant transformation related pathway analysis |
| Find out the enriched GO biological processes and KEGG pathways involved in transition from healthy to precancer to cancer |
| Tissue | Disease Stage | Enriched GO biological Processes |
| Colorectum | AD |  |
| Colorectum | SER |  |
| Colorectum | MSS |  |
| Colorectum | MSI-H |  |
| Colorectum | FAP |  |
| ∗Top 15 enriched GO BP terms are showed in the bar plot of each disease state in each tissue. Each row represents a significant GO biological process which is colored according to the -log10(p.adjust). |
| Page: 1 2 3 4 5 6 7 8 9 |
| GO ID | Tissue | Disease Stage | Description | Gene Ratio | Bg Ratio | pvalue | p.adjust | Count |
| Page: 1 |
| Pathway ID | Tissue | Disease Stage | Description | Gene Ratio | Bg Ratio | pvalue | p.adjust | qvalue | Count |
| hsa05016 | Colorectum | AD | Huntington disease | 147/2092 | 306/8465 | 1.93e-19 | 9.26e-18 | 5.91e-18 | 147 |
| hsa050161 | Colorectum | AD | Huntington disease | 147/2092 | 306/8465 | 1.93e-19 | 9.26e-18 | 5.91e-18 | 147 |
| hsa050162 | Colorectum | SER | Huntington disease | 127/1580 | 306/8465 | 3.29e-21 | 1.37e-19 | 9.92e-20 | 127 |
| hsa050163 | Colorectum | SER | Huntington disease | 127/1580 | 306/8465 | 3.29e-21 | 1.37e-19 | 9.92e-20 | 127 |
| hsa050164 | Colorectum | MSS | Huntington disease | 141/1875 | 306/8465 | 2.90e-21 | 1.62e-19 | 9.92e-20 | 141 |
| hsa050165 | Colorectum | MSS | Huntington disease | 141/1875 | 306/8465 | 2.90e-21 | 1.62e-19 | 9.92e-20 | 141 |
| hsa05016210 | Esophagus | ESCC | Huntington disease | 226/4205 | 306/8465 | 1.38e-18 | 8.72e-17 | 4.46e-17 | 226 |
| hsa0342022 | Esophagus | ESCC | Nucleotide excision repair | 54/4205 | 63/8465 | 2.01e-09 | 2.17e-08 | 1.11e-08 | 54 |
| hsa0302021 | Esophagus | ESCC | RNA polymerase | 28/4205 | 34/8465 | 8.19e-05 | 3.35e-04 | 1.71e-04 | 28 |
| hsa046234 | Esophagus | ESCC | Cytosolic DNA-sensing pathway | 49/4205 | 75/8465 | 4.35e-03 | 1.12e-02 | 5.74e-03 | 49 |
| hsa0501638 | Esophagus | ESCC | Huntington disease | 226/4205 | 306/8465 | 1.38e-18 | 8.72e-17 | 4.46e-17 | 226 |
| hsa0342032 | Esophagus | ESCC | Nucleotide excision repair | 54/4205 | 63/8465 | 2.01e-09 | 2.17e-08 | 1.11e-08 | 54 |
| hsa0302031 | Esophagus | ESCC | RNA polymerase | 28/4205 | 34/8465 | 8.19e-05 | 3.35e-04 | 1.71e-04 | 28 |
| hsa0462311 | Esophagus | ESCC | Cytosolic DNA-sensing pathway | 49/4205 | 75/8465 | 4.35e-03 | 1.12e-02 | 5.74e-03 | 49 |
| hsa0501614 | Liver | Cirrhotic | Huntington disease | 172/2530 | 306/8465 | 1.65e-22 | 1.10e-20 | 6.77e-21 | 172 |
| hsa03420 | Liver | Cirrhotic | Nucleotide excision repair | 29/2530 | 63/8465 | 4.81e-03 | 1.74e-02 | 1.07e-02 | 29 |
| hsa0501615 | Liver | Cirrhotic | Huntington disease | 172/2530 | 306/8465 | 1.65e-22 | 1.10e-20 | 6.77e-21 | 172 |
| hsa034201 | Liver | Cirrhotic | Nucleotide excision repair | 29/2530 | 63/8465 | 4.81e-03 | 1.74e-02 | 1.07e-02 | 29 |
| hsa0501622 | Liver | HCC | Huntington disease | 219/4020 | 306/8465 | 3.06e-18 | 3.42e-16 | 1.90e-16 | 219 |
| hsa034202 | Liver | HCC | Nucleotide excision repair | 41/4020 | 63/8465 | 3.59e-03 | 1.12e-02 | 6.22e-03 | 41 |
| Page: 1 2 |
Top |
Cell-cell communication analysis |
| Identification of potential cell-cell interactions between two cell types and their ligand-receptor pairs for different disease states |
| Ligand | Receptor | LRpair | Pathway | Tissue | Disease Stage |
| Page: 1 |
Top |
Single-cell gene regulatory network inference analysis |
| Find out the significant the regulons (TFs) and the target genes of each regulon across cell types for different disease states |
| TF | Cell Type | Tissue | Disease Stage | Target Gene | RSS | Regulon Activity |
| ∗The dot plots of a searched regulon are shown for all cell subpopulations in each disease state of each tissue based on the regulon specific score inferred using pySCENIC and by calculating the average expression. |
| Page: 1 |
Top |
Somatic mutation of malignant transformation related genes |
| Annotation of somatic variants for genes involved in malignant transformation |
| Hugo Symbol | Variant Class | Variant Classification | dbSNP RS | HGVSc | HGVSp | HGVSp Short | SWISSPROT | BIOTYPE | SIFT | PolyPhen | Tumor Sample Barcode | Tissue | Histology | Sex | Age | Stage | Therapy Types | Drugs | Outcome |
| POLR2E | SNV | Missense_Mutation | novel | c.524N>T | p.Ala175Val | p.A175V | P19388 | protein_coding | tolerated(1) | benign(0) | TCGA-AC-A4ZE-01 | Breast | breast invasive carcinoma | Female | <65 | I/II | Unknown | Unknown | SD |
| POLR2E | insertion | Frame_Shift_Ins | novel | c.419_420insTAAAAATACAAAAAAATTAGCCAGGCGT | p.Glu141LysfsTer16 | p.E141Kfs*16 | P19388 | protein_coding | TCGA-B6-A0IA-01 | Breast | breast invasive carcinoma | Female | <65 | I/II | Unknown | Unknown | SD | ||
| POLR2E | SNV | Missense_Mutation | c.427G>A | p.Glu143Lys | p.E143K | P19388 | protein_coding | tolerated(0.71) | benign(0.15) | TCGA-EA-A43B-01 | Cervix | cervical & endocervical cancer | Female | <65 | I/II | Chemotherapy | cisplatin | CR | |
| POLR2E | SNV | Missense_Mutation | rs766399285 | c.358G>A | p.Asp120Asn | p.D120N | P19388 | protein_coding | deleterious(0.02) | benign(0.097) | TCGA-AA-3984-01 | Colorectum | colon adenocarcinoma | Female | <65 | I/II | Unknown | Unknown | SD |
| POLR2E | SNV | Missense_Mutation | c.265N>A | p.Val89Met | p.V89M | P19388 | protein_coding | tolerated(0.11) | benign(0.003) | TCGA-CK-4951-01 | Colorectum | colon adenocarcinoma | Female | >=65 | I/II | Unknown | Unknown | PD | |
| POLR2E | SNV | Missense_Mutation | c.515N>T | p.Arg172Met | p.R172M | P19388 | protein_coding | deleterious(0) | probably_damaging(0.992) | TCGA-F4-6856-01 | Colorectum | colon adenocarcinoma | Male | <65 | I/II | Ancillary | leucovorin | CR | |
| POLR2E | SNV | Missense_Mutation | c.412A>G | p.Asn138Asp | p.N138D | P19388 | protein_coding | tolerated(0.06) | probably_damaging(0.936) | TCGA-AP-A056-01 | Endometrium | uterine corpus endometrioid carcinoma | Female | <65 | I/II | Unknown | Unknown | SD | |
| POLR2E | SNV | Missense_Mutation | novel | c.268N>C | p.Tyr90His | p.Y90H | P19388 | protein_coding | deleterious(0.01) | probably_damaging(0.976) | TCGA-AX-A2HA-01 | Endometrium | uterine corpus endometrioid carcinoma | Female | <65 | I/II | Unknown | Unknown | SD |
| POLR2E | SNV | Missense_Mutation | rs370150594 | c.584G>A | p.Arg195Gln | p.R195Q | P19388 | protein_coding | deleterious(0.02) | probably_damaging(0.927) | TCGA-EO-A22U-01 | Endometrium | uterine corpus endometrioid carcinoma | Female | >=65 | I/II | Unknown | Unknown | SD |
| POLR2E | SNV | Missense_Mutation | novel | c.4G>A | p.Asp2Asn | p.D2N | P19388 | protein_coding | tolerated(0.26) | benign(0.023) | TCGA-EO-A22U-01 | Endometrium | uterine corpus endometrioid carcinoma | Female | >=65 | I/II | Unknown | Unknown | SD |
| Page: 1 2 |
Top |
Related drugs of malignant transformation related genes |
| Identification of chemicals and drugs interact with genes involved in malignant transfromation |
| (DGIdb 4.0) |
| Entrez ID | Symbol | Category | Interaction Types | Drug Claim Name | Drug Name | PMIDs |
| Page: 1 |

Copyright 2023-Present -The University of Texas Health Science Center at Houston |