
|
|||||
|
 | |
| |
| |
| |
| |
| |
|
Gene: POLR2C |
Gene summary for POLR2C |
| Gene information | Species | Human | Gene symbol | POLR2C | Gene ID | 5432 |
| Gene name | RNA polymerase II subunit C | |
| Gene Alias | RPB3 | |
| Cytomap | 16q21 | |
| Gene Type | protein-coding | GO ID | GO:0006139 | UniProtAcc | P19387 |
Top |
Malignant transformation analysis |
| Identification of the aberrant gene expression in precancerous and cancerous lesions by comparing the gene expression of stem-like cells in diseased tissues with normal stem cells |
| Entrez ID | Symbol | Replicates | Species | Organ | Tissue | Adj P-value | Log2FC | Malignancy |
| 5432 | POLR2C | LZE4T | Human | Esophagus | ESCC | 3.18e-24 | 7.25e-01 | 0.0811 |
| 5432 | POLR2C | LZE5T | Human | Esophagus | ESCC | 5.07e-03 | 1.76e-01 | 0.0514 |
| 5432 | POLR2C | LZE7T | Human | Esophagus | ESCC | 6.25e-17 | 9.72e-01 | 0.0667 |
| 5432 | POLR2C | LZE8T | Human | Esophagus | ESCC | 4.92e-08 | 3.12e-01 | 0.067 |
| 5432 | POLR2C | LZE20T | Human | Esophagus | ESCC | 1.48e-08 | 3.82e-01 | 0.0662 |
| 5432 | POLR2C | LZE22D1 | Human | Esophagus | HGIN | 2.25e-02 | 1.05e-01 | 0.0595 |
| 5432 | POLR2C | LZE22T | Human | Esophagus | ESCC | 6.22e-07 | 5.30e-01 | 0.068 |
| 5432 | POLR2C | LZE24T | Human | Esophagus | ESCC | 3.45e-27 | 7.78e-01 | 0.0596 |
| 5432 | POLR2C | LZE21T | Human | Esophagus | ESCC | 1.92e-04 | 3.61e-01 | 0.0655 |
| 5432 | POLR2C | P1T-E | Human | Esophagus | ESCC | 3.81e-07 | 7.12e-01 | 0.0875 |
| 5432 | POLR2C | P2T-E | Human | Esophagus | ESCC | 1.81e-27 | 5.15e-01 | 0.1177 |
| 5432 | POLR2C | P4T-E | Human | Esophagus | ESCC | 2.12e-41 | 1.09e+00 | 0.1323 |
| 5432 | POLR2C | P5T-E | Human | Esophagus | ESCC | 2.39e-31 | 7.63e-01 | 0.1327 |
| 5432 | POLR2C | P8T-E | Human | Esophagus | ESCC | 4.09e-46 | 8.98e-01 | 0.0889 |
| 5432 | POLR2C | P9T-E | Human | Esophagus | ESCC | 2.32e-15 | 3.61e-01 | 0.1131 |
| 5432 | POLR2C | P10T-E | Human | Esophagus | ESCC | 4.53e-41 | 7.36e-01 | 0.116 |
| 5432 | POLR2C | P11T-E | Human | Esophagus | ESCC | 5.77e-25 | 9.61e-01 | 0.1426 |
| 5432 | POLR2C | P12T-E | Human | Esophagus | ESCC | 1.50e-35 | 7.06e-01 | 0.1122 |
| 5432 | POLR2C | P15T-E | Human | Esophagus | ESCC | 1.98e-50 | 1.03e+00 | 0.1149 |
| 5432 | POLR2C | P16T-E | Human | Esophagus | ESCC | 5.23e-43 | 8.05e-01 | 0.1153 |
| Page: 1 2 3 4 5 6 |
| Tissue | Expression Dynamics | Abbreviation |
| Esophagus | 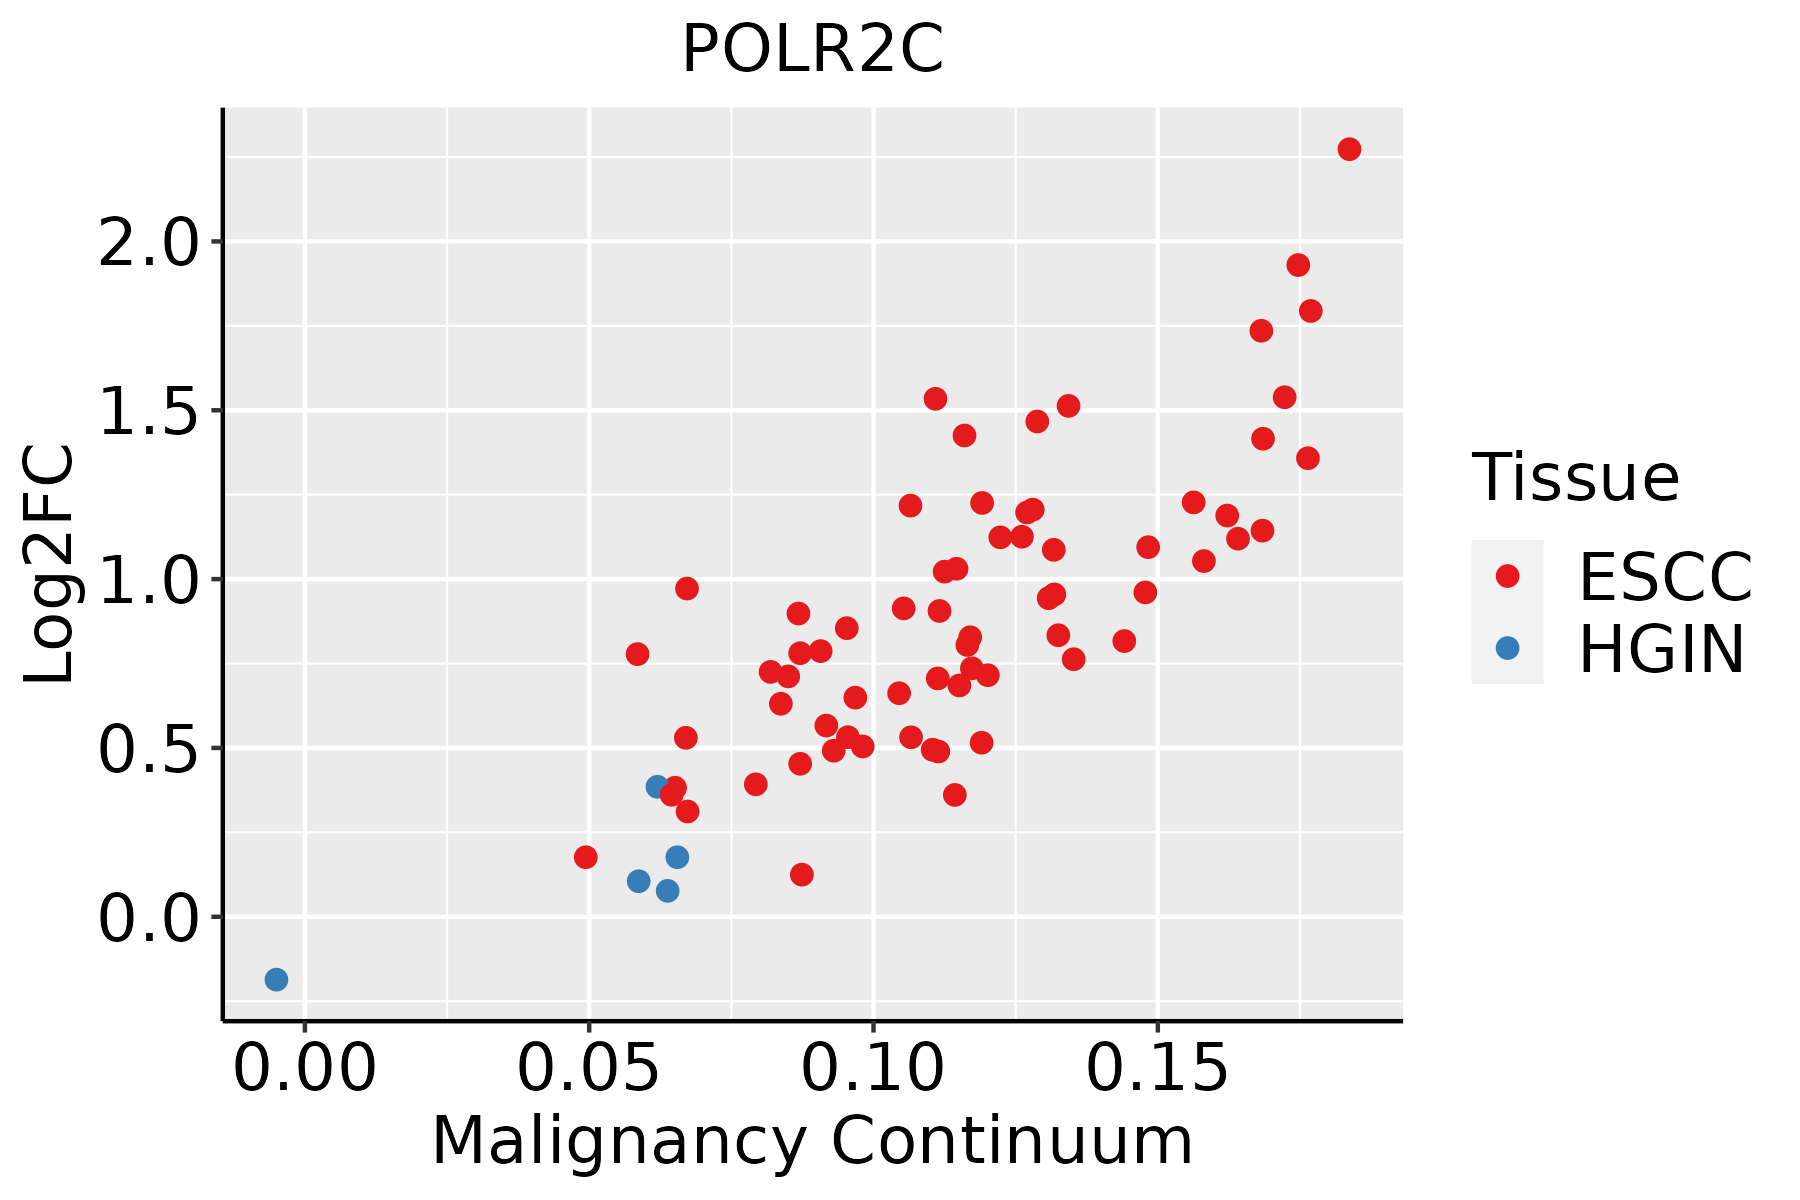 | ESCC: Esophageal squamous cell carcinoma |
| HGIN: High-grade intraepithelial neoplasias | ||
| LGIN: Low-grade intraepithelial neoplasias | ||
| Liver | 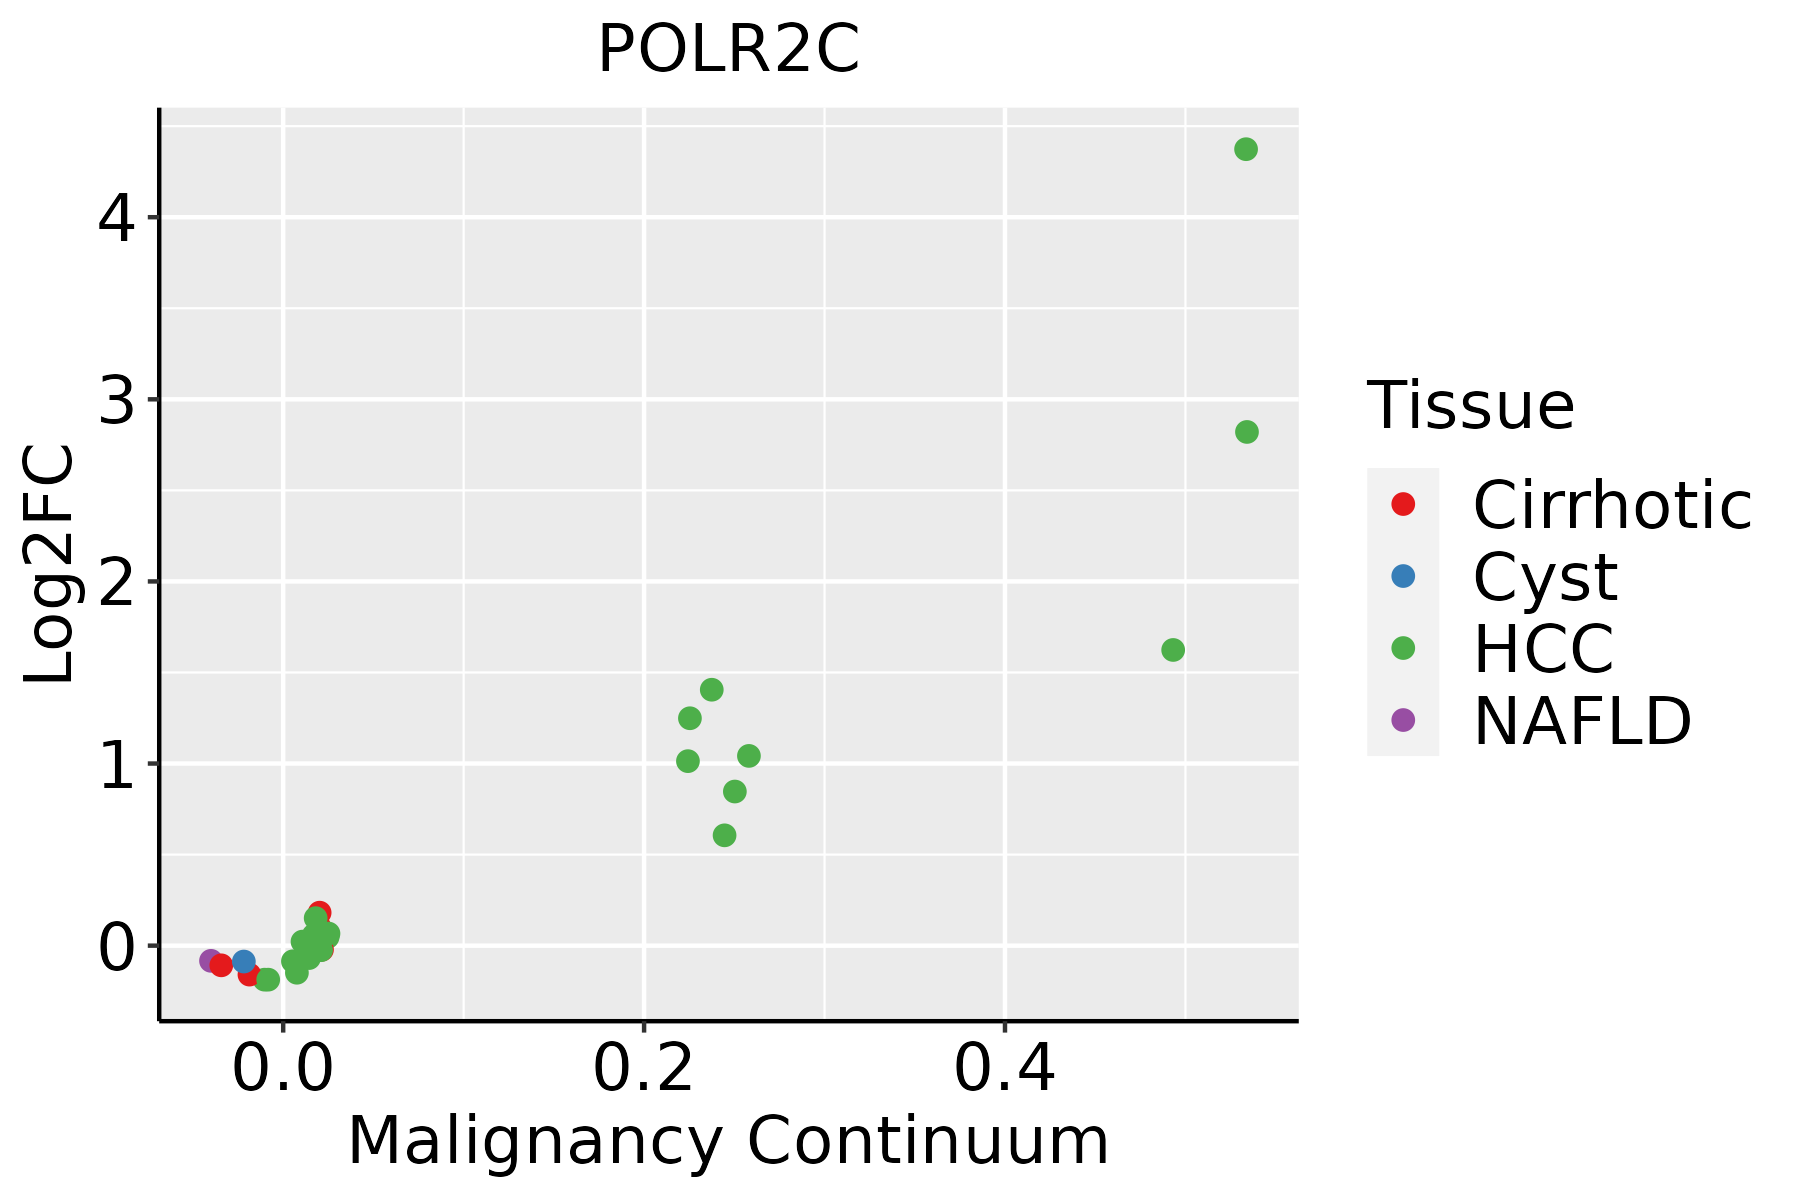 | HCC: Hepatocellular carcinoma |
| NAFLD: Non-alcoholic fatty liver disease | ||
| Oral Cavity | 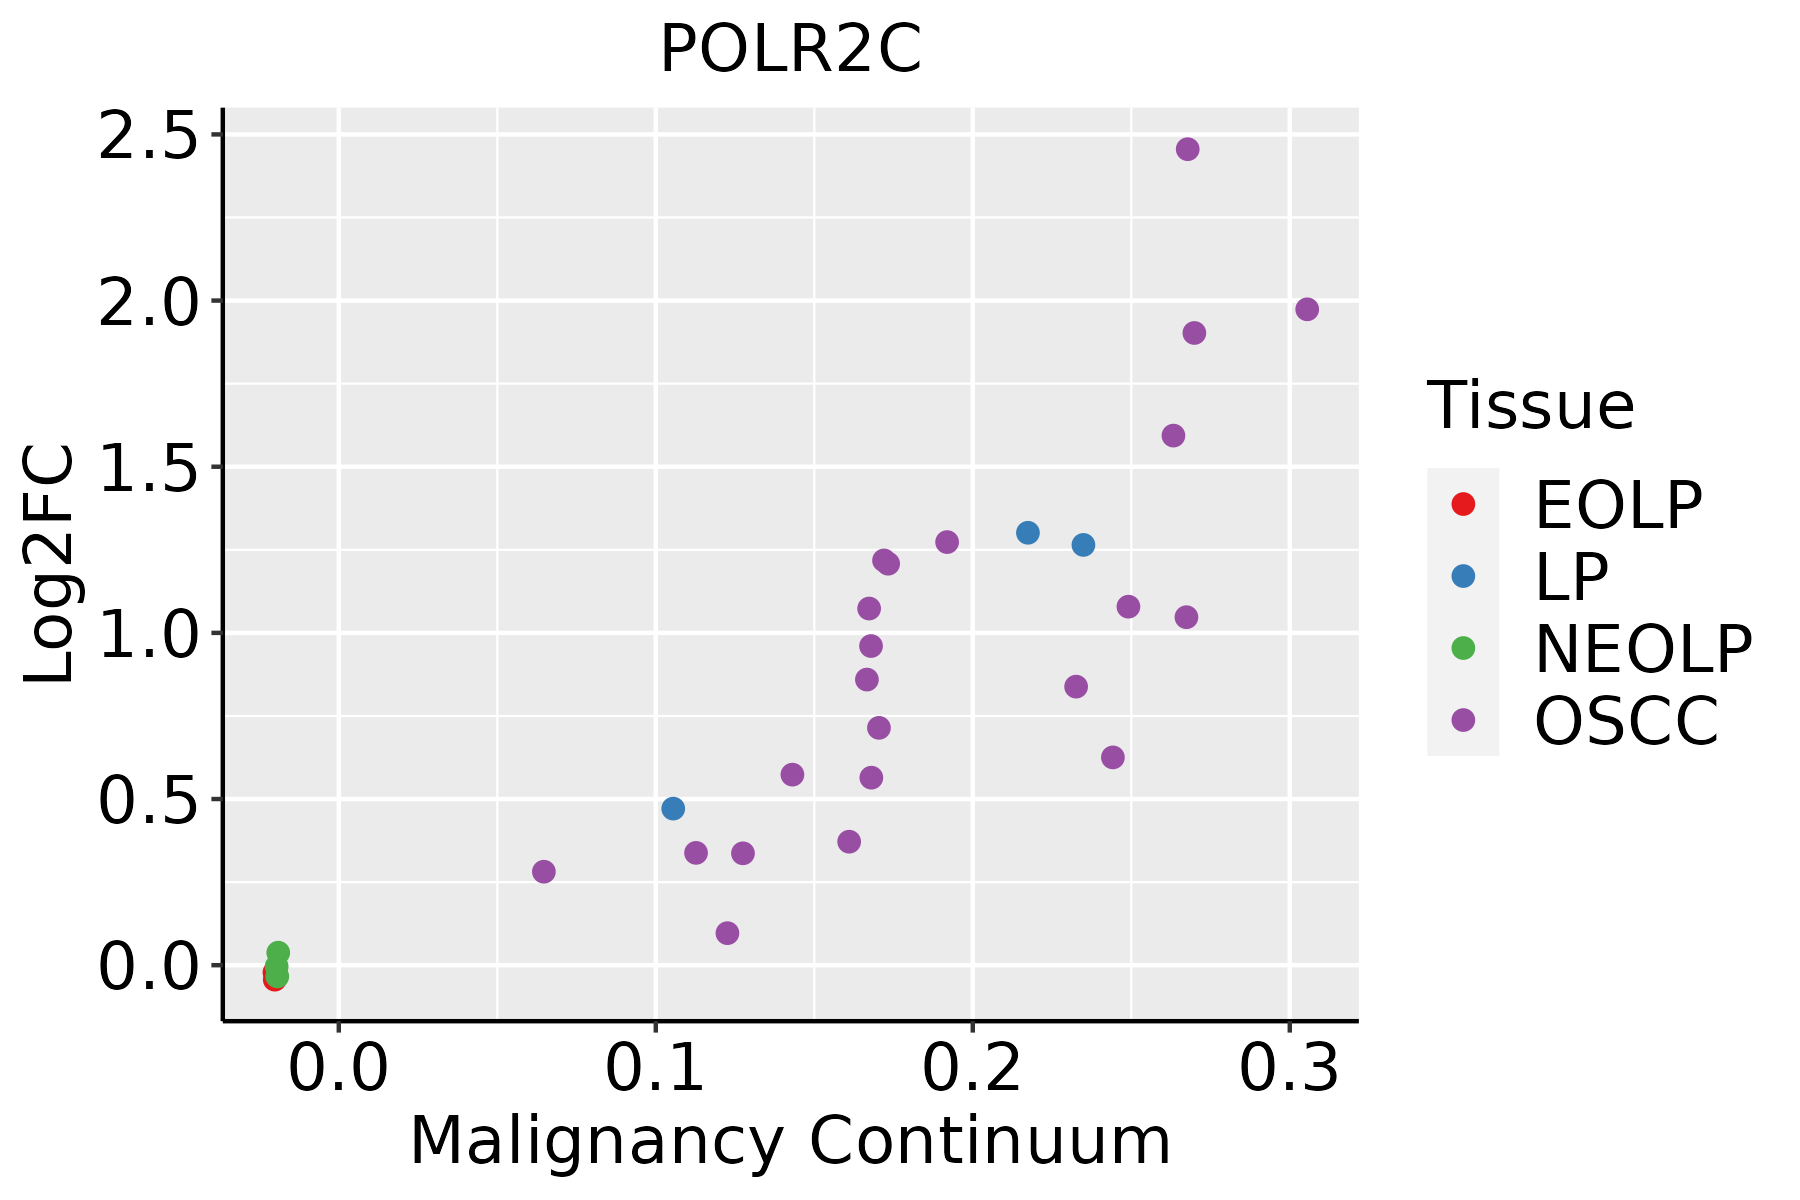 | EOLP: Erosive Oral lichen planus |
| LP: leukoplakia | ||
| NEOLP: Non-erosive oral lichen planus | ||
| OSCC: Oral squamous cell carcinoma | ||
| Skin | 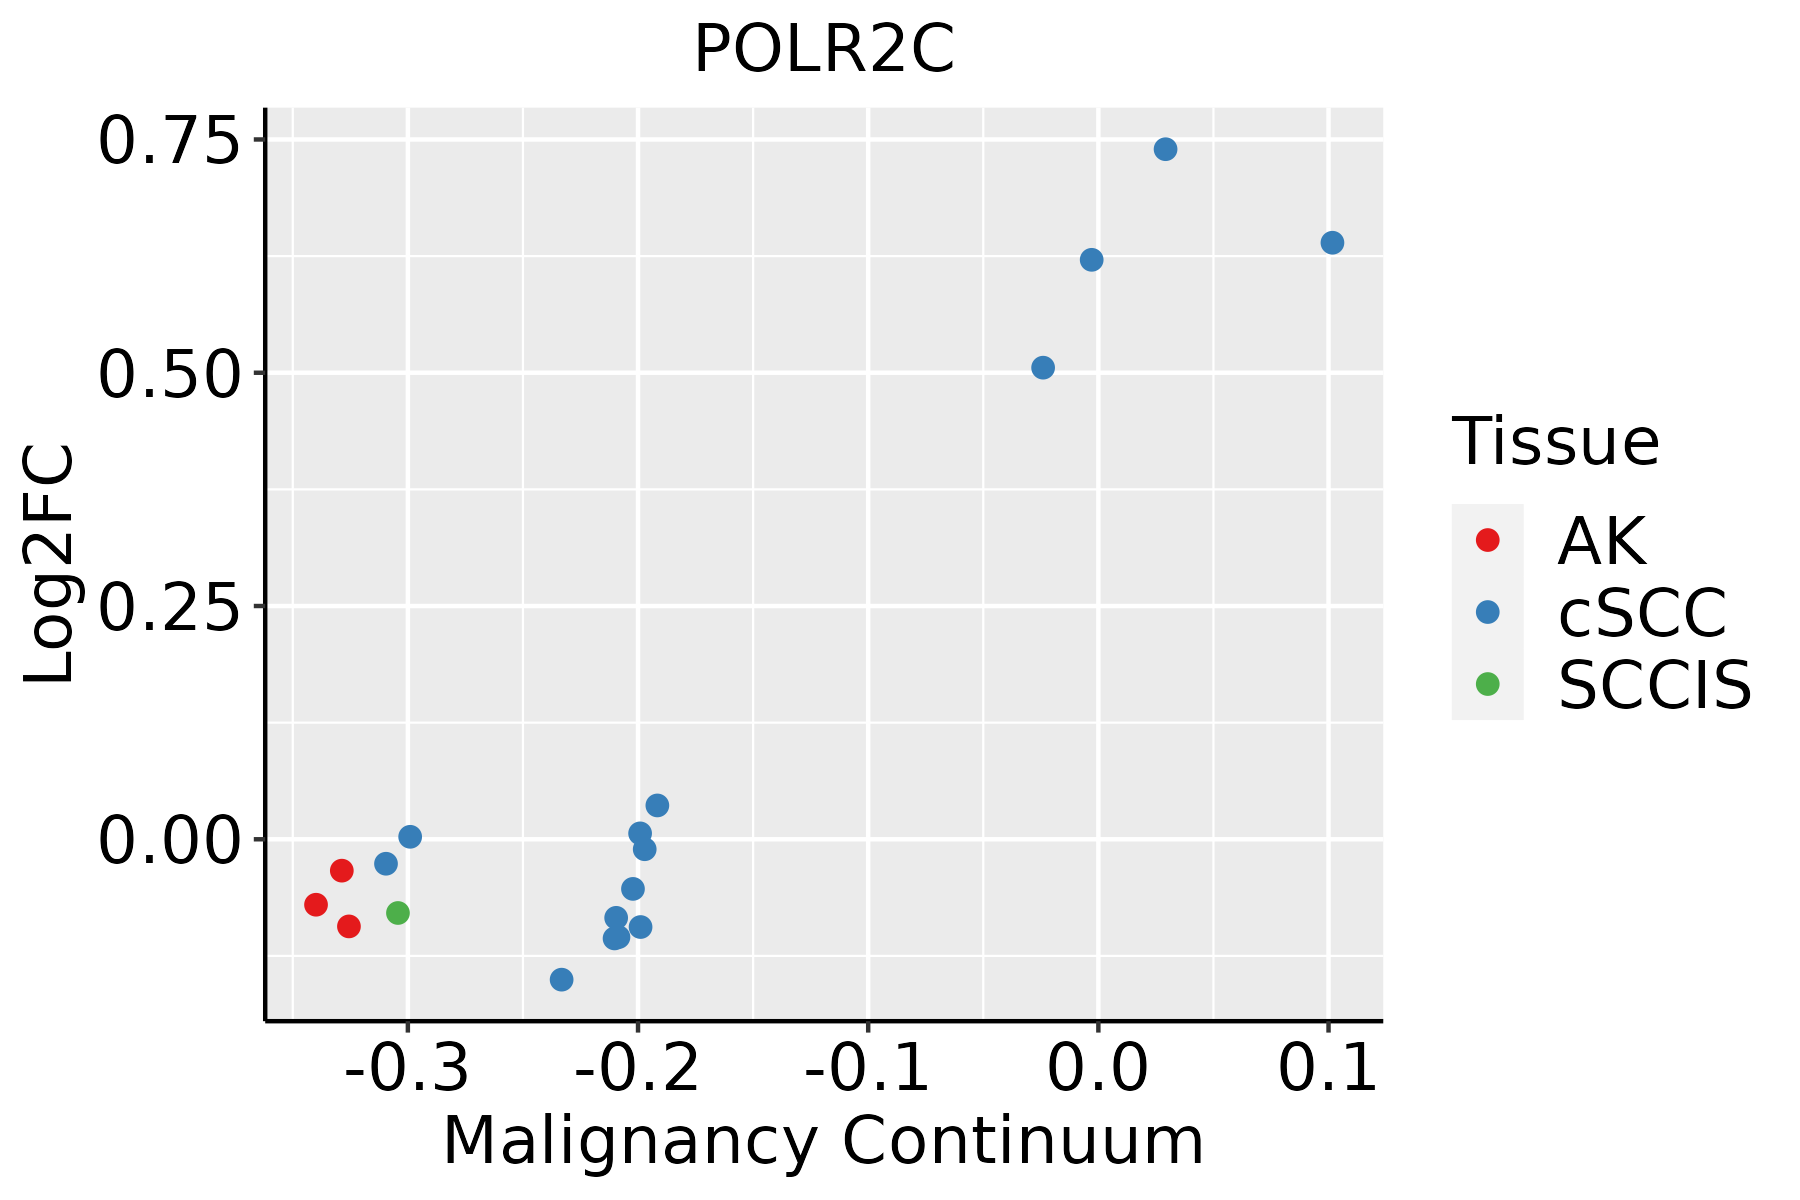 | AK: Actinic keratosis |
| cSCC: Cutaneous squamous cell carcinoma | ||
| SCCIS:squamous cell carcinoma in situ | ||
| Thyroid | 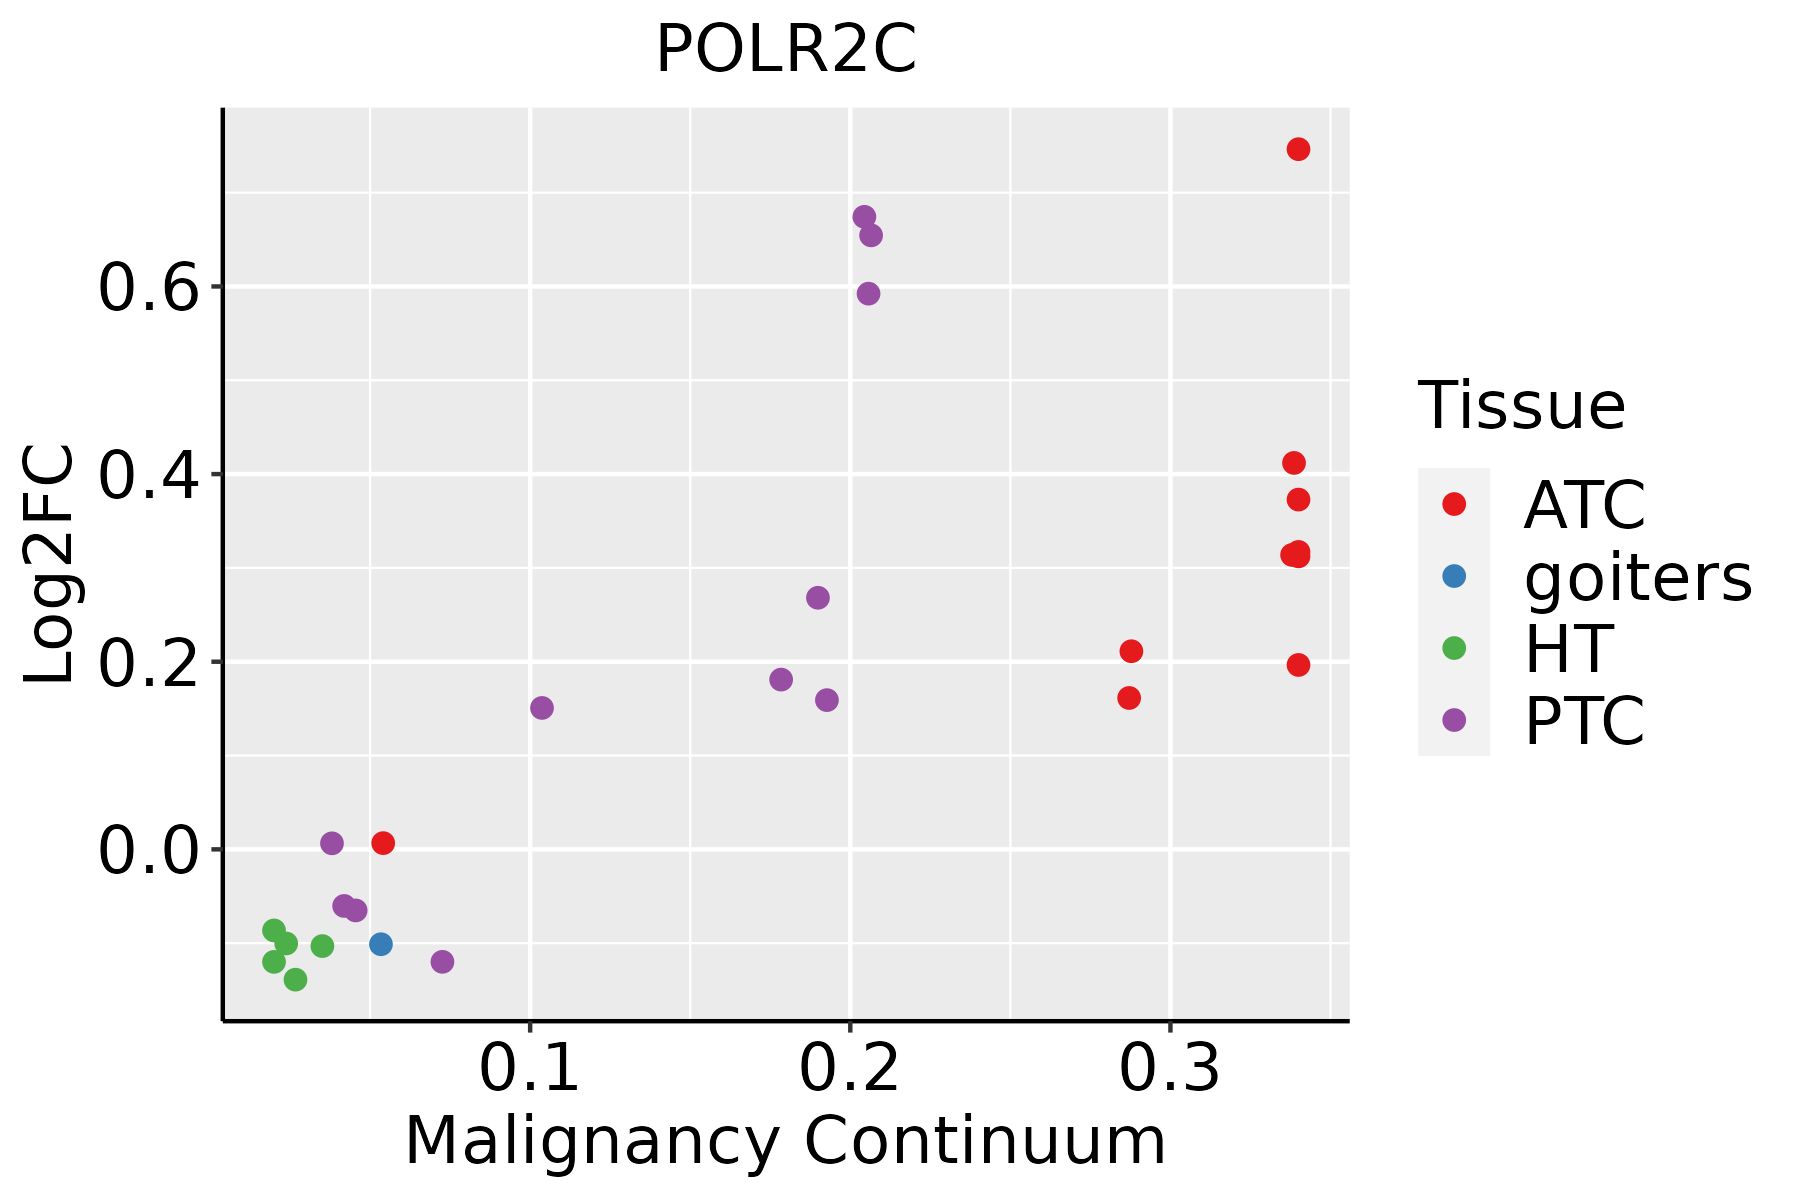 | ATC: Anaplastic thyroid cancer |
| HT: Hashimoto's thyroiditis | ||
| PTC: Papillary thyroid cancer |
| ∗log2FC in expression of this searched gene in stem-like cells from each diseased tissue sample relative to stem-like cells in normal samples in each tissue plotted against the malignancy continuum. Samples are colored based on if they are from different disease stage. |
Top |
Malignant transformation related pathway analysis |
| Find out the enriched GO biological processes and KEGG pathways involved in transition from healthy to precancer to cancer |
| Tissue | Disease Stage | Enriched GO biological Processes |
| Colorectum | AD |  |
| Colorectum | SER |  |
| Colorectum | MSS |  |
| Colorectum | MSI-H |  |
| Colorectum | FAP |  |
| ∗Top 15 enriched GO BP terms are showed in the bar plot of each disease state in each tissue. Each row represents a significant GO biological process which is colored according to the -log10(p.adjust). |
| Page: 1 2 3 4 5 6 7 8 9 |
| GO ID | Tissue | Disease Stage | Description | Gene Ratio | Bg Ratio | pvalue | p.adjust | Count |
| Page: 1 |
| Pathway ID | Tissue | Disease Stage | Description | Gene Ratio | Bg Ratio | pvalue | p.adjust | qvalue | Count |
| hsa0501630 | Esophagus | HGIN | Huntington disease | 129/1383 | 306/8465 | 6.81e-28 | 7.41e-26 | 5.88e-26 | 129 |
| hsa034205 | Esophagus | HGIN | Nucleotide excision repair | 29/1383 | 63/8465 | 2.96e-08 | 5.36e-07 | 4.26e-07 | 29 |
| hsa030205 | Esophagus | HGIN | RNA polymerase | 12/1383 | 34/8465 | 5.62e-03 | 3.99e-02 | 3.17e-02 | 12 |
| hsa05016113 | Esophagus | HGIN | Huntington disease | 129/1383 | 306/8465 | 6.81e-28 | 7.41e-26 | 5.88e-26 | 129 |
| hsa0342012 | Esophagus | HGIN | Nucleotide excision repair | 29/1383 | 63/8465 | 2.96e-08 | 5.36e-07 | 4.26e-07 | 29 |
| hsa0302012 | Esophagus | HGIN | RNA polymerase | 12/1383 | 34/8465 | 5.62e-03 | 3.99e-02 | 3.17e-02 | 12 |
| hsa05016210 | Esophagus | ESCC | Huntington disease | 226/4205 | 306/8465 | 1.38e-18 | 8.72e-17 | 4.46e-17 | 226 |
| hsa0342022 | Esophagus | ESCC | Nucleotide excision repair | 54/4205 | 63/8465 | 2.01e-09 | 2.17e-08 | 1.11e-08 | 54 |
| hsa0302021 | Esophagus | ESCC | RNA polymerase | 28/4205 | 34/8465 | 8.19e-05 | 3.35e-04 | 1.71e-04 | 28 |
| hsa0501638 | Esophagus | ESCC | Huntington disease | 226/4205 | 306/8465 | 1.38e-18 | 8.72e-17 | 4.46e-17 | 226 |
| hsa0342032 | Esophagus | ESCC | Nucleotide excision repair | 54/4205 | 63/8465 | 2.01e-09 | 2.17e-08 | 1.11e-08 | 54 |
| hsa0302031 | Esophagus | ESCC | RNA polymerase | 28/4205 | 34/8465 | 8.19e-05 | 3.35e-04 | 1.71e-04 | 28 |
| hsa0501614 | Liver | Cirrhotic | Huntington disease | 172/2530 | 306/8465 | 1.65e-22 | 1.10e-20 | 6.77e-21 | 172 |
| hsa03420 | Liver | Cirrhotic | Nucleotide excision repair | 29/2530 | 63/8465 | 4.81e-03 | 1.74e-02 | 1.07e-02 | 29 |
| hsa0501615 | Liver | Cirrhotic | Huntington disease | 172/2530 | 306/8465 | 1.65e-22 | 1.10e-20 | 6.77e-21 | 172 |
| hsa034201 | Liver | Cirrhotic | Nucleotide excision repair | 29/2530 | 63/8465 | 4.81e-03 | 1.74e-02 | 1.07e-02 | 29 |
| hsa0501622 | Liver | HCC | Huntington disease | 219/4020 | 306/8465 | 3.06e-18 | 3.42e-16 | 1.90e-16 | 219 |
| hsa034202 | Liver | HCC | Nucleotide excision repair | 41/4020 | 63/8465 | 3.59e-03 | 1.12e-02 | 6.22e-03 | 41 |
| hsa03020 | Liver | HCC | RNA polymerase | 24/4020 | 34/8465 | 5.40e-03 | 1.57e-02 | 8.75e-03 | 24 |
| hsa0501632 | Liver | HCC | Huntington disease | 219/4020 | 306/8465 | 3.06e-18 | 3.42e-16 | 1.90e-16 | 219 |
| Page: 1 2 |
Top |
Cell-cell communication analysis |
| Identification of potential cell-cell interactions between two cell types and their ligand-receptor pairs for different disease states |
| Ligand | Receptor | LRpair | Pathway | Tissue | Disease Stage |
| Page: 1 |
Top |
Single-cell gene regulatory network inference analysis |
| Find out the significant the regulons (TFs) and the target genes of each regulon across cell types for different disease states |
| TF | Cell Type | Tissue | Disease Stage | Target Gene | RSS | Regulon Activity |
| ∗The dot plots of a searched regulon are shown for all cell subpopulations in each disease state of each tissue based on the regulon specific score inferred using pySCENIC and by calculating the average expression. |
| Page: 1 |
Top |
Somatic mutation of malignant transformation related genes |
| Annotation of somatic variants for genes involved in malignant transformation |
| Hugo Symbol | Variant Class | Variant Classification | dbSNP RS | HGVSc | HGVSp | HGVSp Short | SWISSPROT | BIOTYPE | SIFT | PolyPhen | Tumor Sample Barcode | Tissue | Histology | Sex | Age | Stage | Therapy Types | Drugs | Outcome |
| POLR2C | SNV | Missense_Mutation | novel | c.756N>T | p.Leu252Phe | p.L252F | P19387 | protein_coding | deleterious(0) | probably_damaging(1) | TCGA-MA-AA41-01 | Cervix | cervical & endocervical cancer | Female | <65 | I/II | Unknown | Unknown | SD |
| POLR2C | SNV | Missense_Mutation | rs780994092 | c.335N>T | p.Thr112Met | p.T112M | P19387 | protein_coding | deleterious(0.01) | probably_damaging(0.937) | TCGA-CM-5861-01 | Colorectum | colon adenocarcinoma | Female | <65 | I/II | Unknown | Unknown | PD |
| POLR2C | SNV | Missense_Mutation | novel | c.436N>A | p.Asp146Asn | p.D146N | P19387 | protein_coding | tolerated(0.09) | benign(0.022) | TCGA-AG-A014-01 | Colorectum | rectum adenocarcinoma | Male | >=65 | I/II | Unknown | Unknown | SD |
| POLR2C | SNV | Missense_Mutation | novel | c.823N>C | p.Asn275His | p.N275H | P19387 | protein_coding | tolerated_low_confidence(0.08) | benign(0.018) | TCGA-A5-A0G2-01 | Endometrium | uterine corpus endometrioid carcinoma | Female | <65 | III/IV | Unknown | Unknown | SD |
| POLR2C | SNV | Missense_Mutation | novel | c.220N>G | p.Ile74Val | p.I74V | P19387 | protein_coding | tolerated(0.36) | benign(0.021) | TCGA-AJ-A3EK-01 | Endometrium | uterine corpus endometrioid carcinoma | Female | <65 | I/II | Chemotherapy | carboplatin | CR |
| POLR2C | SNV | Missense_Mutation | novel | c.131T>C | p.Ile44Thr | p.I44T | P19387 | protein_coding | tolerated(1) | benign(0) | TCGA-AJ-A3EL-01 | Endometrium | uterine corpus endometrioid carcinoma | Female | <65 | I/II | Unknown | Unknown | SD |
| POLR2C | SNV | Missense_Mutation | c.619N>A | p.Glu207Lys | p.E207K | P19387 | protein_coding | tolerated(0.19) | probably_damaging(0.92) | TCGA-AX-A063-01 | Endometrium | uterine corpus endometrioid carcinoma | Female | <65 | I/II | Unknown | Unknown | SD | |
| POLR2C | SNV | Missense_Mutation | novel | c.697N>A | p.Val233Met | p.V233M | P19387 | protein_coding | deleterious(0) | probably_damaging(0.984) | TCGA-AX-A06F-01 | Endometrium | uterine corpus endometrioid carcinoma | Female | <65 | III/IV | Chemotherapy | carboplatin | SD |
| POLR2C | SNV | Missense_Mutation | rs756615725 | c.647N>T | p.Ser216Leu | p.S216L | P19387 | protein_coding | tolerated(0.65) | benign(0.007) | TCGA-AX-A2HC-01 | Endometrium | uterine corpus endometrioid carcinoma | Female | <65 | III/IV | Chemotherapy | paclitaxel | PD |
| POLR2C | SNV | Missense_Mutation | c.256N>T | p.Arg86Trp | p.R86W | P19387 | protein_coding | deleterious(0) | probably_damaging(1) | TCGA-B5-A11E-01 | Endometrium | uterine corpus endometrioid carcinoma | Female | <65 | I/II | Unknown | Unknown | SD |
| Page: 1 2 3 |
Top |
Related drugs of malignant transformation related genes |
| Identification of chemicals and drugs interact with genes involved in malignant transfromation |
| (DGIdb 4.0) |
| Entrez ID | Symbol | Category | Interaction Types | Drug Claim Name | Drug Name | PMIDs |
| Page: 1 |

Copyright 2023-Present -The University of Texas Health Science Center at Houston |