
|
|||||
|
 | |
| |
| |
| |
| |
| |
|
Gene: POLR2B |
Gene summary for POLR2B |
| Gene information | Species | Human | Gene symbol | POLR2B | Gene ID | 5431 |
| Gene name | RNA polymerase II subunit B | |
| Gene Alias | POL2RB | |
| Cytomap | 4q12 | |
| Gene Type | protein-coding | GO ID | GO:0006139 | UniProtAcc | B4DH29 |
Top |
Malignant transformation analysis |
| Identification of the aberrant gene expression in precancerous and cancerous lesions by comparing the gene expression of stem-like cells in diseased tissues with normal stem cells |
| Entrez ID | Symbol | Replicates | Species | Organ | Tissue | Adj P-value | Log2FC | Malignancy |
| 5431 | POLR2B | LZE4T | Human | Esophagus | ESCC | 4.04e-07 | 5.00e-01 | 0.0811 |
| 5431 | POLR2B | LZE7T | Human | Esophagus | ESCC | 5.95e-08 | 6.23e-01 | 0.0667 |
| 5431 | POLR2B | LZE8T | Human | Esophagus | ESCC | 8.42e-11 | 1.14e-01 | 0.067 |
| 5431 | POLR2B | LZE20T | Human | Esophagus | ESCC | 1.02e-02 | 6.43e-03 | 0.0662 |
| 5431 | POLR2B | LZE22T | Human | Esophagus | ESCC | 9.55e-04 | 5.71e-02 | 0.068 |
| 5431 | POLR2B | LZE24T | Human | Esophagus | ESCC | 3.11e-06 | 6.86e-02 | 0.0596 |
| 5431 | POLR2B | LZE21T | Human | Esophagus | ESCC | 9.78e-07 | 1.85e-01 | 0.0655 |
| 5431 | POLR2B | LZE6T | Human | Esophagus | ESCC | 3.80e-05 | 2.15e-01 | 0.0845 |
| 5431 | POLR2B | P1T-E | Human | Esophagus | ESCC | 6.18e-07 | 2.72e-01 | 0.0875 |
| 5431 | POLR2B | P2T-E | Human | Esophagus | ESCC | 2.61e-27 | 4.87e-01 | 0.1177 |
| 5431 | POLR2B | P4T-E | Human | Esophagus | ESCC | 3.78e-19 | 4.30e-01 | 0.1323 |
| 5431 | POLR2B | P5T-E | Human | Esophagus | ESCC | 1.02e-05 | 1.14e-01 | 0.1327 |
| 5431 | POLR2B | P8T-E | Human | Esophagus | ESCC | 1.05e-27 | 6.47e-01 | 0.0889 |
| 5431 | POLR2B | P9T-E | Human | Esophagus | ESCC | 6.15e-11 | 1.03e-01 | 0.1131 |
| 5431 | POLR2B | P10T-E | Human | Esophagus | ESCC | 1.21e-30 | 4.60e-01 | 0.116 |
| 5431 | POLR2B | P11T-E | Human | Esophagus | ESCC | 9.91e-08 | 2.67e-01 | 0.1426 |
| 5431 | POLR2B | P12T-E | Human | Esophagus | ESCC | 1.31e-29 | 5.30e-01 | 0.1122 |
| 5431 | POLR2B | P15T-E | Human | Esophagus | ESCC | 2.29e-24 | 4.91e-01 | 0.1149 |
| 5431 | POLR2B | P16T-E | Human | Esophagus | ESCC | 1.31e-38 | 6.32e-01 | 0.1153 |
| 5431 | POLR2B | P17T-E | Human | Esophagus | ESCC | 8.28e-09 | 2.99e-01 | 0.1278 |
| Page: 1 2 3 4 5 6 |
| Tissue | Expression Dynamics | Abbreviation |
| Esophagus |  | ESCC: Esophageal squamous cell carcinoma |
| HGIN: High-grade intraepithelial neoplasias | ||
| LGIN: Low-grade intraepithelial neoplasias | ||
| Liver |  | HCC: Hepatocellular carcinoma |
| NAFLD: Non-alcoholic fatty liver disease | ||
| Oral Cavity | 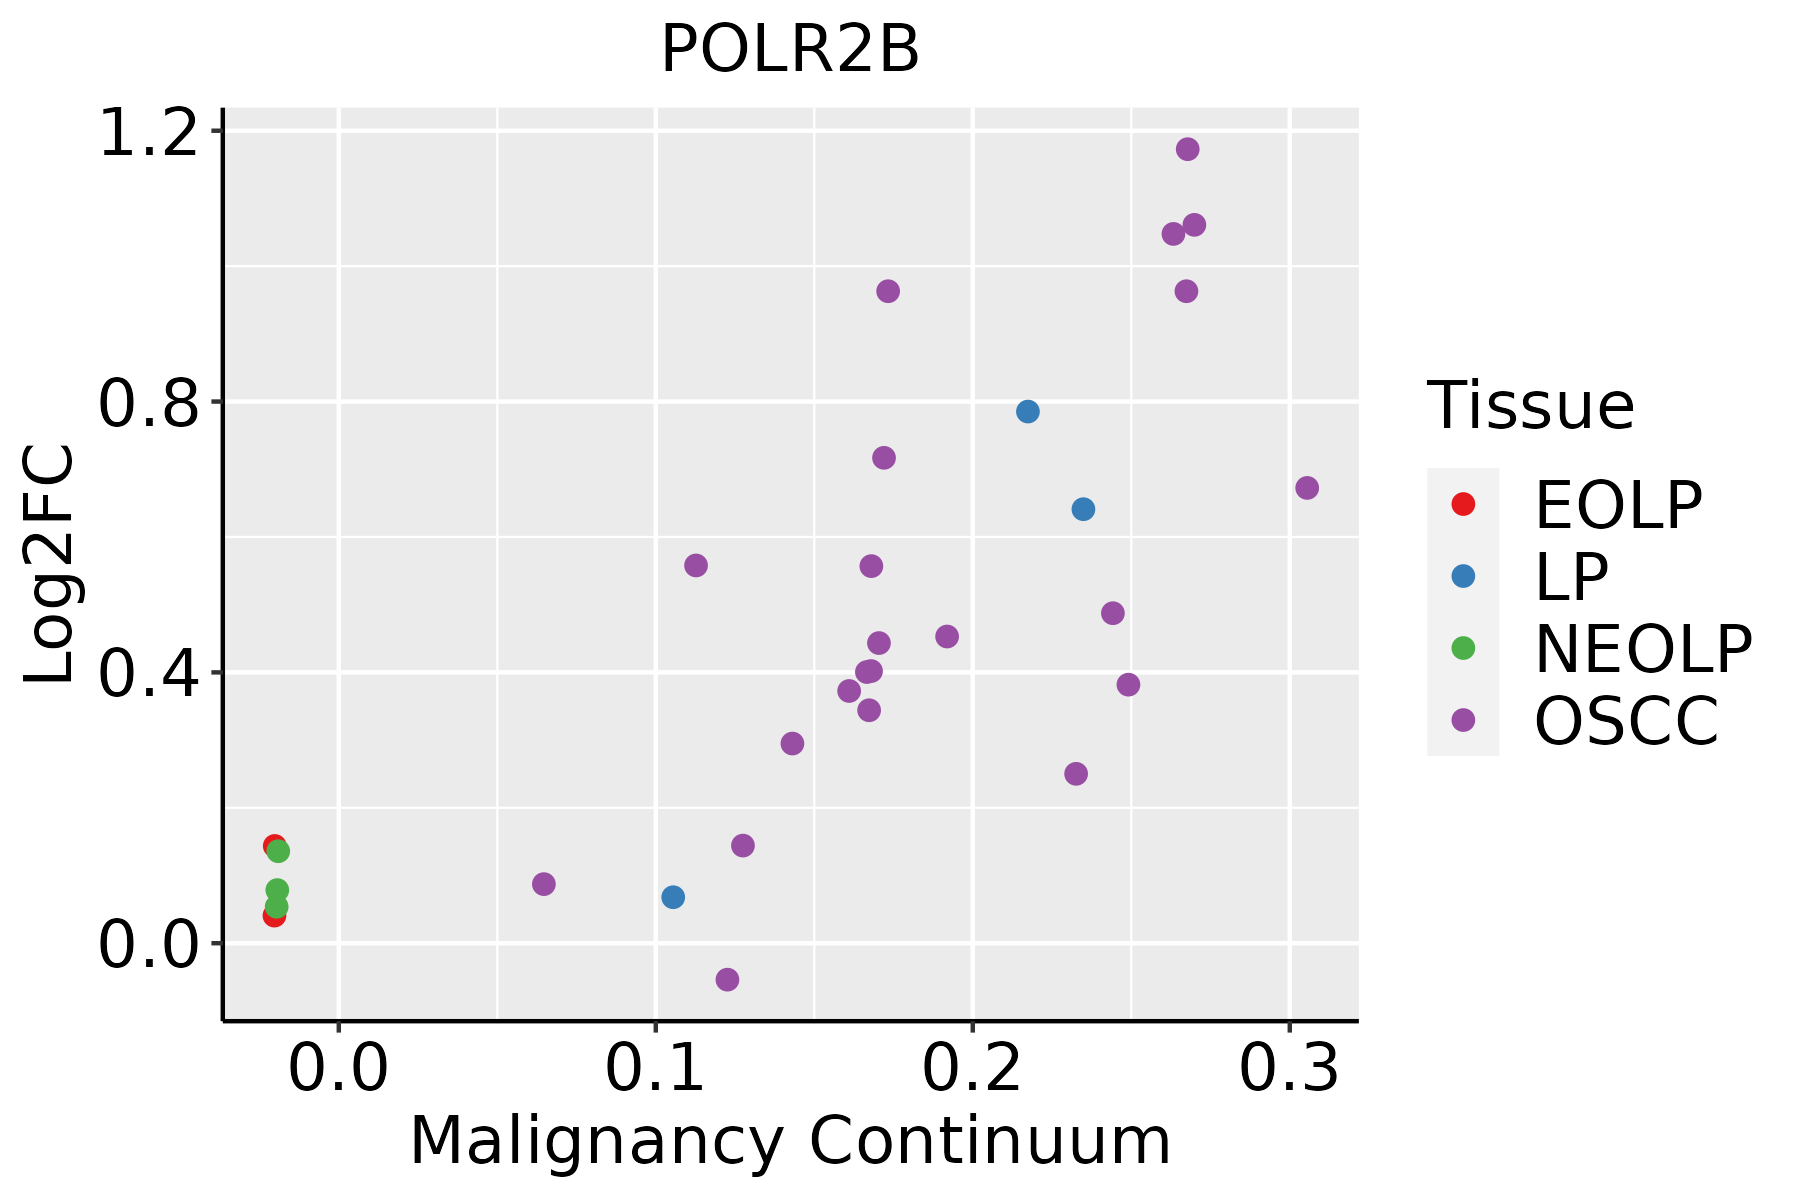 | EOLP: Erosive Oral lichen planus |
| LP: leukoplakia | ||
| NEOLP: Non-erosive oral lichen planus | ||
| OSCC: Oral squamous cell carcinoma | ||
| Skin |  | AK: Actinic keratosis |
| cSCC: Cutaneous squamous cell carcinoma | ||
| SCCIS:squamous cell carcinoma in situ | ||
| Thyroid | 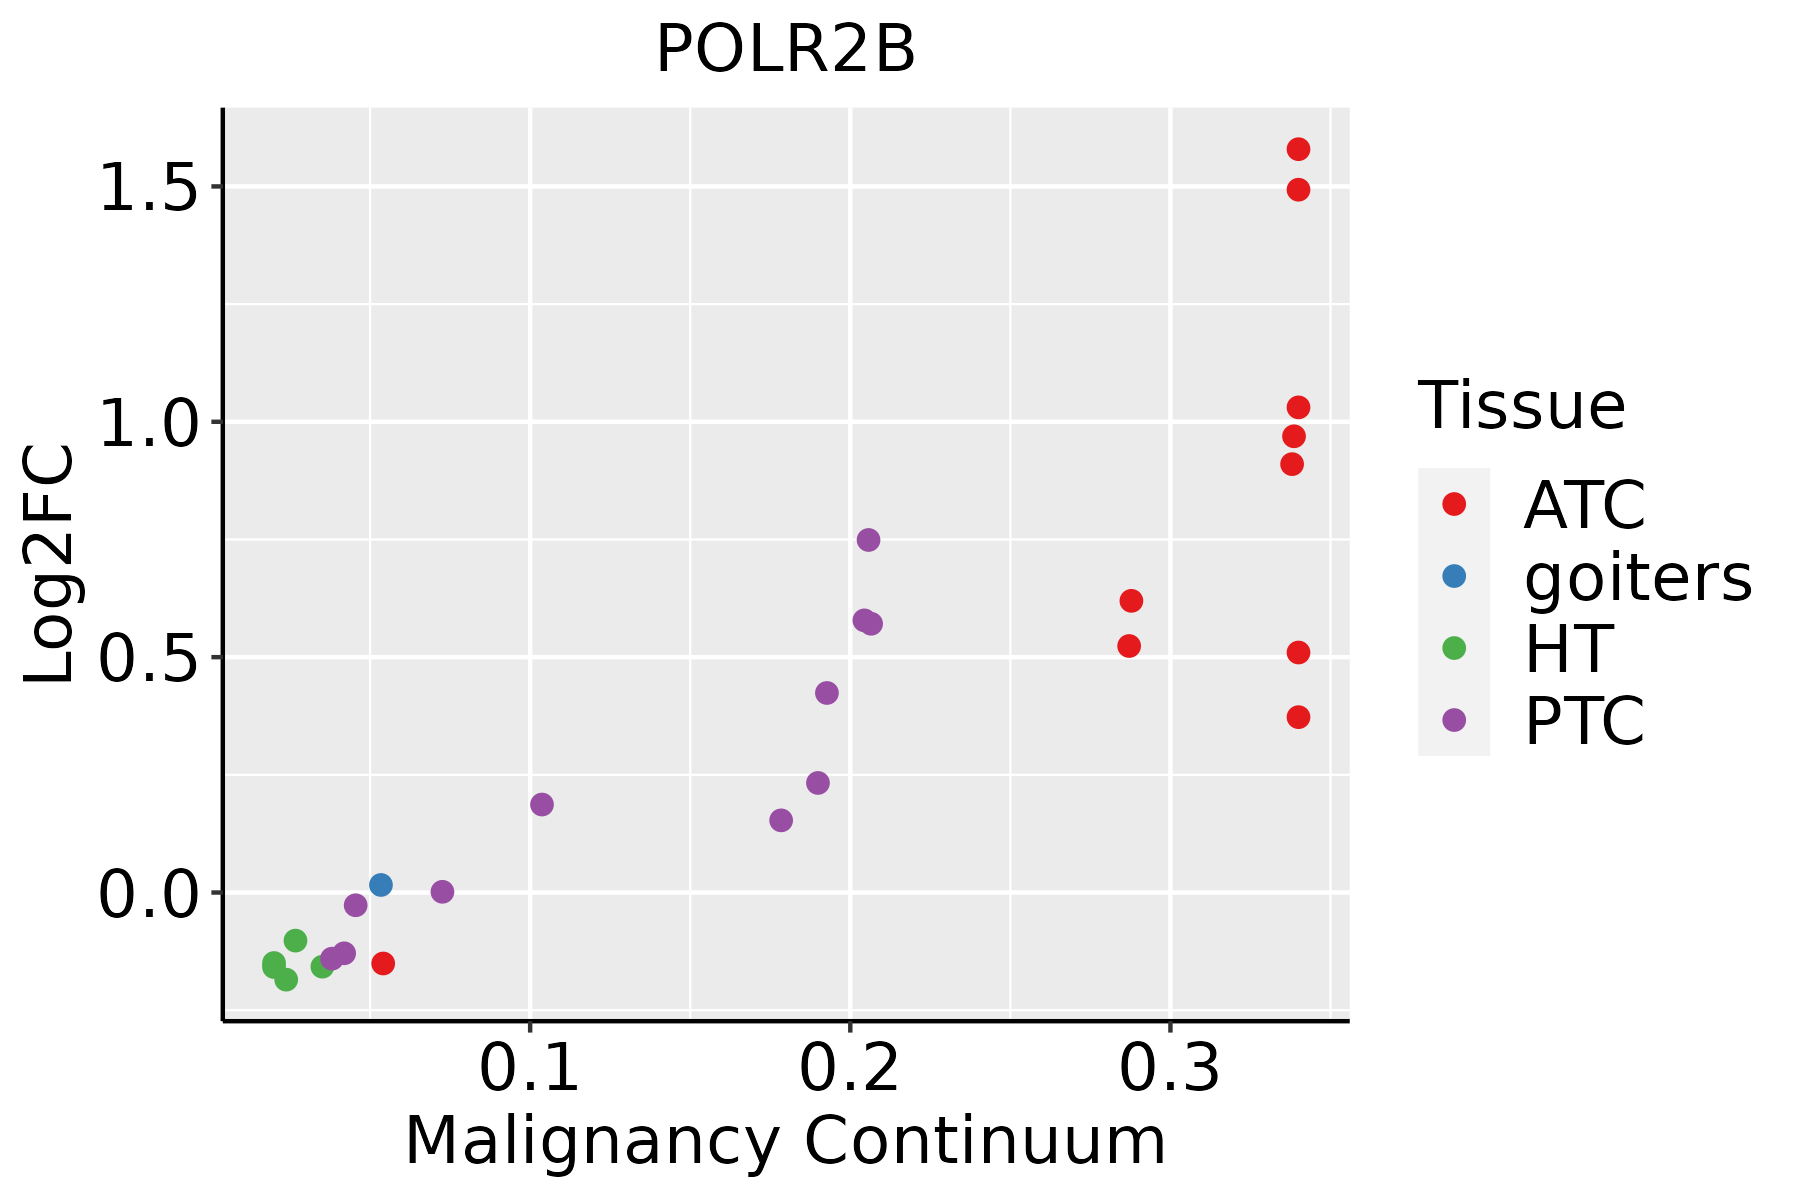 | ATC: Anaplastic thyroid cancer |
| HT: Hashimoto's thyroiditis | ||
| PTC: Papillary thyroid cancer |
| ∗log2FC in expression of this searched gene in stem-like cells from each diseased tissue sample relative to stem-like cells in normal samples in each tissue plotted against the malignancy continuum. Samples are colored based on if they are from different disease stage. |
Top |
Malignant transformation related pathway analysis |
| Find out the enriched GO biological processes and KEGG pathways involved in transition from healthy to precancer to cancer |
| Tissue | Disease Stage | Enriched GO biological Processes |
| Colorectum | AD |  |
| Colorectum | SER |  |
| Colorectum | MSS |  |
| Colorectum | MSI-H |  |
| Colorectum | FAP |  |
| ∗Top 15 enriched GO BP terms are showed in the bar plot of each disease state in each tissue. Each row represents a significant GO biological process which is colored according to the -log10(p.adjust). |
| Page: 1 2 3 4 5 6 7 8 9 |
| GO ID | Tissue | Disease Stage | Description | Gene Ratio | Bg Ratio | pvalue | p.adjust | Count |
| Page: 1 |
| Pathway ID | Tissue | Disease Stage | Description | Gene Ratio | Bg Ratio | pvalue | p.adjust | qvalue | Count |
| hsa05016210 | Esophagus | ESCC | Huntington disease | 226/4205 | 306/8465 | 1.38e-18 | 8.72e-17 | 4.46e-17 | 226 |
| hsa0342022 | Esophagus | ESCC | Nucleotide excision repair | 54/4205 | 63/8465 | 2.01e-09 | 2.17e-08 | 1.11e-08 | 54 |
| hsa0302021 | Esophagus | ESCC | RNA polymerase | 28/4205 | 34/8465 | 8.19e-05 | 3.35e-04 | 1.71e-04 | 28 |
| hsa0501638 | Esophagus | ESCC | Huntington disease | 226/4205 | 306/8465 | 1.38e-18 | 8.72e-17 | 4.46e-17 | 226 |
| hsa0342032 | Esophagus | ESCC | Nucleotide excision repair | 54/4205 | 63/8465 | 2.01e-09 | 2.17e-08 | 1.11e-08 | 54 |
| hsa0302031 | Esophagus | ESCC | RNA polymerase | 28/4205 | 34/8465 | 8.19e-05 | 3.35e-04 | 1.71e-04 | 28 |
| hsa0501614 | Liver | Cirrhotic | Huntington disease | 172/2530 | 306/8465 | 1.65e-22 | 1.10e-20 | 6.77e-21 | 172 |
| hsa03420 | Liver | Cirrhotic | Nucleotide excision repair | 29/2530 | 63/8465 | 4.81e-03 | 1.74e-02 | 1.07e-02 | 29 |
| hsa0501615 | Liver | Cirrhotic | Huntington disease | 172/2530 | 306/8465 | 1.65e-22 | 1.10e-20 | 6.77e-21 | 172 |
| hsa034201 | Liver | Cirrhotic | Nucleotide excision repair | 29/2530 | 63/8465 | 4.81e-03 | 1.74e-02 | 1.07e-02 | 29 |
| hsa0501622 | Liver | HCC | Huntington disease | 219/4020 | 306/8465 | 3.06e-18 | 3.42e-16 | 1.90e-16 | 219 |
| hsa034202 | Liver | HCC | Nucleotide excision repair | 41/4020 | 63/8465 | 3.59e-03 | 1.12e-02 | 6.22e-03 | 41 |
| hsa03020 | Liver | HCC | RNA polymerase | 24/4020 | 34/8465 | 5.40e-03 | 1.57e-02 | 8.75e-03 | 24 |
| hsa0501632 | Liver | HCC | Huntington disease | 219/4020 | 306/8465 | 3.06e-18 | 3.42e-16 | 1.90e-16 | 219 |
| hsa034203 | Liver | HCC | Nucleotide excision repair | 41/4020 | 63/8465 | 3.59e-03 | 1.12e-02 | 6.22e-03 | 41 |
| hsa030201 | Liver | HCC | RNA polymerase | 24/4020 | 34/8465 | 5.40e-03 | 1.57e-02 | 8.75e-03 | 24 |
| hsa0501628 | Oral cavity | OSCC | Huntington disease | 204/3704 | 306/8465 | 1.70e-16 | 7.13e-15 | 3.63e-15 | 204 |
| hsa034204 | Oral cavity | OSCC | Nucleotide excision repair | 49/3704 | 63/8465 | 3.48e-08 | 2.91e-07 | 1.48e-07 | 49 |
| hsa030204 | Oral cavity | OSCC | RNA polymerase | 25/3704 | 34/8465 | 4.12e-04 | 1.27e-03 | 6.45e-04 | 25 |
| hsa05016112 | Oral cavity | OSCC | Huntington disease | 204/3704 | 306/8465 | 1.70e-16 | 7.13e-15 | 3.63e-15 | 204 |
| Page: 1 2 |
Top |
Cell-cell communication analysis |
| Identification of potential cell-cell interactions between two cell types and their ligand-receptor pairs for different disease states |
| Ligand | Receptor | LRpair | Pathway | Tissue | Disease Stage |
| Page: 1 |
Top |
Single-cell gene regulatory network inference analysis |
| Find out the significant the regulons (TFs) and the target genes of each regulon across cell types for different disease states |
| TF | Cell Type | Tissue | Disease Stage | Target Gene | RSS | Regulon Activity |
| ∗The dot plots of a searched regulon are shown for all cell subpopulations in each disease state of each tissue based on the regulon specific score inferred using pySCENIC and by calculating the average expression. |
| Page: 1 |
Top |
Somatic mutation of malignant transformation related genes |
| Annotation of somatic variants for genes involved in malignant transformation |
| Hugo Symbol | Variant Class | Variant Classification | dbSNP RS | HGVSc | HGVSp | HGVSp Short | SWISSPROT | BIOTYPE | SIFT | PolyPhen | Tumor Sample Barcode | Tissue | Histology | Sex | Age | Stage | Therapy Types | Drugs | Outcome |
| POLR2B | SNV | Missense_Mutation | c.2545N>A | p.Asp849Asn | p.D849N | P30876 | protein_coding | deleterious(0) | probably_damaging(0.967) | TCGA-AC-A23H-01 | Breast | breast invasive carcinoma | Female | >=65 | I/II | Unknown | Unknown | PD | |
| POLR2B | SNV | Missense_Mutation | c.32N>T | p.Asp11Val | p.D11V | P30876 | protein_coding | tolerated(0.05) | probably_damaging(0.954) | TCGA-AN-A04C-01 | Breast | breast invasive carcinoma | Female | <65 | I/II | Unknown | Unknown | SD | |
| POLR2B | deletion | Frame_Shift_Del | rs759837397 | c.3319_3322delNNNN | p.Phe1108ArgfsTer16 | p.F1108Rfs*16 | P30876 | protein_coding | TCGA-BH-A0HA-01 | Breast | breast invasive carcinoma | Female | <65 | I/II | Unknown | Unknown | SD | ||
| POLR2B | deletion | Frame_Shift_Del | novel | c.3138delN | p.Tyr1047IlefsTer5 | p.Y1047Ifs*5 | P30876 | protein_coding | TCGA-D8-A27V-01 | Breast | breast invasive carcinoma | Female | <65 | I/II | Hormone Therapy | tamoxiphen | SD | ||
| POLR2B | SNV | Missense_Mutation | novel | c.2015C>T | p.Thr672Ile | p.T672I | P30876 | protein_coding | tolerated(0.05) | probably_damaging(0.993) | TCGA-2W-A8YY-01 | Cervix | cervical & endocervical cancer | Female | <65 | I/II | Chemotherapy | cisplatin | CR |
| POLR2B | SNV | Missense_Mutation | novel | c.2407C>T | p.Arg803Cys | p.R803C | P30876 | protein_coding | deleterious(0) | probably_damaging(1) | TCGA-2W-A8YY-01 | Cervix | cervical & endocervical cancer | Female | <65 | I/II | Chemotherapy | cisplatin | CR |
| POLR2B | SNV | Missense_Mutation | novel | c.3361N>G | p.Leu1121Val | p.L1121V | P30876 | protein_coding | tolerated(0.34) | benign(0.021) | TCGA-C5-A8XH-01 | Cervix | cervical & endocervical cancer | Female | <65 | I/II | Unknown | Unknown | SD |
| POLR2B | SNV | Missense_Mutation | novel | c.3386A>T | p.Asn1129Ile | p.N1129I | P30876 | protein_coding | deleterious(0) | probably_damaging(0.945) | TCGA-EA-A4BA-01 | Cervix | cervical & endocervical cancer | Female | <65 | I/II | Chemotherapy | carboplatin | CR |
| POLR2B | SNV | Missense_Mutation | c.2095N>T | p.His699Tyr | p.H699Y | P30876 | protein_coding | deleterious(0) | probably_damaging(0.963) | TCGA-EA-A50E-01 | Cervix | cervical & endocervical cancer | Female | <65 | I/II | Unknown | Unknown | PD | |
| POLR2B | SNV | Missense_Mutation | c.1235T>G | p.Leu412Arg | p.L412R | P30876 | protein_coding | tolerated(0.13) | benign(0.431) | TCGA-JW-A5VG-01 | Cervix | cervical & endocervical cancer | Female | <65 | I/II | Chemotherapy | cisplatin | SD |
| Page: 1 2 3 4 5 6 7 8 9 10 11 12 13 14 |
Top |
Related drugs of malignant transformation related genes |
| Identification of chemicals and drugs interact with genes involved in malignant transfromation |
| (DGIdb 4.0) |
| Entrez ID | Symbol | Category | Interaction Types | Drug Claim Name | Drug Name | PMIDs |
| Page: 1 |

Copyright 2023-Present -The University of Texas Health Science Center at Houston |