
|
|||||
|
 | |
| |
| |
| |
| |
| |
|
Gene: POLR2A |
Gene summary for POLR2A |
| Gene information | Species | Human | Gene symbol | POLR2A | Gene ID | 5430 |
| Gene name | RNA polymerase II subunit A | |
| Gene Alias | NEDHIB | |
| Cytomap | 17p13.1 | |
| Gene Type | protein-coding | GO ID | GO:0001172 | UniProtAcc | P24928 |
Top |
Malignant transformation analysis |
| Identification of the aberrant gene expression in precancerous and cancerous lesions by comparing the gene expression of stem-like cells in diseased tissues with normal stem cells |
| Entrez ID | Symbol | Replicates | Species | Organ | Tissue | Adj P-value | Log2FC | Malignancy |
| 5430 | POLR2A | HTA11_347_2000001011 | Human | Colorectum | AD | 6.93e-12 | 4.13e-01 | -0.1954 |
| 5430 | POLR2A | HTA11_696_2000001011 | Human | Colorectum | AD | 9.41e-12 | 4.37e-01 | -0.1464 |
| 5430 | POLR2A | HTA11_866_2000001011 | Human | Colorectum | AD | 9.38e-04 | 2.77e-01 | -0.1001 |
| 5430 | POLR2A | HTA11_1391_2000001011 | Human | Colorectum | AD | 4.95e-10 | 5.47e-01 | -0.059 |
| 5430 | POLR2A | HTA11_546_2000001011 | Human | Colorectum | AD | 2.87e-05 | 4.50e-01 | -0.0842 |
| 5430 | POLR2A | HTA11_866_3004761011 | Human | Colorectum | AD | 4.05e-07 | 3.60e-01 | 0.096 |
| 5430 | POLR2A | HTA11_10711_2000001011 | Human | Colorectum | AD | 7.36e-04 | 3.76e-01 | 0.0338 |
| 5430 | POLR2A | HTA11_7696_3000711011 | Human | Colorectum | AD | 4.24e-20 | 6.13e-01 | 0.0674 |
| 5430 | POLR2A | HTA11_6818_2000001021 | Human | Colorectum | AD | 5.04e-05 | 3.96e-01 | 0.0588 |
| 5430 | POLR2A | HTA11_99999970781_79442 | Human | Colorectum | MSS | 5.60e-04 | 2.93e-01 | 0.294 |
| 5430 | POLR2A | HTA11_99999965062_69753 | Human | Colorectum | MSI-H | 7.14e-09 | 1.41e+00 | 0.3487 |
| 5430 | POLR2A | LZE2D | Human | Esophagus | HGIN | 3.29e-05 | 2.62e-01 | 0.0642 |
| 5430 | POLR2A | LZE2T | Human | Esophagus | ESCC | 4.21e-04 | 5.93e-01 | 0.082 |
| 5430 | POLR2A | LZE3D | Human | Esophagus | HGIN | 8.08e-04 | 4.54e-01 | 0.0668 |
| 5430 | POLR2A | LZE4T | Human | Esophagus | ESCC | 7.77e-24 | 7.65e-01 | 0.0811 |
| 5430 | POLR2A | LZE5T | Human | Esophagus | ESCC | 2.53e-06 | 4.71e-01 | 0.0514 |
| 5430 | POLR2A | LZE7T | Human | Esophagus | ESCC | 2.38e-18 | 1.25e+00 | 0.0667 |
| 5430 | POLR2A | LZE8T | Human | Esophagus | ESCC | 6.51e-18 | 7.38e-01 | 0.067 |
| 5430 | POLR2A | LZE20T | Human | Esophagus | ESCC | 2.27e-10 | 4.34e-01 | 0.0662 |
| 5430 | POLR2A | LZE21D1 | Human | Esophagus | HGIN | 9.94e-03 | 1.02e+00 | 0.0632 |
| Page: 1 2 3 4 5 6 7 8 |
| Tissue | Expression Dynamics | Abbreviation |
| Colorectum (GSE201348) |  | FAP: Familial adenomatous polyposis |
| CRC: Colorectal cancer | ||
| Colorectum (HTA11) |  | AD: Adenomas |
| SER: Sessile serrated lesions | ||
| MSI-H: Microsatellite-high colorectal cancer | ||
| MSS: Microsatellite stable colorectal cancer | ||
| Esophagus | 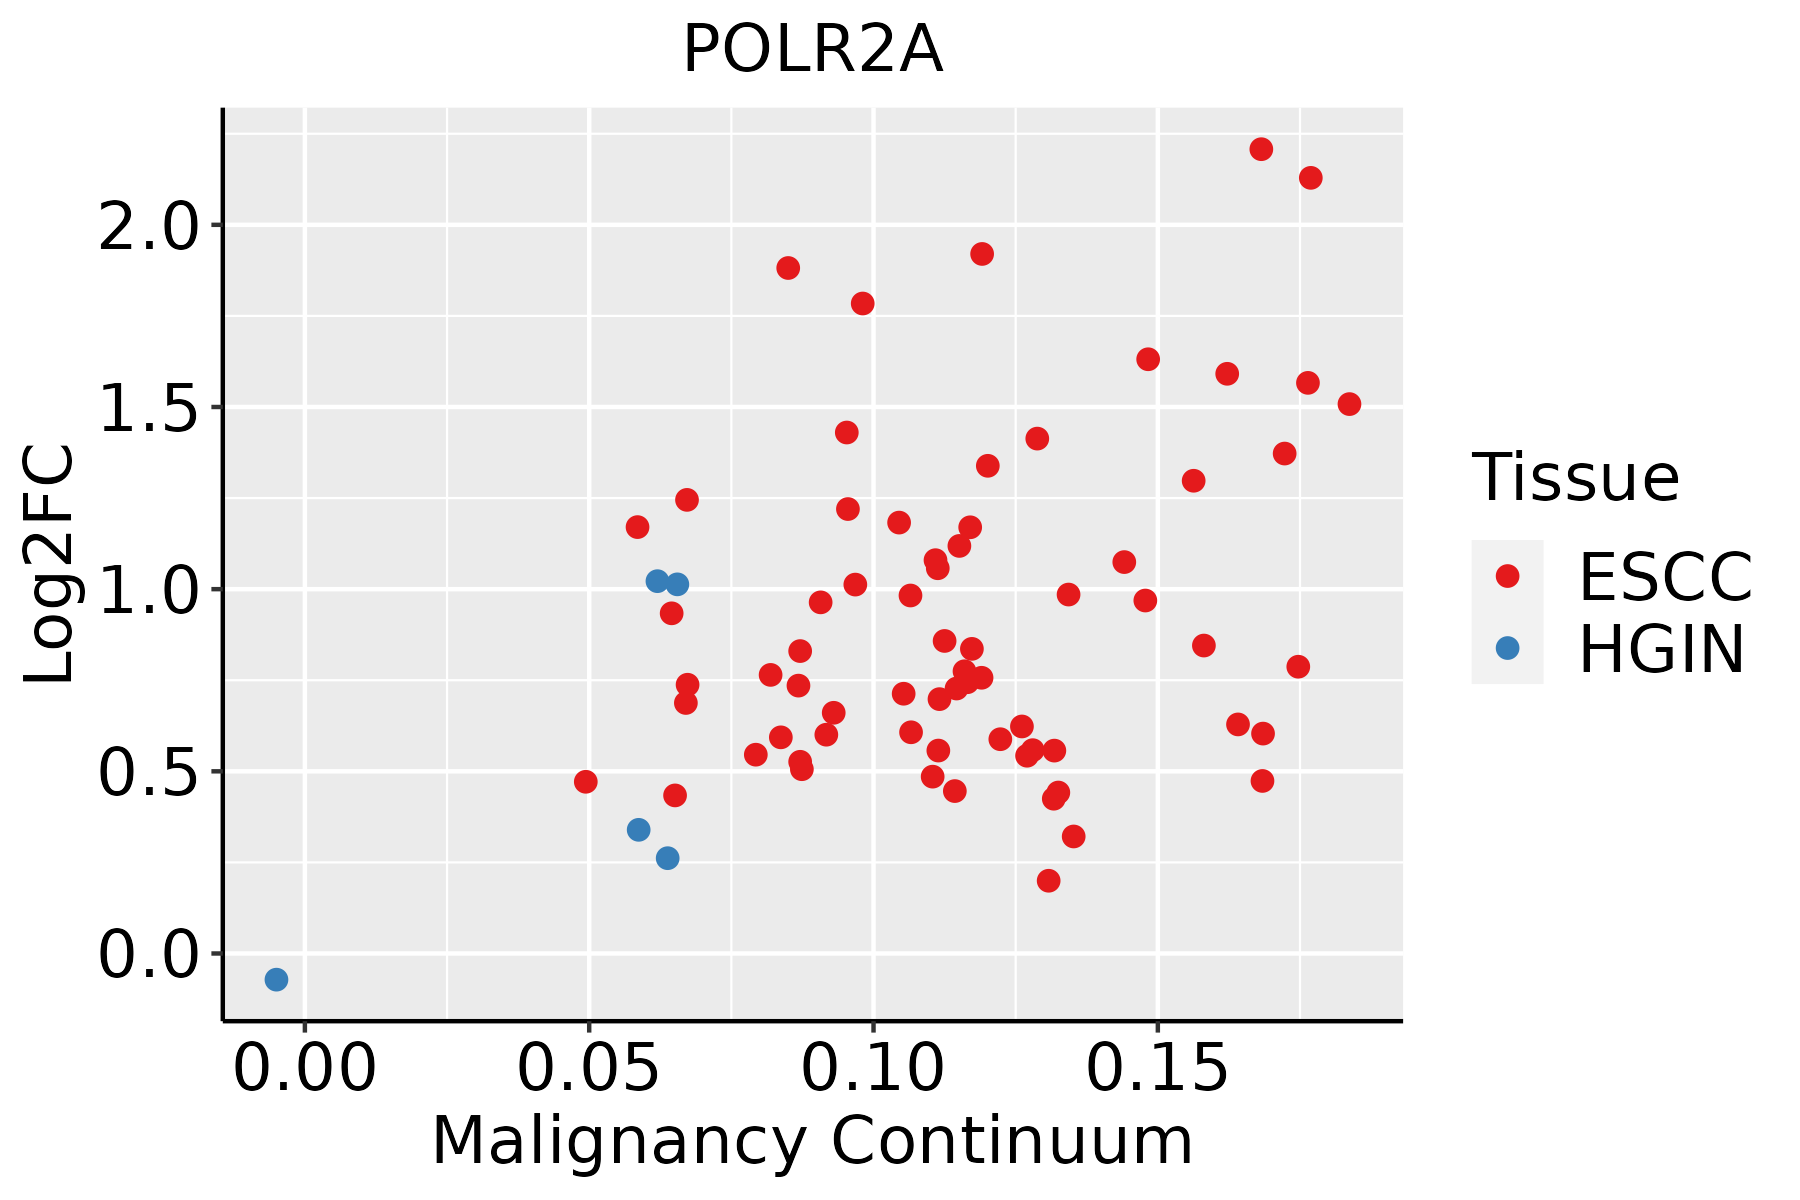 | ESCC: Esophageal squamous cell carcinoma |
| HGIN: High-grade intraepithelial neoplasias | ||
| LGIN: Low-grade intraepithelial neoplasias | ||
| Liver | 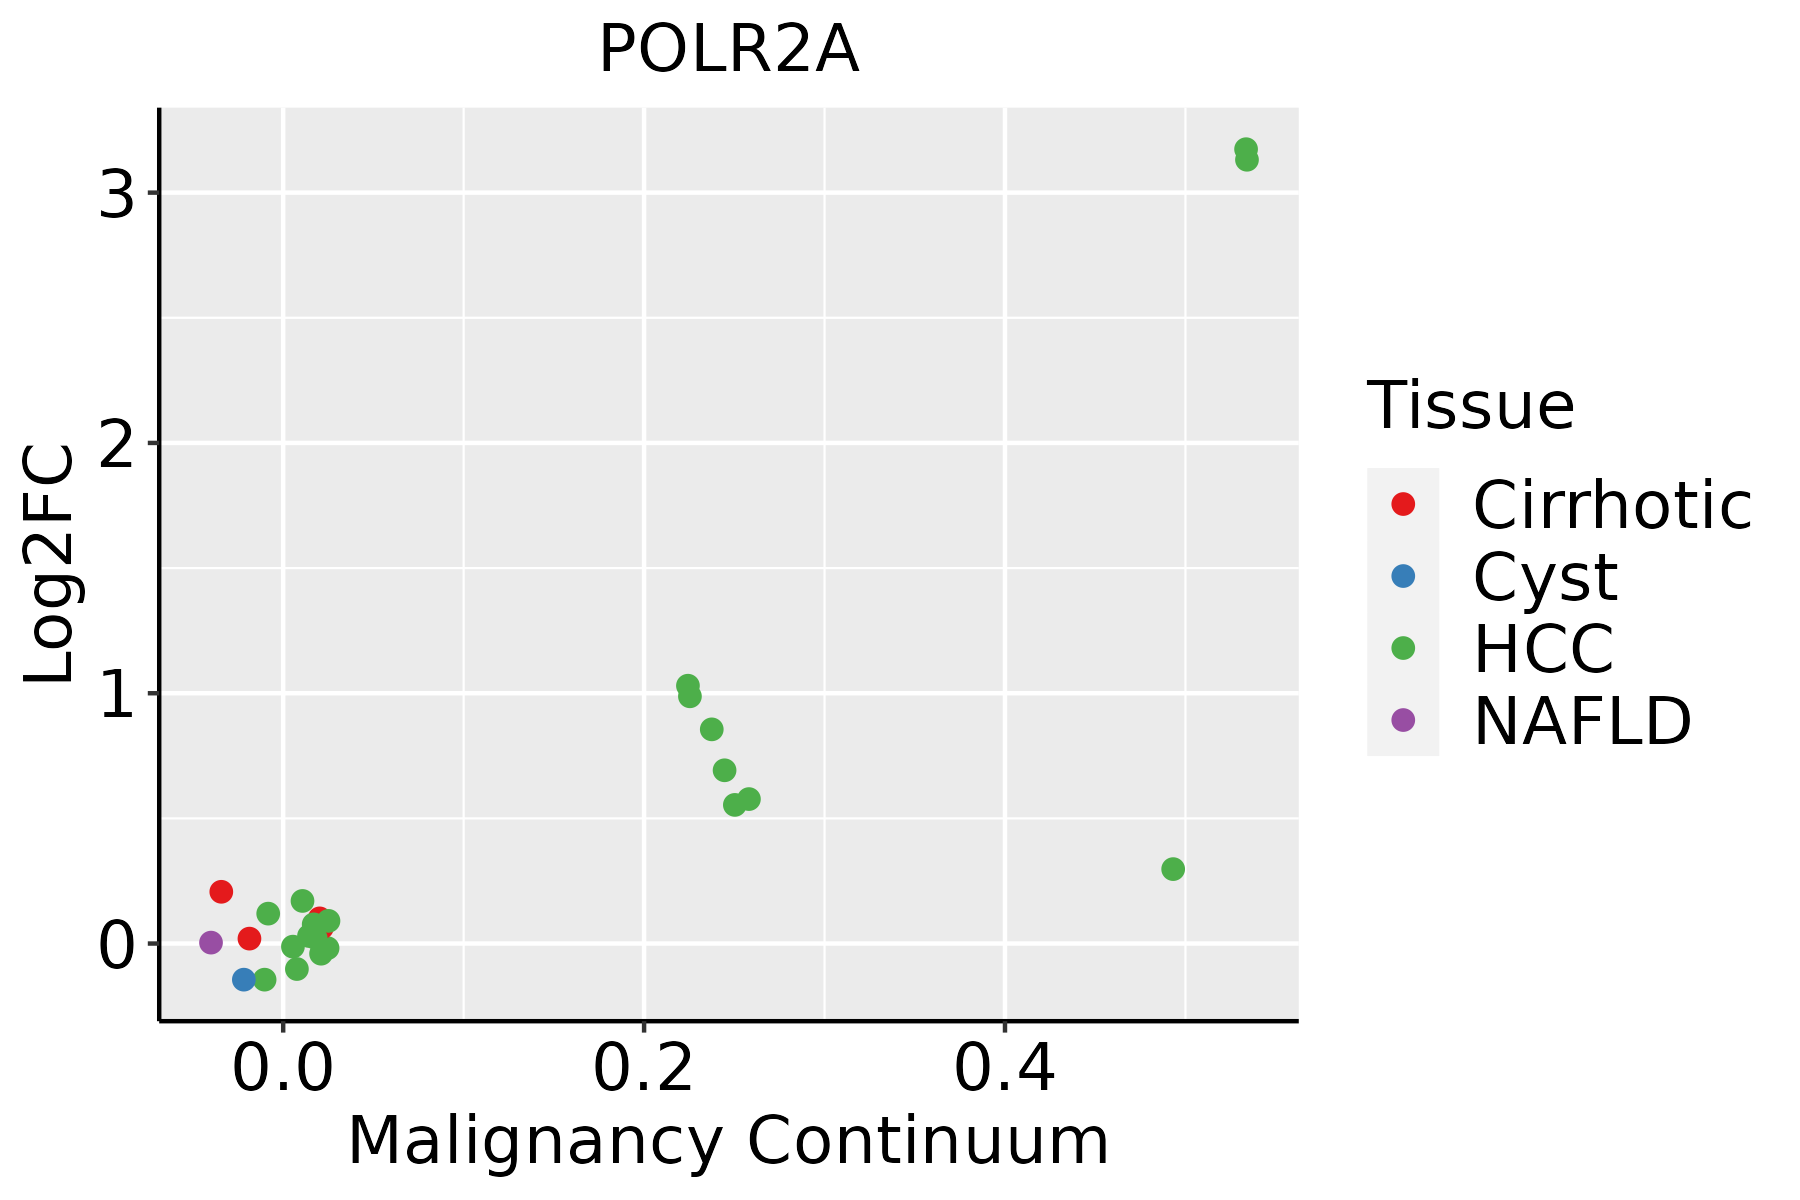 | HCC: Hepatocellular carcinoma |
| NAFLD: Non-alcoholic fatty liver disease | ||
| Lung |  | AAH: Atypical adenomatous hyperplasia |
| AIS: Adenocarcinoma in situ | ||
| IAC: Invasive lung adenocarcinoma | ||
| MIA: Minimally invasive adenocarcinoma | ||
| Oral Cavity | 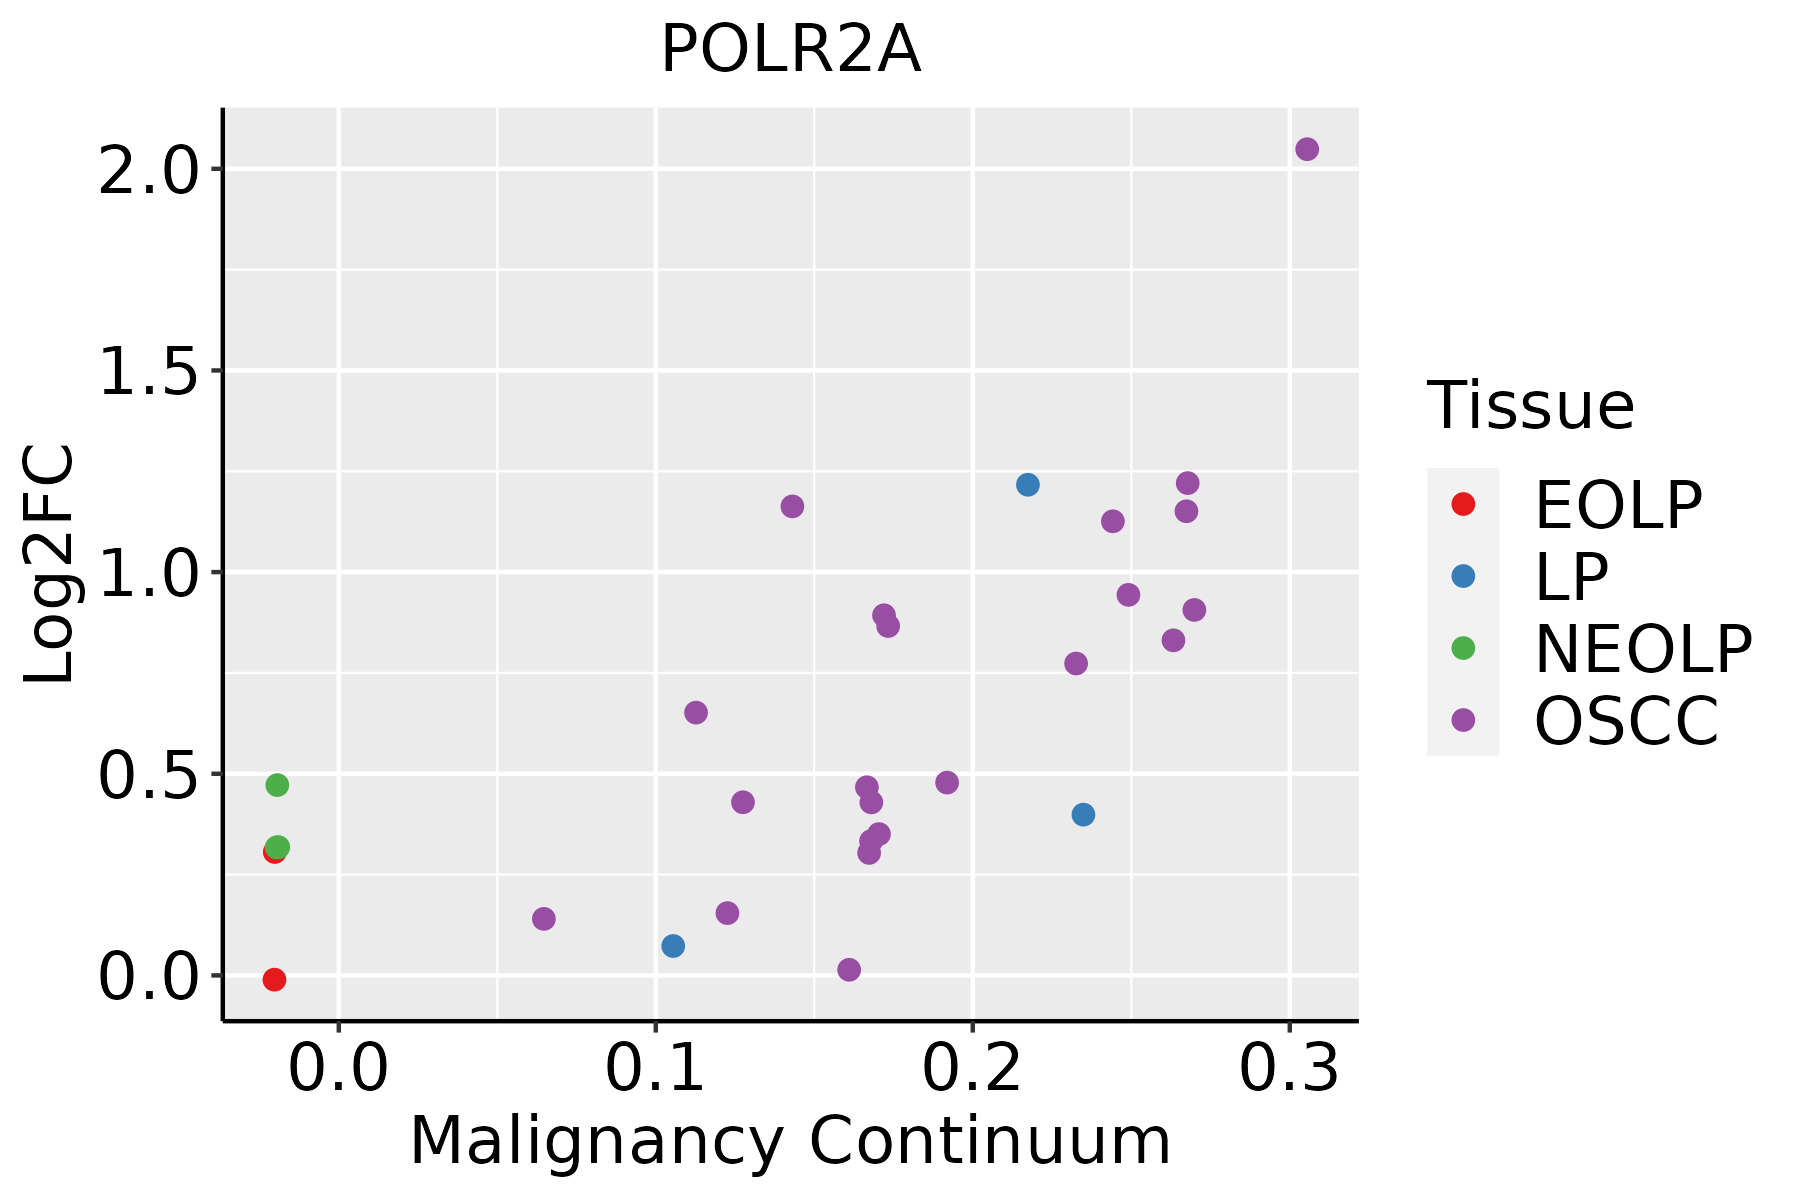 | EOLP: Erosive Oral lichen planus |
| LP: leukoplakia | ||
| NEOLP: Non-erosive oral lichen planus | ||
| OSCC: Oral squamous cell carcinoma | ||
| Prostate |  | BPH: Benign Prostatic Hyperplasia |
| Skin | 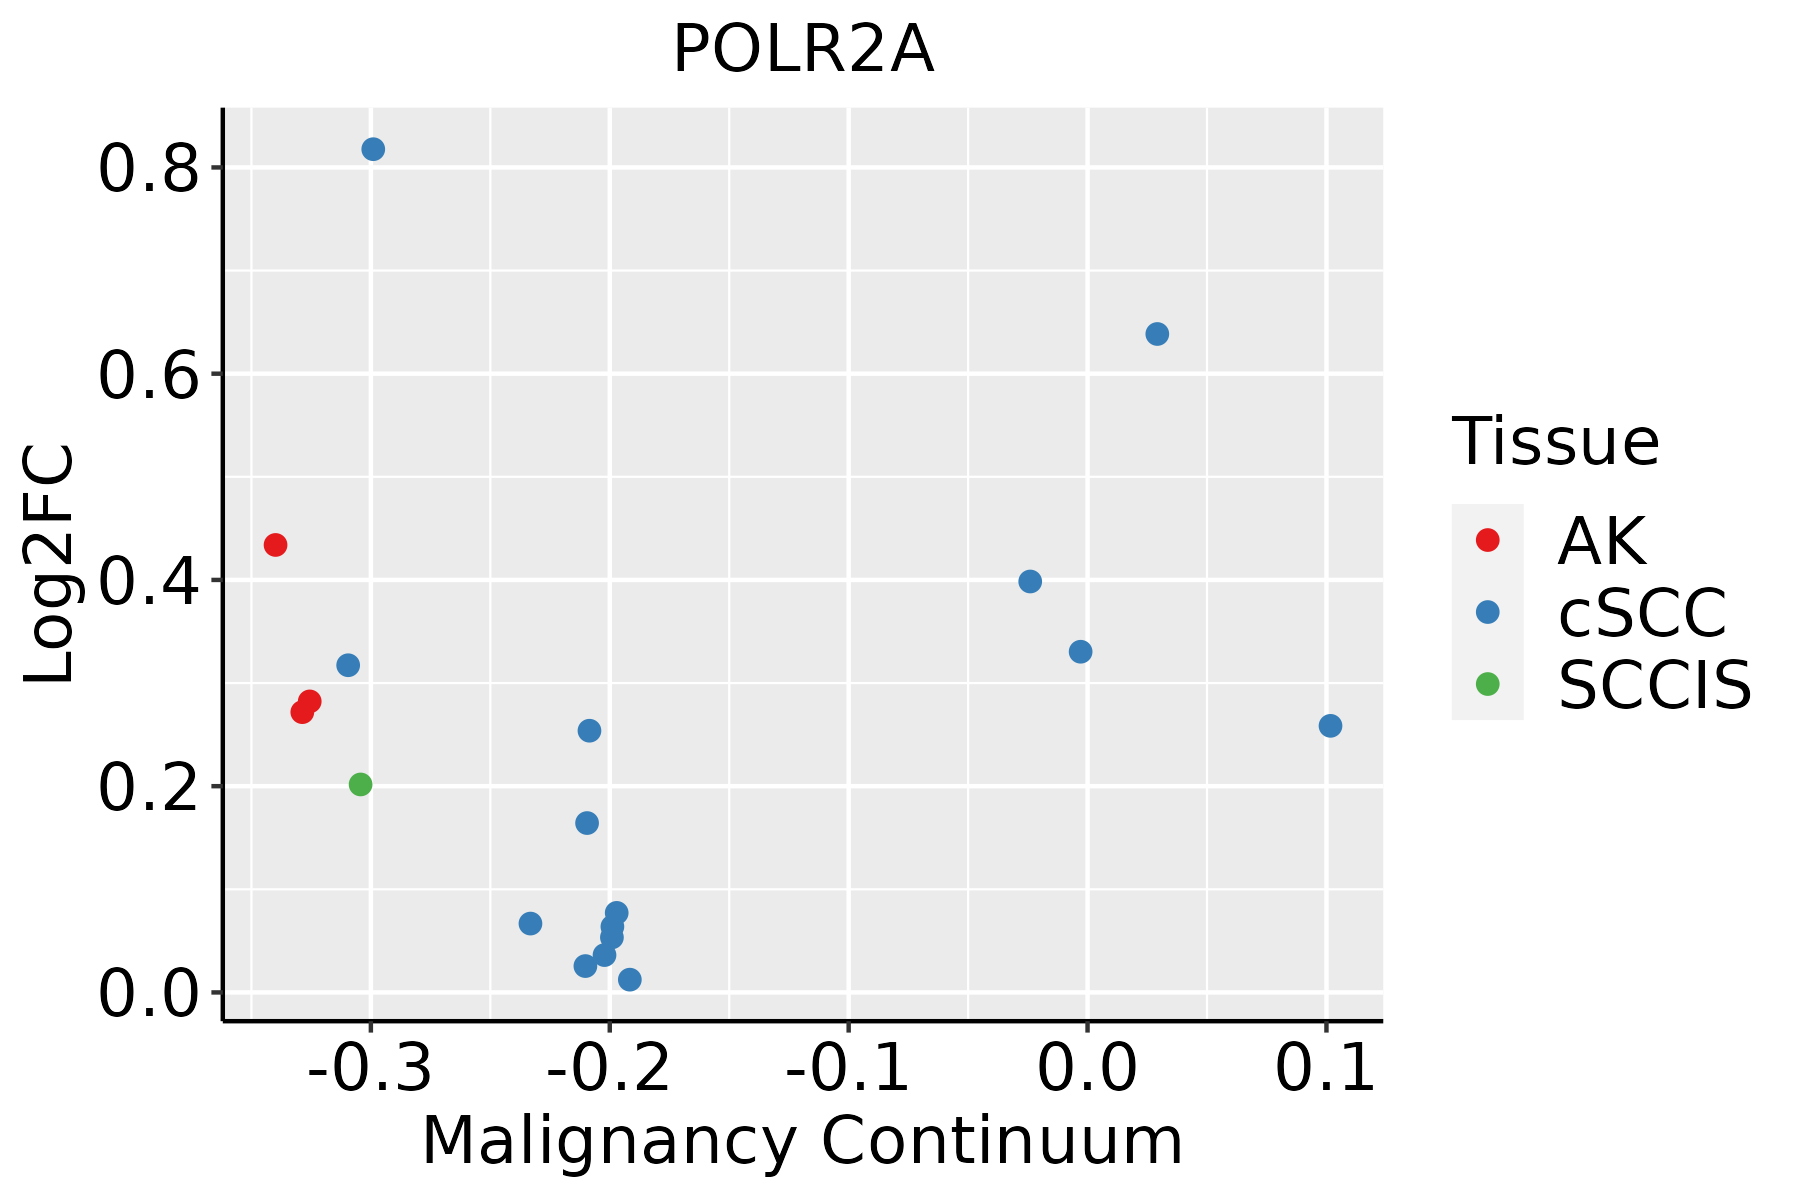 | AK: Actinic keratosis |
| cSCC: Cutaneous squamous cell carcinoma | ||
| SCCIS:squamous cell carcinoma in situ | ||
| Thyroid |  | ATC: Anaplastic thyroid cancer |
| HT: Hashimoto's thyroiditis | ||
| PTC: Papillary thyroid cancer |
| ∗log2FC in expression of this searched gene in stem-like cells from each diseased tissue sample relative to stem-like cells in normal samples in each tissue plotted against the malignancy continuum. Samples are colored based on if they are from different disease stage. |
Top |
Malignant transformation related pathway analysis |
| Find out the enriched GO biological processes and KEGG pathways involved in transition from healthy to precancer to cancer |
| Tissue | Disease Stage | Enriched GO biological Processes |
| Colorectum | AD |  |
| Colorectum | SER |  |
| Colorectum | MSS |  |
| Colorectum | MSI-H |  |
| Colorectum | FAP |  |
| ∗Top 15 enriched GO BP terms are showed in the bar plot of each disease state in each tissue. Each row represents a significant GO biological process which is colored according to the -log10(p.adjust). |
| Page: 1 2 3 4 5 6 7 8 9 |
| GO ID | Tissue | Disease Stage | Description | Gene Ratio | Bg Ratio | pvalue | p.adjust | Count |
| GO:0008380 | Colorectum | AD | RNA splicing | 169/3918 | 434/18723 | 3.59e-18 | 2.04e-15 | 169 |
| GO:0043484 | Colorectum | AD | regulation of RNA splicing | 70/3918 | 148/18723 | 6.47e-13 | 1.16e-10 | 70 |
| GO:0033120 | Colorectum | AD | positive regulation of RNA splicing | 19/3918 | 37/18723 | 4.08e-05 | 7.26e-04 | 19 |
| GO:00083802 | Colorectum | MSS | RNA splicing | 159/3467 | 434/18723 | 1.75e-19 | 1.22e-16 | 159 |
| GO:00434842 | Colorectum | MSS | regulation of RNA splicing | 66/3467 | 148/18723 | 2.44e-13 | 5.25e-11 | 66 |
| GO:00331201 | Colorectum | MSS | positive regulation of RNA splicing | 17/3467 | 37/18723 | 1.22e-04 | 1.89e-03 | 17 |
| GO:00083803 | Colorectum | MSI-H | RNA splicing | 82/1319 | 434/18723 | 1.22e-16 | 4.53e-14 | 82 |
| GO:00434843 | Colorectum | MSI-H | regulation of RNA splicing | 34/1319 | 148/18723 | 5.85e-10 | 8.33e-08 | 34 |
| GO:00331202 | Colorectum | MSI-H | positive regulation of RNA splicing | 8/1319 | 37/18723 | 3.64e-03 | 4.28e-02 | 8 |
| GO:000838026 | Esophagus | HGIN | RNA splicing | 160/2587 | 434/18723 | 3.74e-34 | 1.12e-30 | 160 |
| GO:004348427 | Esophagus | HGIN | regulation of RNA splicing | 59/2587 | 148/18723 | 3.61e-15 | 7.22e-13 | 59 |
| GO:003312020 | Esophagus | HGIN | positive regulation of RNA splicing | 17/2587 | 37/18723 | 2.33e-06 | 8.37e-05 | 17 |
| GO:0008380111 | Esophagus | ESCC | RNA splicing | 336/8552 | 434/18723 | 1.74e-42 | 3.67e-39 | 336 |
| GO:0043484111 | Esophagus | ESCC | regulation of RNA splicing | 116/8552 | 148/18723 | 3.18e-16 | 2.38e-14 | 116 |
| GO:0033120110 | Esophagus | ESCC | positive regulation of RNA splicing | 29/8552 | 37/18723 | 4.97e-05 | 3.86e-04 | 29 |
| GO:00063532 | Esophagus | ESCC | DNA-templated transcription, termination | 15/8552 | 21/18723 | 1.54e-02 | 4.96e-02 | 15 |
| GO:000838012 | Liver | Cirrhotic | RNA splicing | 229/4634 | 434/18723 | 9.13e-37 | 2.86e-33 | 229 |
| GO:004348412 | Liver | Cirrhotic | regulation of RNA splicing | 85/4634 | 148/18723 | 2.03e-17 | 2.83e-15 | 85 |
| GO:00331205 | Liver | Cirrhotic | positive regulation of RNA splicing | 24/4634 | 37/18723 | 2.87e-07 | 7.01e-06 | 24 |
| GO:000838022 | Liver | HCC | RNA splicing | 313/7958 | 434/18723 | 1.36e-36 | 1.73e-33 | 313 |
| Page: 1 2 3 |
| Pathway ID | Tissue | Disease Stage | Description | Gene Ratio | Bg Ratio | pvalue | p.adjust | qvalue | Count |
| hsa05016 | Colorectum | AD | Huntington disease | 147/2092 | 306/8465 | 1.93e-19 | 9.26e-18 | 5.91e-18 | 147 |
| hsa050161 | Colorectum | AD | Huntington disease | 147/2092 | 306/8465 | 1.93e-19 | 9.26e-18 | 5.91e-18 | 147 |
| hsa050164 | Colorectum | MSS | Huntington disease | 141/1875 | 306/8465 | 2.90e-21 | 1.62e-19 | 9.92e-20 | 141 |
| hsa050165 | Colorectum | MSS | Huntington disease | 141/1875 | 306/8465 | 2.90e-21 | 1.62e-19 | 9.92e-20 | 141 |
| hsa050166 | Colorectum | MSI-H | Huntington disease | 83/797 | 306/8465 | 7.06e-20 | 3.81e-18 | 3.20e-18 | 83 |
| hsa050167 | Colorectum | MSI-H | Huntington disease | 83/797 | 306/8465 | 7.06e-20 | 3.81e-18 | 3.20e-18 | 83 |
| hsa0501630 | Esophagus | HGIN | Huntington disease | 129/1383 | 306/8465 | 6.81e-28 | 7.41e-26 | 5.88e-26 | 129 |
| hsa034205 | Esophagus | HGIN | Nucleotide excision repair | 29/1383 | 63/8465 | 2.96e-08 | 5.36e-07 | 4.26e-07 | 29 |
| hsa05016113 | Esophagus | HGIN | Huntington disease | 129/1383 | 306/8465 | 6.81e-28 | 7.41e-26 | 5.88e-26 | 129 |
| hsa0342012 | Esophagus | HGIN | Nucleotide excision repair | 29/1383 | 63/8465 | 2.96e-08 | 5.36e-07 | 4.26e-07 | 29 |
| hsa05016210 | Esophagus | ESCC | Huntington disease | 226/4205 | 306/8465 | 1.38e-18 | 8.72e-17 | 4.46e-17 | 226 |
| hsa0342022 | Esophagus | ESCC | Nucleotide excision repair | 54/4205 | 63/8465 | 2.01e-09 | 2.17e-08 | 1.11e-08 | 54 |
| hsa0302021 | Esophagus | ESCC | RNA polymerase | 28/4205 | 34/8465 | 8.19e-05 | 3.35e-04 | 1.71e-04 | 28 |
| hsa0501638 | Esophagus | ESCC | Huntington disease | 226/4205 | 306/8465 | 1.38e-18 | 8.72e-17 | 4.46e-17 | 226 |
| hsa0342032 | Esophagus | ESCC | Nucleotide excision repair | 54/4205 | 63/8465 | 2.01e-09 | 2.17e-08 | 1.11e-08 | 54 |
| hsa0302031 | Esophagus | ESCC | RNA polymerase | 28/4205 | 34/8465 | 8.19e-05 | 3.35e-04 | 1.71e-04 | 28 |
| hsa0501614 | Liver | Cirrhotic | Huntington disease | 172/2530 | 306/8465 | 1.65e-22 | 1.10e-20 | 6.77e-21 | 172 |
| hsa0501615 | Liver | Cirrhotic | Huntington disease | 172/2530 | 306/8465 | 1.65e-22 | 1.10e-20 | 6.77e-21 | 172 |
| hsa0501622 | Liver | HCC | Huntington disease | 219/4020 | 306/8465 | 3.06e-18 | 3.42e-16 | 1.90e-16 | 219 |
| hsa034202 | Liver | HCC | Nucleotide excision repair | 41/4020 | 63/8465 | 3.59e-03 | 1.12e-02 | 6.22e-03 | 41 |
| Page: 1 2 3 |
Top |
Cell-cell communication analysis |
| Identification of potential cell-cell interactions between two cell types and their ligand-receptor pairs for different disease states |
| Ligand | Receptor | LRpair | Pathway | Tissue | Disease Stage |
| Page: 1 |
Top |
Single-cell gene regulatory network inference analysis |
| Find out the significant the regulons (TFs) and the target genes of each regulon across cell types for different disease states |
| TF | Cell Type | Tissue | Disease Stage | Target Gene | RSS | Regulon Activity |
| POLR2A | MLUM | Breast | IDC | PHLDB2,TLE4,SLC27A2, etc. | 5.52e-01 |  |
| POLR2A | CHIEF | Stomach | CAG with IM | PLCG2,AL021155.5,HEXIM1, etc. | 5.16e-01 |  |
| ∗The dot plots of a searched regulon are shown for all cell subpopulations in each disease state of each tissue based on the regulon specific score inferred using pySCENIC and by calculating the average expression. |
| Page: 1 |
Top |
Somatic mutation of malignant transformation related genes |
| Annotation of somatic variants for genes involved in malignant transformation |
| Hugo Symbol | Variant Class | Variant Classification | dbSNP RS | HGVSc | HGVSp | HGVSp Short | SWISSPROT | BIOTYPE | SIFT | PolyPhen | Tumor Sample Barcode | Tissue | Histology | Sex | Age | Stage | Therapy Types | Drugs | Outcome |
| POLR2A | SNV | Missense_Mutation | rs201063777 | c.2595N>G | p.Ile865Met | p.I865M | protein_coding | tolerated(0.08) | possibly_damaging(0.615) | TCGA-A2-A0T0-01 | Breast | breast invasive carcinoma | Female | <65 | I/II | Chemotherapy | taxotere | SD | |
| POLR2A | SNV | Missense_Mutation | novel | c.4820N>T | p.Gly1607Val | p.G1607V | protein_coding | tolerated(0.07) | benign(0.088) | TCGA-A2-A25A-01 | Breast | breast invasive carcinoma | Female | <65 | I/II | Unspecific | Cytoxan | SD | |
| POLR2A | SNV | Missense_Mutation | novel | c.3664N>G | p.Thr1222Ala | p.T1222A | protein_coding | tolerated(0.47) | benign(0.373) | TCGA-A7-A0CD-01 | Breast | breast invasive carcinoma | Female | >=65 | I/II | Hormone Therapy | arimidex | SD | |
| POLR2A | SNV | Missense_Mutation | novel | c.3475N>C | p.Cys1159Arg | p.C1159R | protein_coding | tolerated(0.06) | benign(0.067) | TCGA-AO-A128-01 | Breast | breast invasive carcinoma | Female | <65 | I/II | Chemotherapy | doxorubicin | SD | |
| POLR2A | SNV | Missense_Mutation | rs139873836 | c.557N>A | p.Arg186Gln | p.R186Q | protein_coding | tolerated(0.15) | benign(0.209) | TCGA-AQ-A1H2-01 | Breast | breast invasive carcinoma | Female | >=65 | III/IV | Chemotherapy | herceptin | SD | |
| POLR2A | SNV | Missense_Mutation | novel | c.1933N>G | p.Leu645Val | p.L645V | protein_coding | tolerated(1) | benign(0.254) | TCGA-EW-A1IX-01 | Breast | breast invasive carcinoma | Female | <65 | I/II | Hormone Therapy | femara | SD | |
| POLR2A | insertion | Frame_Shift_Ins | novel | c.2587_2588insCCCTAACAGGTGGGGAGCGGAAATGCTCAGGCTCCTATTCCCA | p.Arg863ProfsTer54 | p.R863Pfs*54 | protein_coding | TCGA-A8-A09D-01 | Breast | breast invasive carcinoma | Female | <65 | I/II | Chemotherapy | doxorubicin | CR | |||
| POLR2A | insertion | Frame_Shift_Ins | novel | c.5379_5380insCTTTGGGAGGCCGAGGTGGGTGGATCACGATG | p.Ser1794LeufsTer131 | p.S1794Lfs*131 | protein_coding | TCGA-D8-A1JL-01 | Breast | breast invasive carcinoma | Female | >=65 | I/II | Unknown | Unknown | SD | |||
| POLR2A | SNV | Missense_Mutation | novel | c.4262N>A | p.Arg1421His | p.R1421H | protein_coding | deleterious(0) | probably_damaging(0.998) | TCGA-2W-A8YY-01 | Cervix | cervical & endocervical cancer | Female | <65 | I/II | Chemotherapy | cisplatin | CR | |
| POLR2A | SNV | Missense_Mutation | rs754812578 | c.4715N>T | p.Pro1572Leu | p.P1572L | protein_coding | tolerated(0.14) | possibly_damaging(0.668) | TCGA-2W-A8YY-01 | Cervix | cervical & endocervical cancer | Female | <65 | I/II | Chemotherapy | cisplatin | CR |
| Page: 1 2 3 4 5 6 7 8 9 10 11 12 13 14 15 16 17 18 19 |
Top |
Related drugs of malignant transformation related genes |
| Identification of chemicals and drugs interact with genes involved in malignant transfromation |
| (DGIdb 4.0) |
| Entrez ID | Symbol | Category | Interaction Types | Drug Claim Name | Drug Name | PMIDs |
| 5430 | POLR2A | NA | 3'-DCTP | CHEMBL480328 | 20516278 | |
| 5430 | POLR2A | NA | gemcitabine | GEMCITABINE | ||
| 5430 | POLR2A | NA | PSI-7409 | CHEMBL486231 | 20516278 |
| Page: 1 |

Copyright 2023-Present -The University of Texas Health Science Center at Houston |