
|
|||||
|
 | |
| |
| |
| |
| |
| |
|
Gene: POLR1E |
Gene summary for POLR1E |
| Gene information | Species | Human | Gene symbol | POLR1E | Gene ID | 64425 |
| Gene name | RNA polymerase I subunit E | |
| Gene Alias | A49 | |
| Cytomap | 9p13.2 | |
| Gene Type | protein-coding | GO ID | GO:0001188 | UniProtAcc | B4E005 |
Top |
Malignant transformation analysis |
| Identification of the aberrant gene expression in precancerous and cancerous lesions by comparing the gene expression of stem-like cells in diseased tissues with normal stem cells |
| Entrez ID | Symbol | Replicates | Species | Organ | Tissue | Adj P-value | Log2FC | Malignancy |
| 64425 | POLR1E | LZE7T | Human | Esophagus | ESCC | 7.72e-09 | 2.49e-01 | 0.0667 |
| 64425 | POLR1E | LZE24T | Human | Esophagus | ESCC | 1.41e-04 | 8.75e-02 | 0.0596 |
| 64425 | POLR1E | LZE21T | Human | Esophagus | ESCC | 1.04e-03 | 1.12e-01 | 0.0655 |
| 64425 | POLR1E | P2T-E | Human | Esophagus | ESCC | 2.52e-20 | 4.43e-01 | 0.1177 |
| 64425 | POLR1E | P4T-E | Human | Esophagus | ESCC | 5.25e-08 | 1.74e-01 | 0.1323 |
| 64425 | POLR1E | P5T-E | Human | Esophagus | ESCC | 3.15e-04 | 2.51e-02 | 0.1327 |
| 64425 | POLR1E | P8T-E | Human | Esophagus | ESCC | 1.63e-04 | -1.87e-02 | 0.0889 |
| 64425 | POLR1E | P9T-E | Human | Esophagus | ESCC | 6.59e-04 | 7.10e-02 | 0.1131 |
| 64425 | POLR1E | P10T-E | Human | Esophagus | ESCC | 3.03e-06 | 1.51e-01 | 0.116 |
| 64425 | POLR1E | P12T-E | Human | Esophagus | ESCC | 9.76e-12 | 1.26e-01 | 0.1122 |
| 64425 | POLR1E | P15T-E | Human | Esophagus | ESCC | 1.09e-14 | 3.72e-01 | 0.1149 |
| 64425 | POLR1E | P16T-E | Human | Esophagus | ESCC | 2.25e-20 | 1.91e-01 | 0.1153 |
| 64425 | POLR1E | P19T-E | Human | Esophagus | ESCC | 4.65e-04 | 2.87e-01 | 0.1662 |
| 64425 | POLR1E | P20T-E | Human | Esophagus | ESCC | 2.65e-04 | 5.98e-02 | 0.1124 |
| 64425 | POLR1E | P21T-E | Human | Esophagus | ESCC | 5.88e-19 | 2.85e-01 | 0.1617 |
| 64425 | POLR1E | P22T-E | Human | Esophagus | ESCC | 1.56e-09 | 1.23e-01 | 0.1236 |
| 64425 | POLR1E | P23T-E | Human | Esophagus | ESCC | 1.15e-13 | 4.08e-01 | 0.108 |
| 64425 | POLR1E | P24T-E | Human | Esophagus | ESCC | 2.66e-07 | 2.74e-01 | 0.1287 |
| 64425 | POLR1E | P26T-E | Human | Esophagus | ESCC | 1.18e-15 | 3.56e-01 | 0.1276 |
| 64425 | POLR1E | P27T-E | Human | Esophagus | ESCC | 1.64e-08 | 1.22e-01 | 0.1055 |
| Page: 1 2 3 4 |
| Tissue | Expression Dynamics | Abbreviation |
| Esophagus | 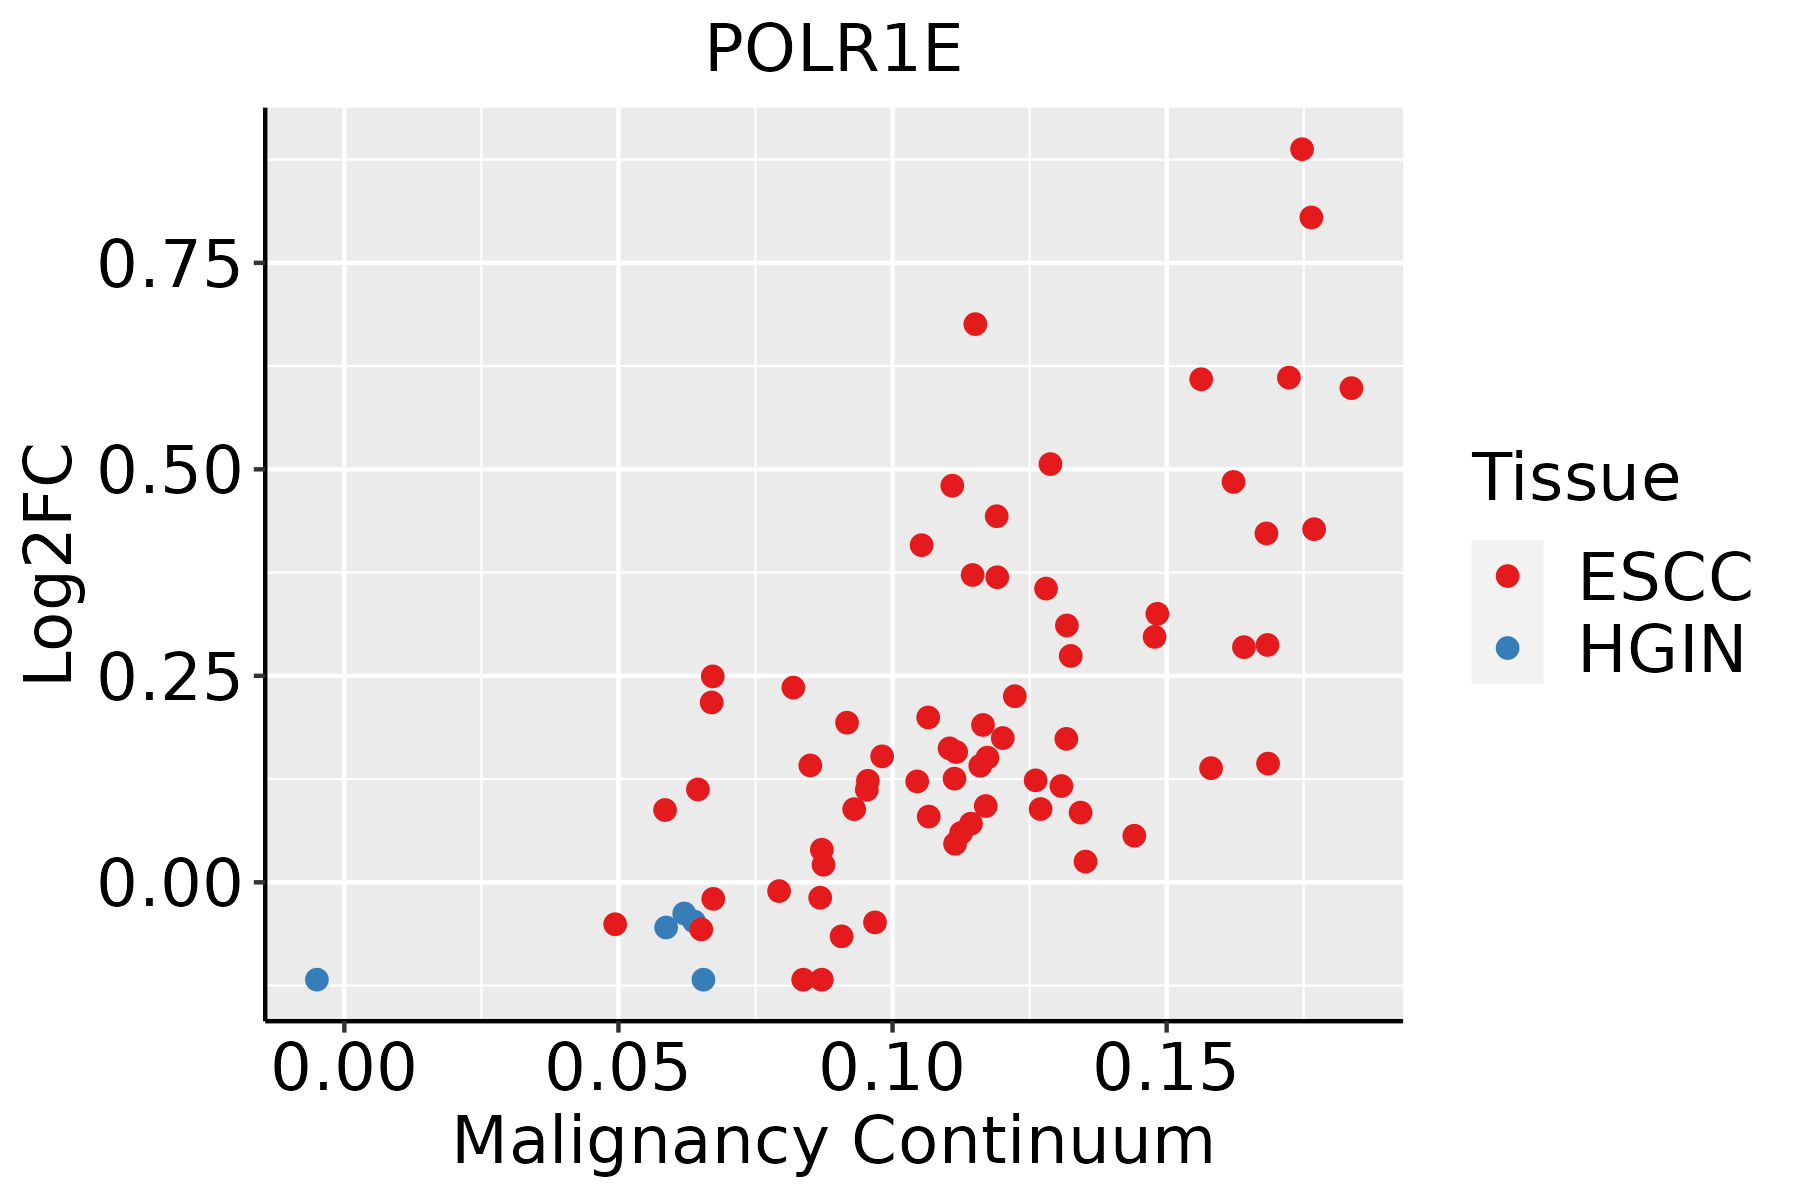 | ESCC: Esophageal squamous cell carcinoma |
| HGIN: High-grade intraepithelial neoplasias | ||
| LGIN: Low-grade intraepithelial neoplasias | ||
| Oral Cavity | 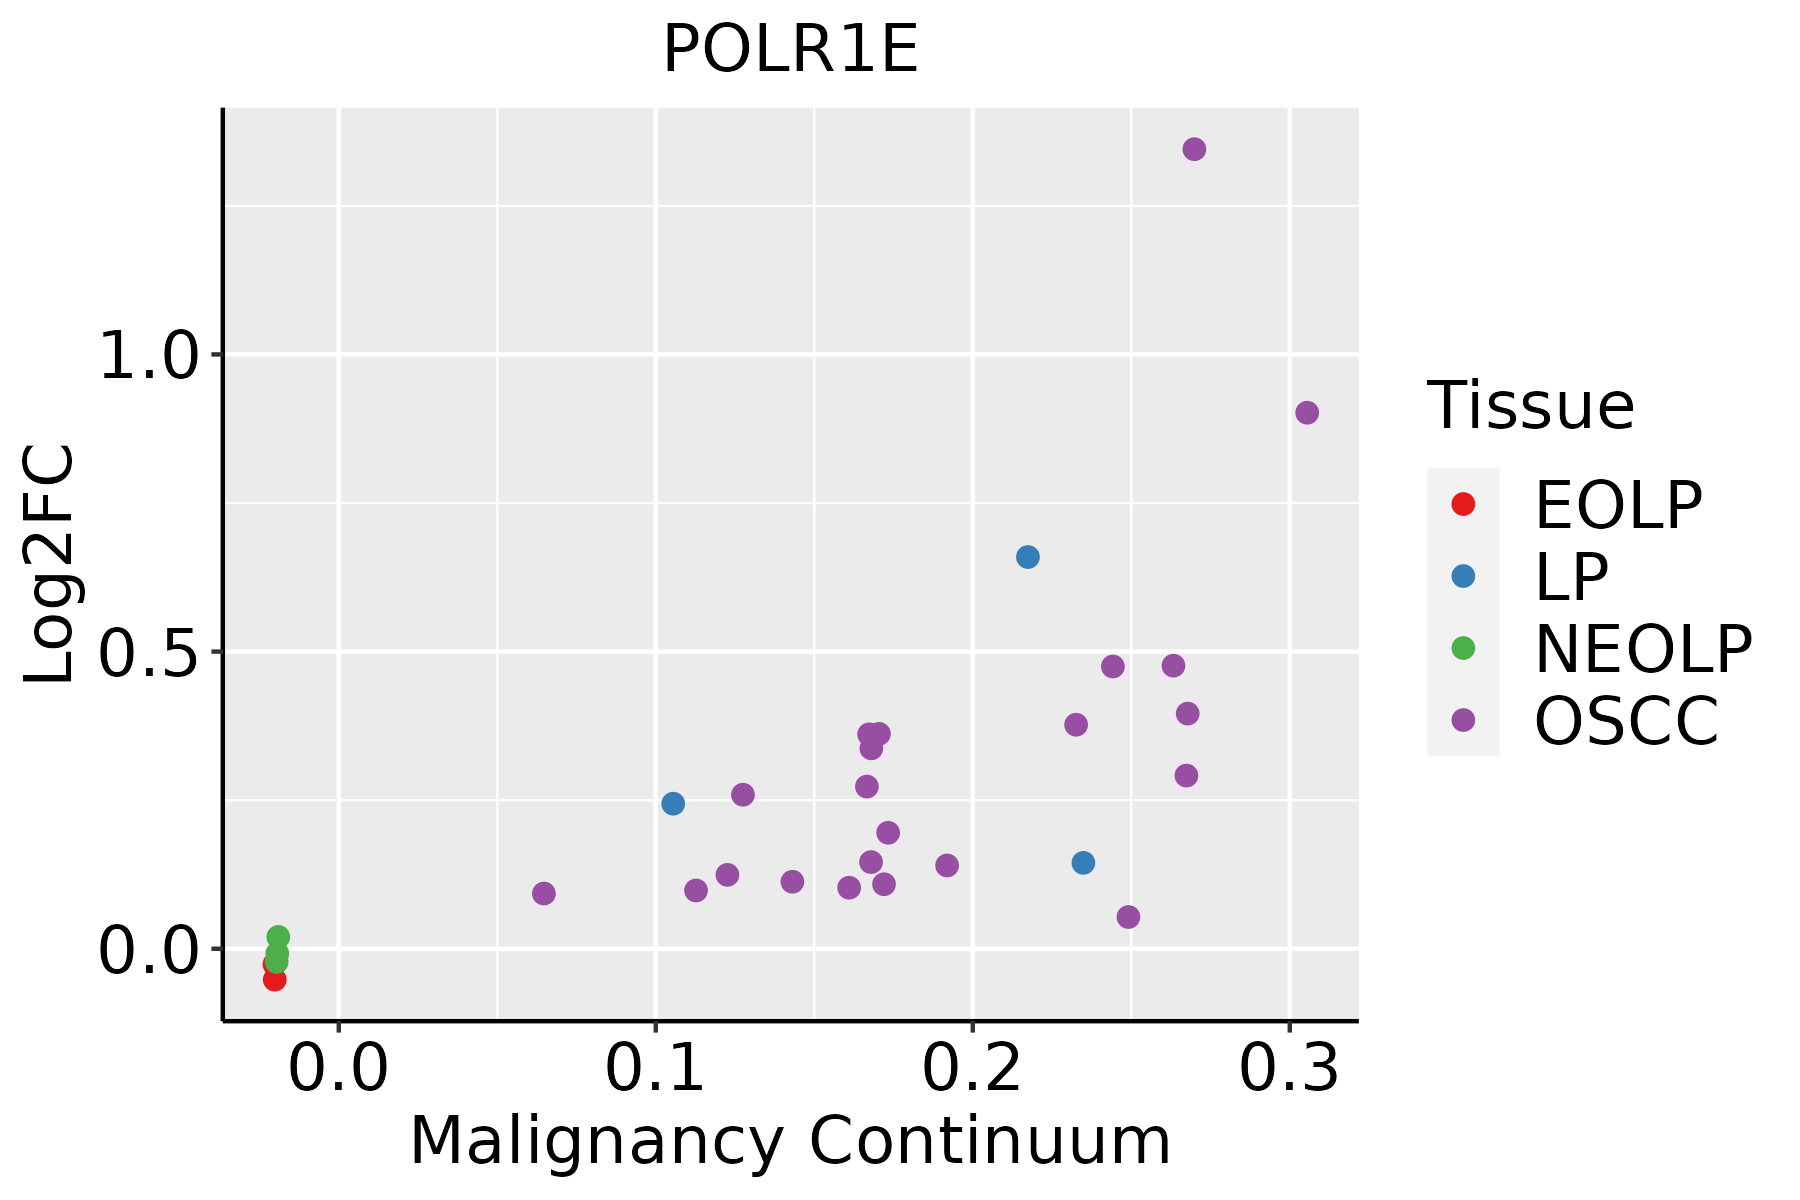 | EOLP: Erosive Oral lichen planus |
| LP: leukoplakia | ||
| NEOLP: Non-erosive oral lichen planus | ||
| OSCC: Oral squamous cell carcinoma |
| ∗log2FC in expression of this searched gene in stem-like cells from each diseased tissue sample relative to stem-like cells in normal samples in each tissue plotted against the malignancy continuum. Samples are colored based on if they are from different disease stage. |
Top |
Malignant transformation related pathway analysis |
| Find out the enriched GO biological processes and KEGG pathways involved in transition from healthy to precancer to cancer |
| Tissue | Disease Stage | Enriched GO biological Processes |
| Colorectum | AD |  |
| Colorectum | SER |  |
| Colorectum | MSS |  |
| Colorectum | MSI-H |  |
| Colorectum | FAP |  |
| ∗Top 15 enriched GO BP terms are showed in the bar plot of each disease state in each tissue. Each row represents a significant GO biological process which is colored according to the -log10(p.adjust). |
| Page: 1 2 3 4 5 6 7 8 9 |
| GO ID | Tissue | Disease Stage | Description | Gene Ratio | Bg Ratio | pvalue | p.adjust | Count |
| GO:000635414 | Esophagus | ESCC | DNA-templated transcription, elongation | 76/8552 | 91/18723 | 8.35e-14 | 4.11e-12 | 76 |
| GO:00987812 | Esophagus | ESCC | ncRNA transcription | 45/8552 | 56/18723 | 1.05e-07 | 1.72e-06 | 45 |
| GO:000635211 | Esophagus | ESCC | DNA-templated transcription, initiation | 86/8552 | 130/18723 | 1.88e-06 | 2.19e-05 | 86 |
| GO:00063602 | Esophagus | ESCC | transcription by RNA polymerase I | 42/8552 | 55/18723 | 3.41e-06 | 3.78e-05 | 42 |
| GO:00708973 | Esophagus | ESCC | transcription preinitiation complex assembly | 30/8552 | 36/18723 | 3.60e-06 | 3.95e-05 | 30 |
| GO:00093032 | Esophagus | ESCC | rRNA transcription | 28/8552 | 34/18723 | 1.21e-05 | 1.12e-04 | 28 |
| GO:00427902 | Esophagus | ESCC | nucleolar large rRNA transcription by RNA polymerase I | 15/8552 | 18/18723 | 1.20e-03 | 5.88e-03 | 15 |
| GO:00063611 | Esophagus | ESCC | transcription initiation from RNA polymerase I promoter | 11/8552 | 13/18723 | 4.76e-03 | 1.85e-02 | 11 |
| GO:00063547 | Oral cavity | OSCC | DNA-templated transcription, elongation | 63/7305 | 91/18723 | 4.86e-09 | 1.07e-07 | 63 |
| GO:00987811 | Oral cavity | OSCC | ncRNA transcription | 38/7305 | 56/18723 | 1.15e-05 | 1.18e-04 | 38 |
| GO:00063522 | Oral cavity | OSCC | DNA-templated transcription, initiation | 74/7305 | 130/18723 | 2.56e-05 | 2.39e-04 | 74 |
| GO:00063601 | Oral cavity | OSCC | transcription by RNA polymerase I | 36/7305 | 55/18723 | 6.42e-05 | 5.22e-04 | 36 |
| GO:00093031 | Oral cavity | OSCC | rRNA transcription | 24/7305 | 34/18723 | 1.89e-04 | 1.28e-03 | 24 |
| GO:00708972 | Oral cavity | OSCC | transcription preinitiation complex assembly | 24/7305 | 36/18723 | 7.18e-04 | 3.95e-03 | 24 |
| GO:00427901 | Oral cavity | OSCC | nucleolar large rRNA transcription by RNA polymerase I | 14/7305 | 18/18723 | 9.51e-04 | 4.96e-03 | 14 |
| Page: 1 |
| Pathway ID | Tissue | Disease Stage | Description | Gene Ratio | Bg Ratio | pvalue | p.adjust | qvalue | Count |
| hsa0302021 | Esophagus | ESCC | RNA polymerase | 28/4205 | 34/8465 | 8.19e-05 | 3.35e-04 | 1.71e-04 | 28 |
| hsa0302031 | Esophagus | ESCC | RNA polymerase | 28/4205 | 34/8465 | 8.19e-05 | 3.35e-04 | 1.71e-04 | 28 |
| hsa030204 | Oral cavity | OSCC | RNA polymerase | 25/3704 | 34/8465 | 4.12e-04 | 1.27e-03 | 6.45e-04 | 25 |
| hsa0302011 | Oral cavity | OSCC | RNA polymerase | 25/3704 | 34/8465 | 4.12e-04 | 1.27e-03 | 6.45e-04 | 25 |
| Page: 1 |
Top |
Cell-cell communication analysis |
| Identification of potential cell-cell interactions between two cell types and their ligand-receptor pairs for different disease states |
| Ligand | Receptor | LRpair | Pathway | Tissue | Disease Stage |
| Page: 1 |
Top |
Single-cell gene regulatory network inference analysis |
| Find out the significant the regulons (TFs) and the target genes of each regulon across cell types for different disease states |
| TF | Cell Type | Tissue | Disease Stage | Target Gene | RSS | Regulon Activity |
| ∗The dot plots of a searched regulon are shown for all cell subpopulations in each disease state of each tissue based on the regulon specific score inferred using pySCENIC and by calculating the average expression. |
| Page: 1 |
Top |
Somatic mutation of malignant transformation related genes |
| Annotation of somatic variants for genes involved in malignant transformation |
| Hugo Symbol | Variant Class | Variant Classification | dbSNP RS | HGVSc | HGVSp | HGVSp Short | SWISSPROT | BIOTYPE | SIFT | PolyPhen | Tumor Sample Barcode | Tissue | Histology | Sex | Age | Stage | Therapy Types | Drugs | Outcome |
| POLR1E | SNV | Missense_Mutation | rs758673612 | c.826N>C | p.Cys276Arg | p.C276R | Q9GZS1 | protein_coding | deleterious(0.01) | benign(0.022) | TCGA-D8-A1XK-01 | Breast | breast invasive carcinoma | Female | <65 | I/II | Chemotherapy | doxorubicine+cyclophosphamide | SD |
| POLR1E | insertion | In_Frame_Ins | novel | c.413_414insTTT | p.Cys138_Ile139insPhe | p.C138_I139insF | Q9GZS1 | protein_coding | TCGA-BH-A0AY-01 | Breast | breast invasive carcinoma | Female | <65 | I/II | Chemotherapy | SD | |||
| POLR1E | insertion | Frame_Shift_Ins | novel | c.415_416insTACATAATTTTTTTTTTTT | p.Glu140HisfsTer7 | p.E140Hfs*7 | Q9GZS1 | protein_coding | TCGA-BH-A0AY-01 | Breast | breast invasive carcinoma | Female | <65 | I/II | Chemotherapy | SD | |||
| POLR1E | SNV | Missense_Mutation | novel | c.1177G>C | p.Asp393His | p.D393H | Q9GZS1 | protein_coding | deleterious(0.03) | benign(0.014) | TCGA-JW-A5VL-01 | Cervix | cervical & endocervical cancer | Female | <65 | I/II | Unknown | Unknown | SD |
| POLR1E | SNV | Missense_Mutation | c.1120G>C | p.Ala374Pro | p.A374P | Q9GZS1 | protein_coding | deleterious(0.01) | probably_damaging(0.989) | TCGA-AA-3681-01 | Colorectum | colon adenocarcinoma | Female | >=65 | III/IV | Unknown | Unknown | SD | |
| POLR1E | SNV | Missense_Mutation | novel | c.405N>T | p.Met135Ile | p.M135I | Q9GZS1 | protein_coding | tolerated(0.32) | benign(0.03) | TCGA-AA-A02R-01 | Colorectum | colon adenocarcinoma | Female | >=65 | I/II | Unknown | Unknown | PD |
| POLR1E | SNV | Missense_Mutation | novel | c.563C>T | p.Ala188Val | p.A188V | Q9GZS1 | protein_coding | tolerated(1) | benign(0.262) | TCGA-AZ-6598-01 | Colorectum | colon adenocarcinoma | Female | >=65 | I/II | Unknown | Unknown | SD |
| POLR1E | SNV | Missense_Mutation | c.665C>A | p.Pro222His | p.P222H | Q9GZS1 | protein_coding | deleterious(0) | possibly_damaging(0.904) | TCGA-G4-6588-01 | Colorectum | colon adenocarcinoma | Female | <65 | I/II | Unknown | Unknown | SD | |
| POLR1E | SNV | Missense_Mutation | rs754446218 | c.986N>T | p.Ser329Leu | p.S329L | Q9GZS1 | protein_coding | deleterious(0) | probably_damaging(0.977) | TCGA-EI-6917-01 | Colorectum | rectum adenocarcinoma | Male | <65 | III/IV | Chemotherapy | 5fluorouracil+oxaciplatina+l-folinian | SD |
| POLR1E | SNV | Missense_Mutation | c.655N>A | p.Leu219Ile | p.L219I | Q9GZS1 | protein_coding | tolerated(1) | benign(0.025) | TCGA-A5-A0G2-01 | Endometrium | uterine corpus endometrioid carcinoma | Female | <65 | III/IV | Unknown | Unknown | SD |
| Page: 1 2 3 4 |
Top |
Related drugs of malignant transformation related genes |
| Identification of chemicals and drugs interact with genes involved in malignant transfromation |
| (DGIdb 4.0) |
| Entrez ID | Symbol | Category | Interaction Types | Drug Claim Name | Drug Name | PMIDs |
| Page: 1 |

Copyright 2023-Present -The University of Texas Health Science Center at Houston |