
|
|||||
|
 | |
| |
| |
| |
| |
| |
|
Gene: POLR1D |
Gene summary for POLR1D |
| Gene information | Species | Human | Gene symbol | POLR1D | Gene ID | 51082 |
| Gene name | RNA polymerase I and III subunit D | |
| Gene Alias | AC19 | |
| Cytomap | 13q12.2 | |
| Gene Type | protein-coding | GO ID | GO:0006139 | UniProtAcc | A0A087WTY1 |
Top |
Malignant transformation analysis |
| Identification of the aberrant gene expression in precancerous and cancerous lesions by comparing the gene expression of stem-like cells in diseased tissues with normal stem cells |
| Entrez ID | Symbol | Replicates | Species | Organ | Tissue | Adj P-value | Log2FC | Malignancy |
| 51082 | POLR1D | HTA11_1938_2000001011 | Human | Colorectum | AD | 1.50e-03 | 4.54e-01 | -0.0811 |
| 51082 | POLR1D | HTA11_347_2000001011 | Human | Colorectum | AD | 1.76e-09 | 4.34e-01 | -0.1954 |
| 51082 | POLR1D | HTA11_1391_2000001011 | Human | Colorectum | AD | 5.85e-08 | 6.58e-01 | -0.059 |
| 51082 | POLR1D | HTA11_7862_2000001011 | Human | Colorectum | AD | 6.28e-07 | 6.15e-01 | -0.0179 |
| 51082 | POLR1D | HTA11_866_3004761011 | Human | Colorectum | AD | 6.00e-13 | 6.04e-01 | 0.096 |
| 51082 | POLR1D | HTA11_8622_2000001021 | Human | Colorectum | SER | 4.40e-05 | 6.66e-01 | 0.0528 |
| 51082 | POLR1D | HTA11_7696_3000711011 | Human | Colorectum | AD | 5.25e-10 | 5.35e-01 | 0.0674 |
| 51082 | POLR1D | HTA11_6818_2000001021 | Human | Colorectum | AD | 1.42e-02 | 4.17e-01 | 0.0588 |
| 51082 | POLR1D | HTA11_99999970781_79442 | Human | Colorectum | MSS | 1.04e-14 | 8.11e-01 | 0.294 |
| 51082 | POLR1D | HTA11_99999965104_69814 | Human | Colorectum | MSS | 2.09e-22 | 1.14e+00 | 0.281 |
| 51082 | POLR1D | HTA11_99999971662_82457 | Human | Colorectum | MSS | 3.71e-49 | 1.58e+00 | 0.3859 |
| 51082 | POLR1D | HTA11_99999973899_84307 | Human | Colorectum | MSS | 7.64e-33 | 2.23e+00 | 0.2585 |
| 51082 | POLR1D | HTA11_99999974143_84620 | Human | Colorectum | MSS | 4.16e-17 | 7.38e-01 | 0.3005 |
| 51082 | POLR1D | A015-C-203 | Human | Colorectum | FAP | 3.36e-06 | -7.53e-02 | -0.1294 |
| 51082 | POLR1D | A002-C-201 | Human | Colorectum | FAP | 2.07e-03 | -1.77e-01 | 0.0324 |
| 51082 | POLR1D | A001-C-119 | Human | Colorectum | FAP | 1.37e-02 | -2.64e-01 | -0.1557 |
| 51082 | POLR1D | A001-C-108 | Human | Colorectum | FAP | 2.19e-05 | -1.93e-01 | -0.0272 |
| 51082 | POLR1D | A002-C-205 | Human | Colorectum | FAP | 3.43e-05 | -1.52e-01 | -0.1236 |
| 51082 | POLR1D | A015-C-006 | Human | Colorectum | FAP | 1.12e-03 | -1.80e-01 | -0.0994 |
| 51082 | POLR1D | A015-C-106 | Human | Colorectum | FAP | 2.85e-03 | -1.03e-01 | -0.0511 |
| Page: 1 2 3 4 5 6 7 8 9 10 11 |
| Tissue | Expression Dynamics | Abbreviation |
| Colorectum (GSE201348) |  | FAP: Familial adenomatous polyposis |
| CRC: Colorectal cancer | ||
| Colorectum (HTA11) |  | AD: Adenomas |
| SER: Sessile serrated lesions | ||
| MSI-H: Microsatellite-high colorectal cancer | ||
| MSS: Microsatellite stable colorectal cancer | ||
| Endometrium |  | AEH: Atypical endometrial hyperplasia |
| EEC: Endometrioid Cancer | ||
| Esophagus | 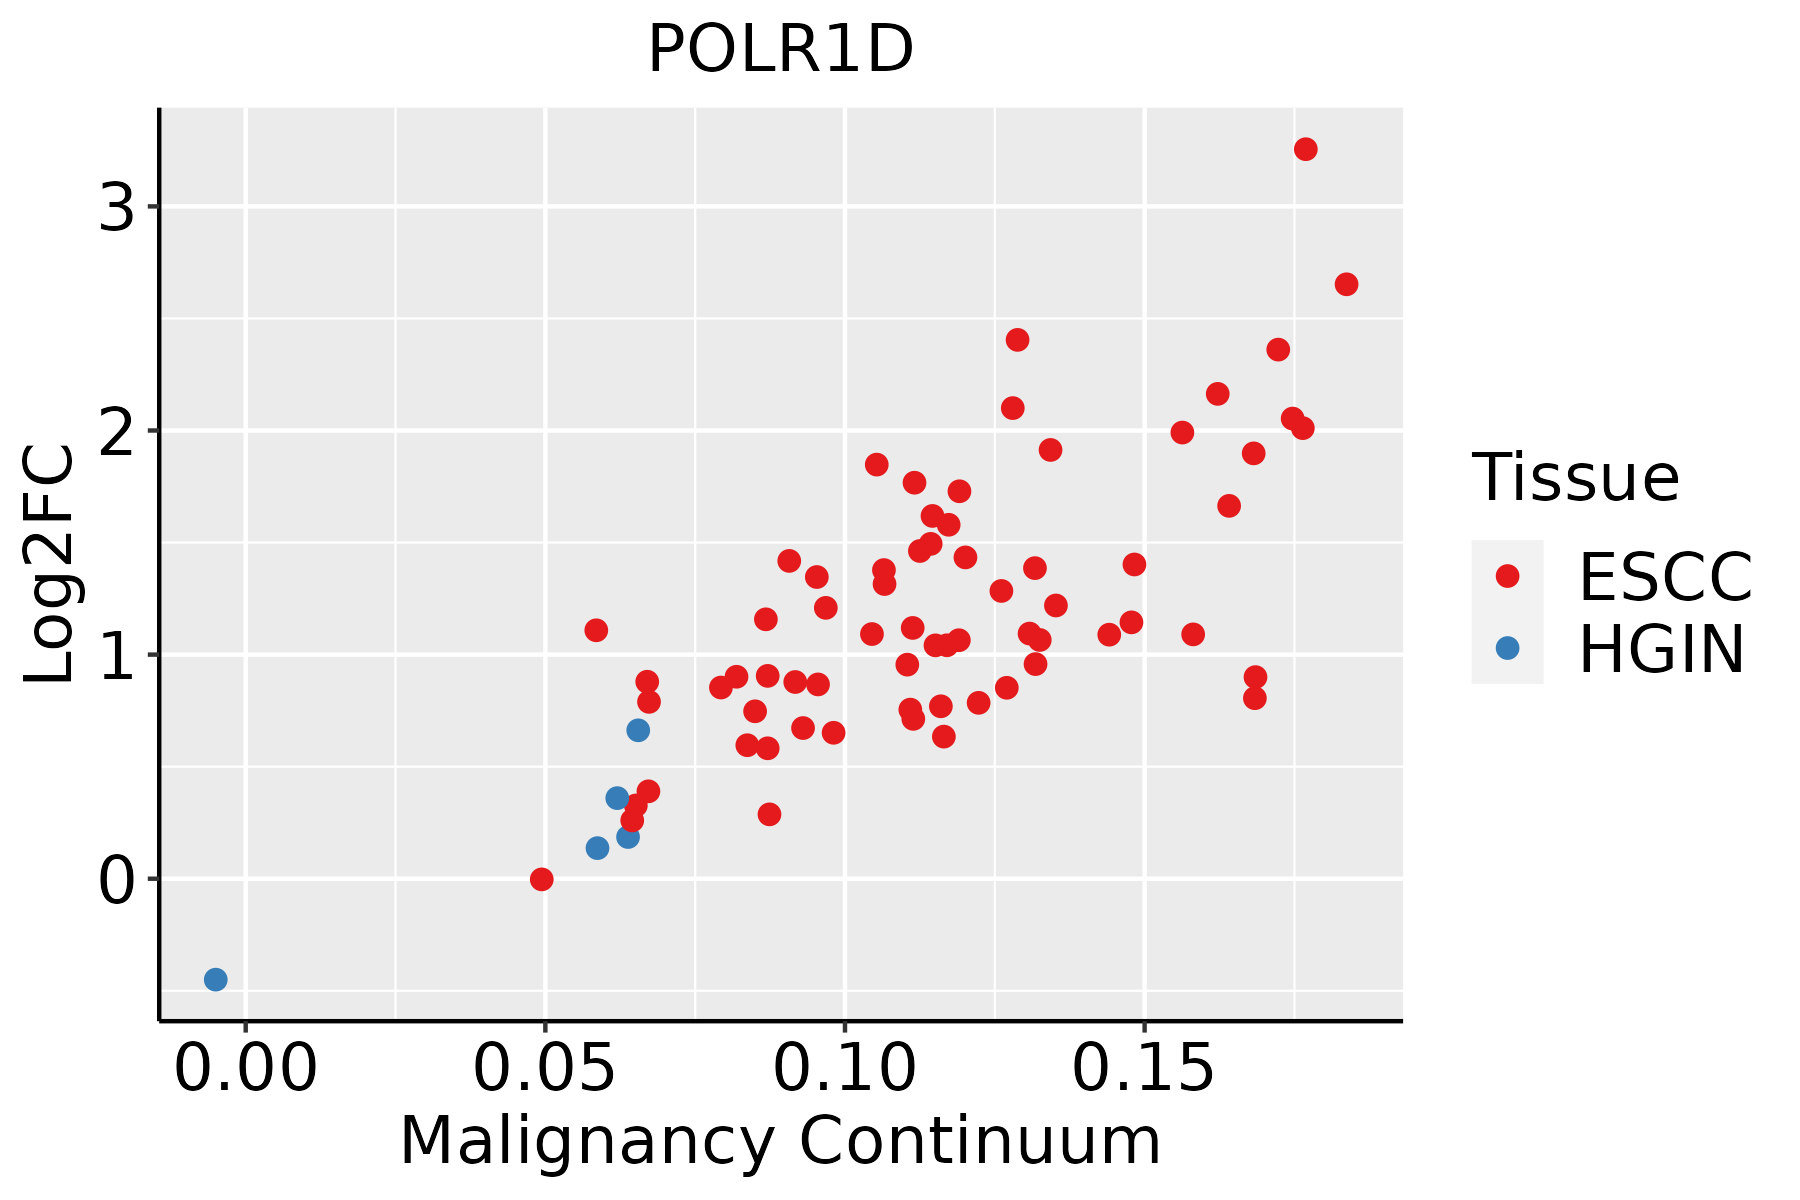 | ESCC: Esophageal squamous cell carcinoma |
| HGIN: High-grade intraepithelial neoplasias | ||
| LGIN: Low-grade intraepithelial neoplasias | ||
| Liver |  | HCC: Hepatocellular carcinoma |
| NAFLD: Non-alcoholic fatty liver disease | ||
| Oral Cavity | 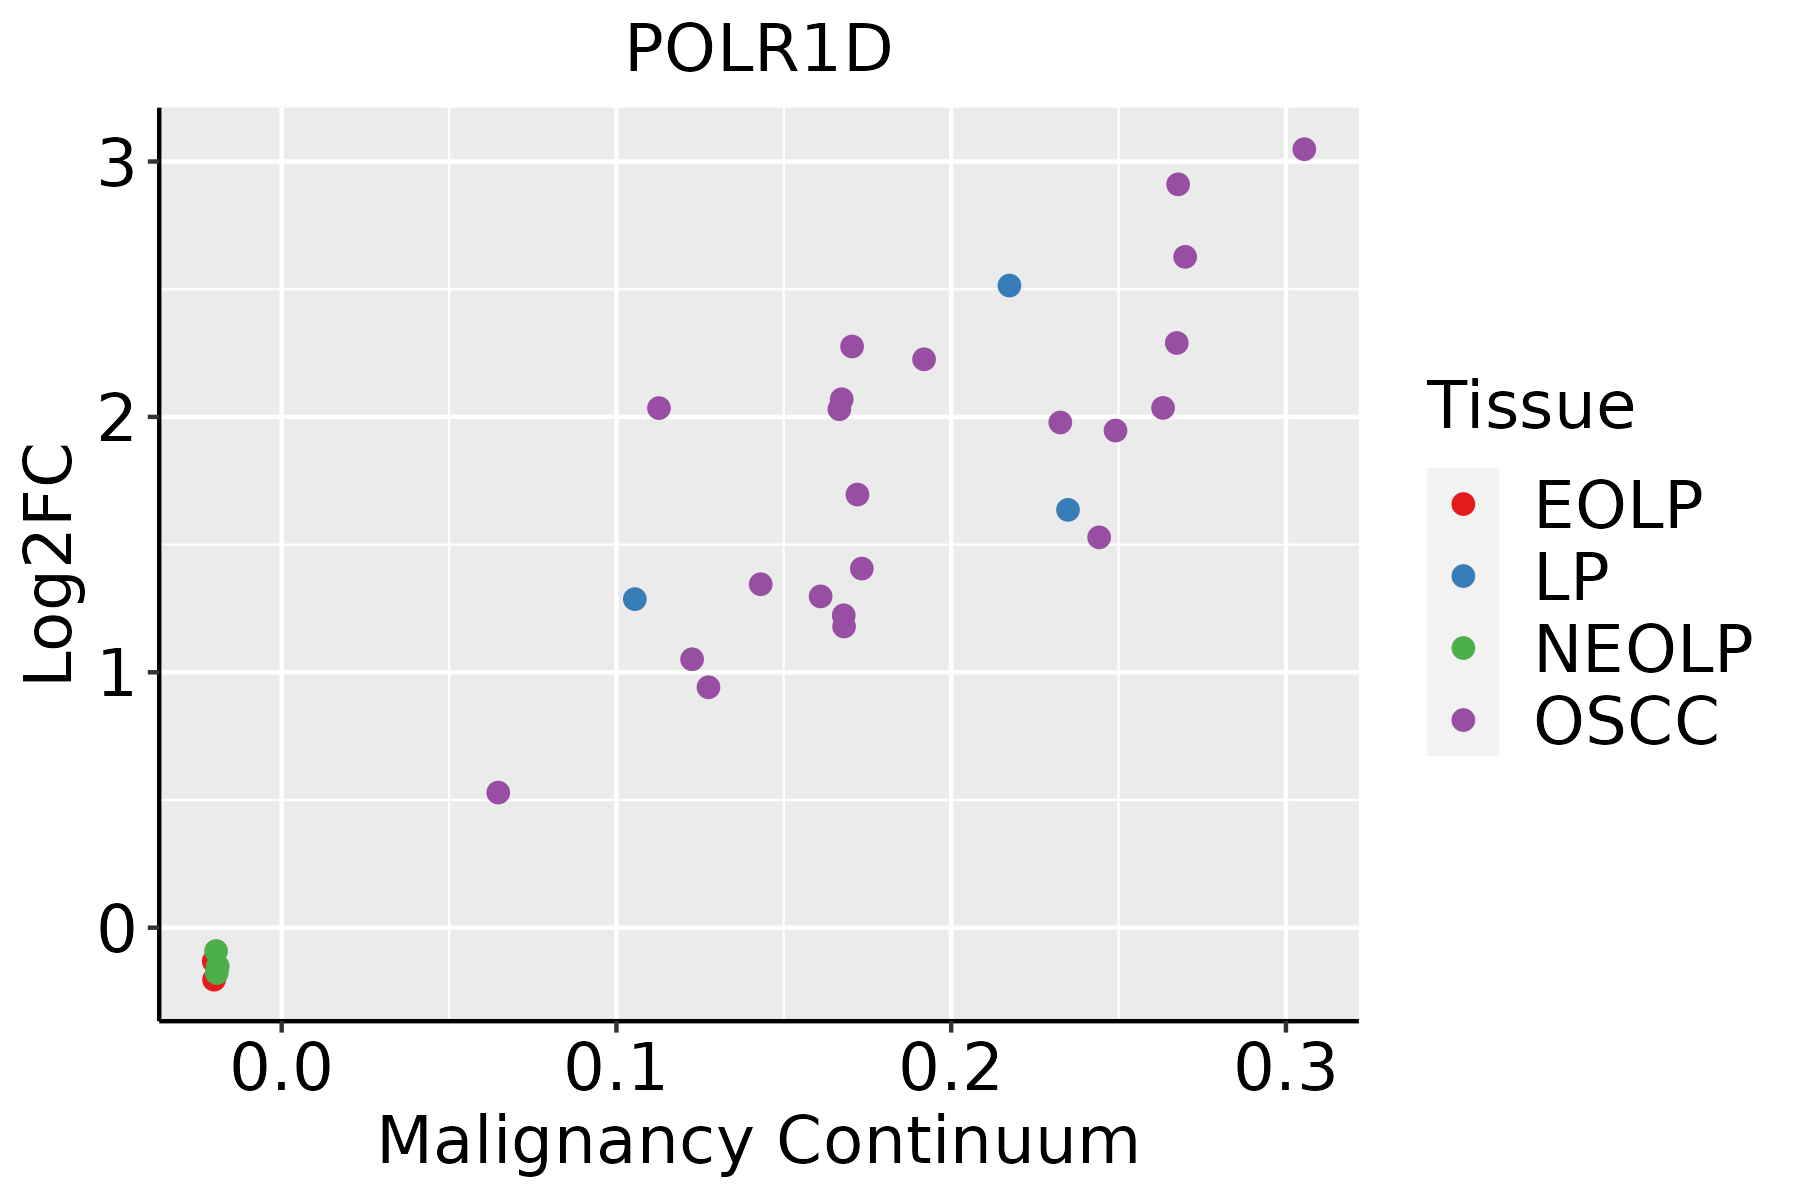 | EOLP: Erosive Oral lichen planus |
| LP: leukoplakia | ||
| NEOLP: Non-erosive oral lichen planus | ||
| OSCC: Oral squamous cell carcinoma | ||
| Prostate | 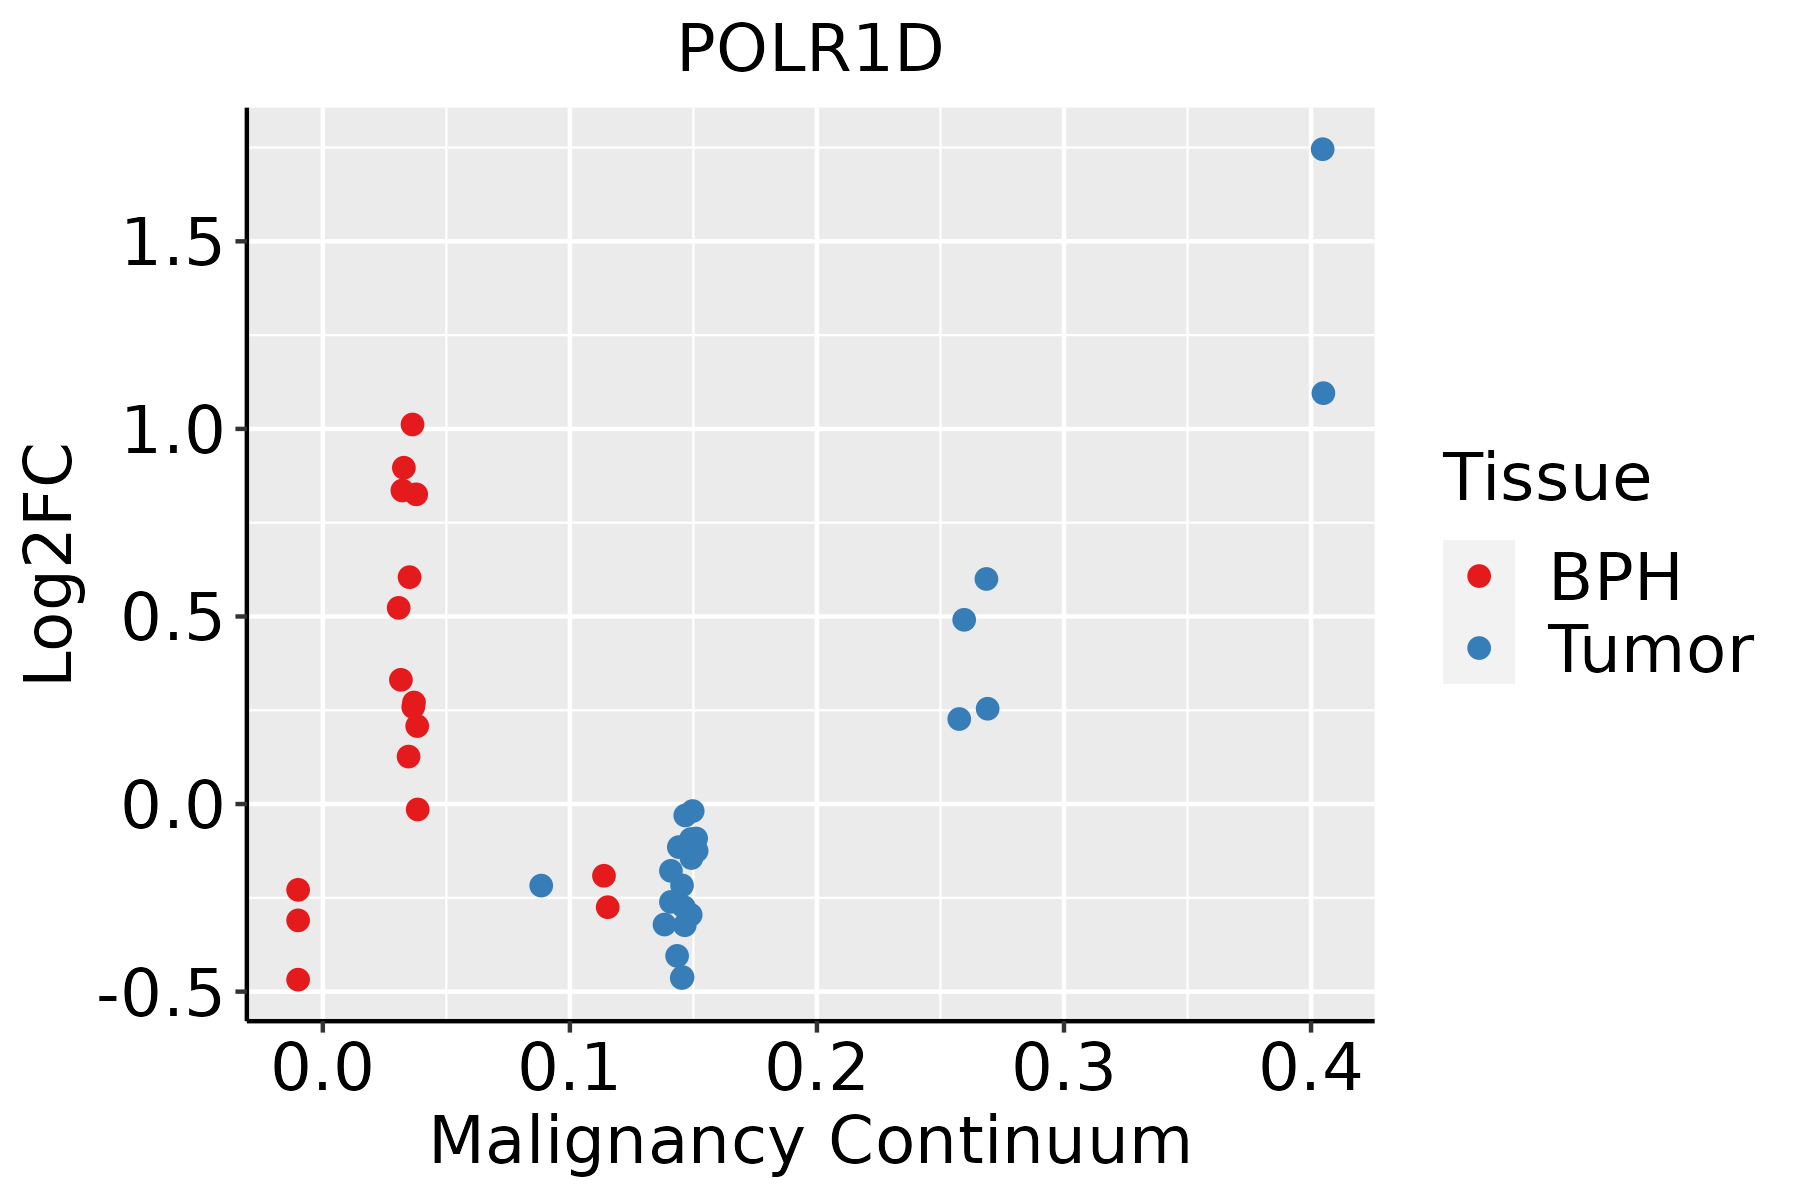 | BPH: Benign Prostatic Hyperplasia |
| Skin | 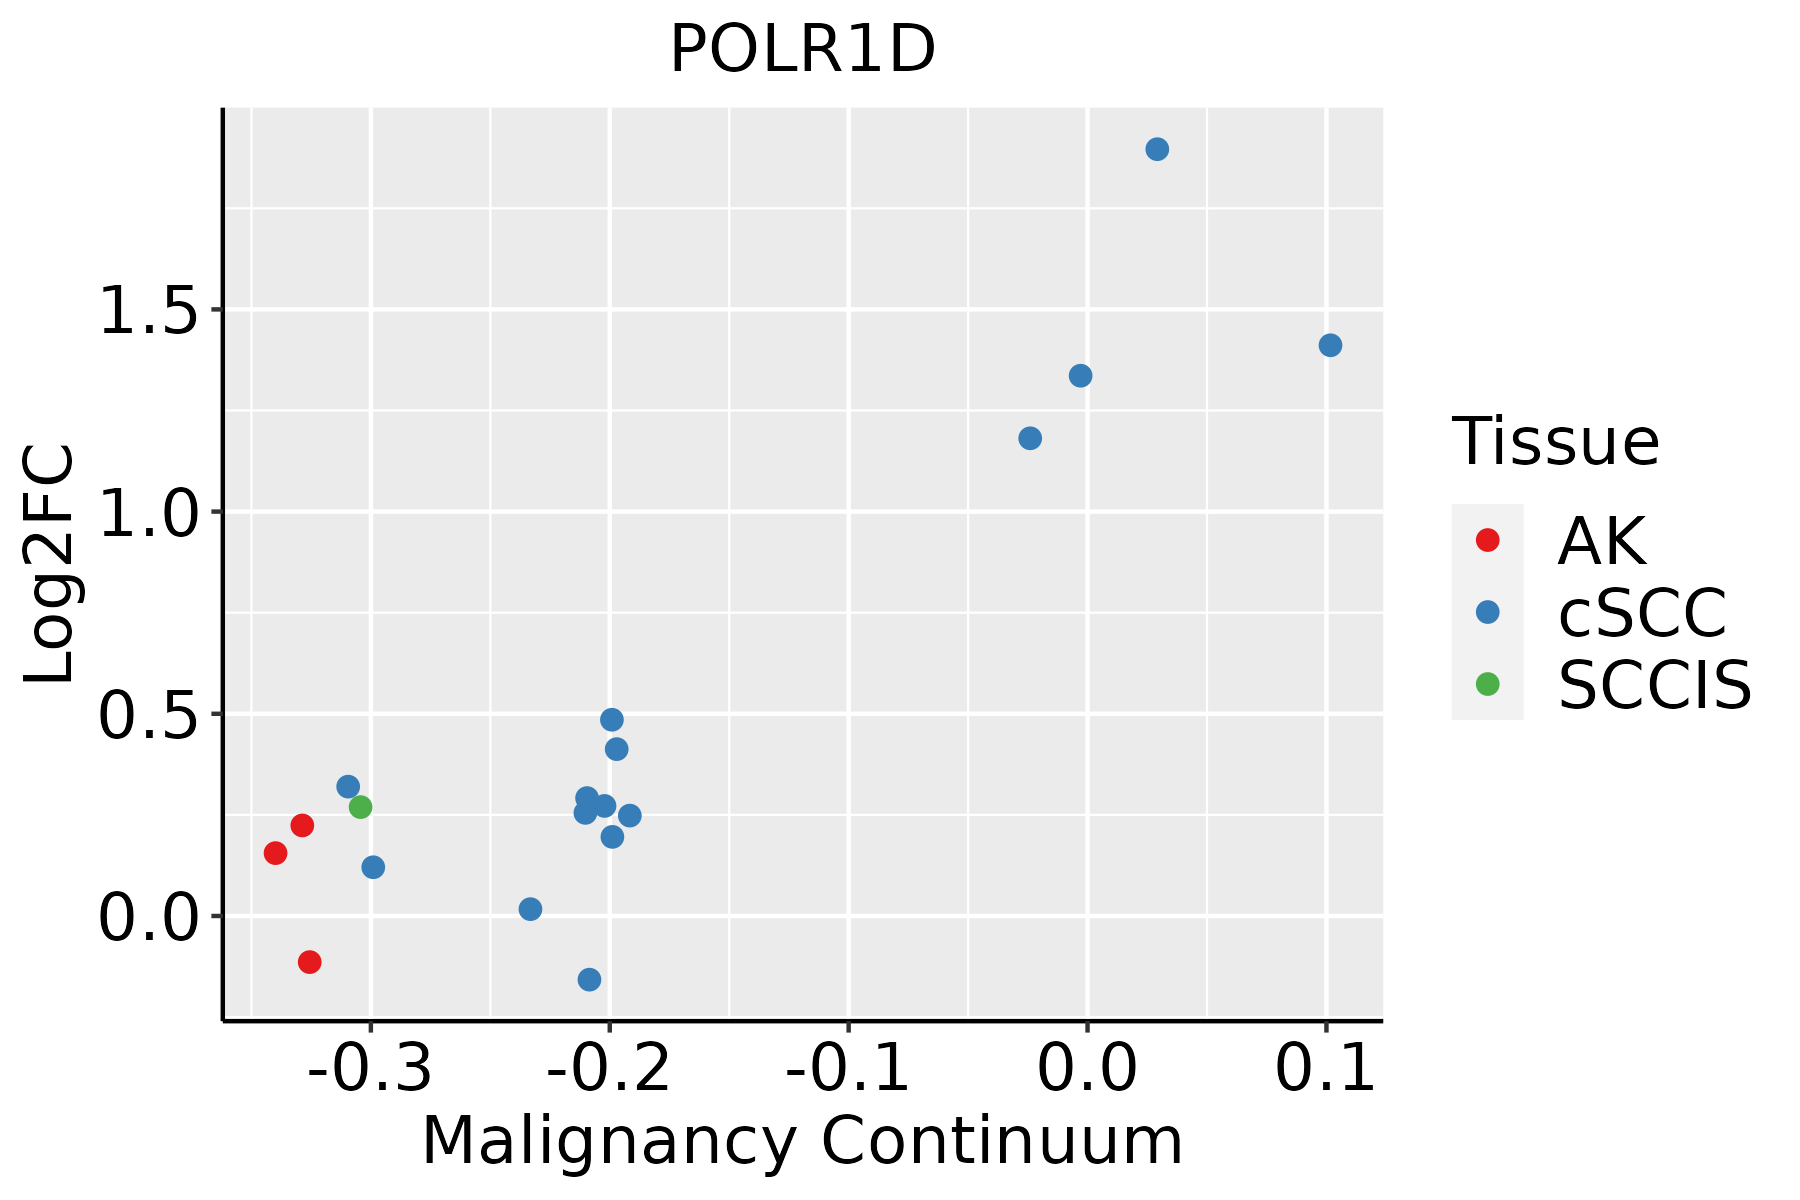 | AK: Actinic keratosis |
| cSCC: Cutaneous squamous cell carcinoma | ||
| SCCIS:squamous cell carcinoma in situ | ||
| Thyroid | 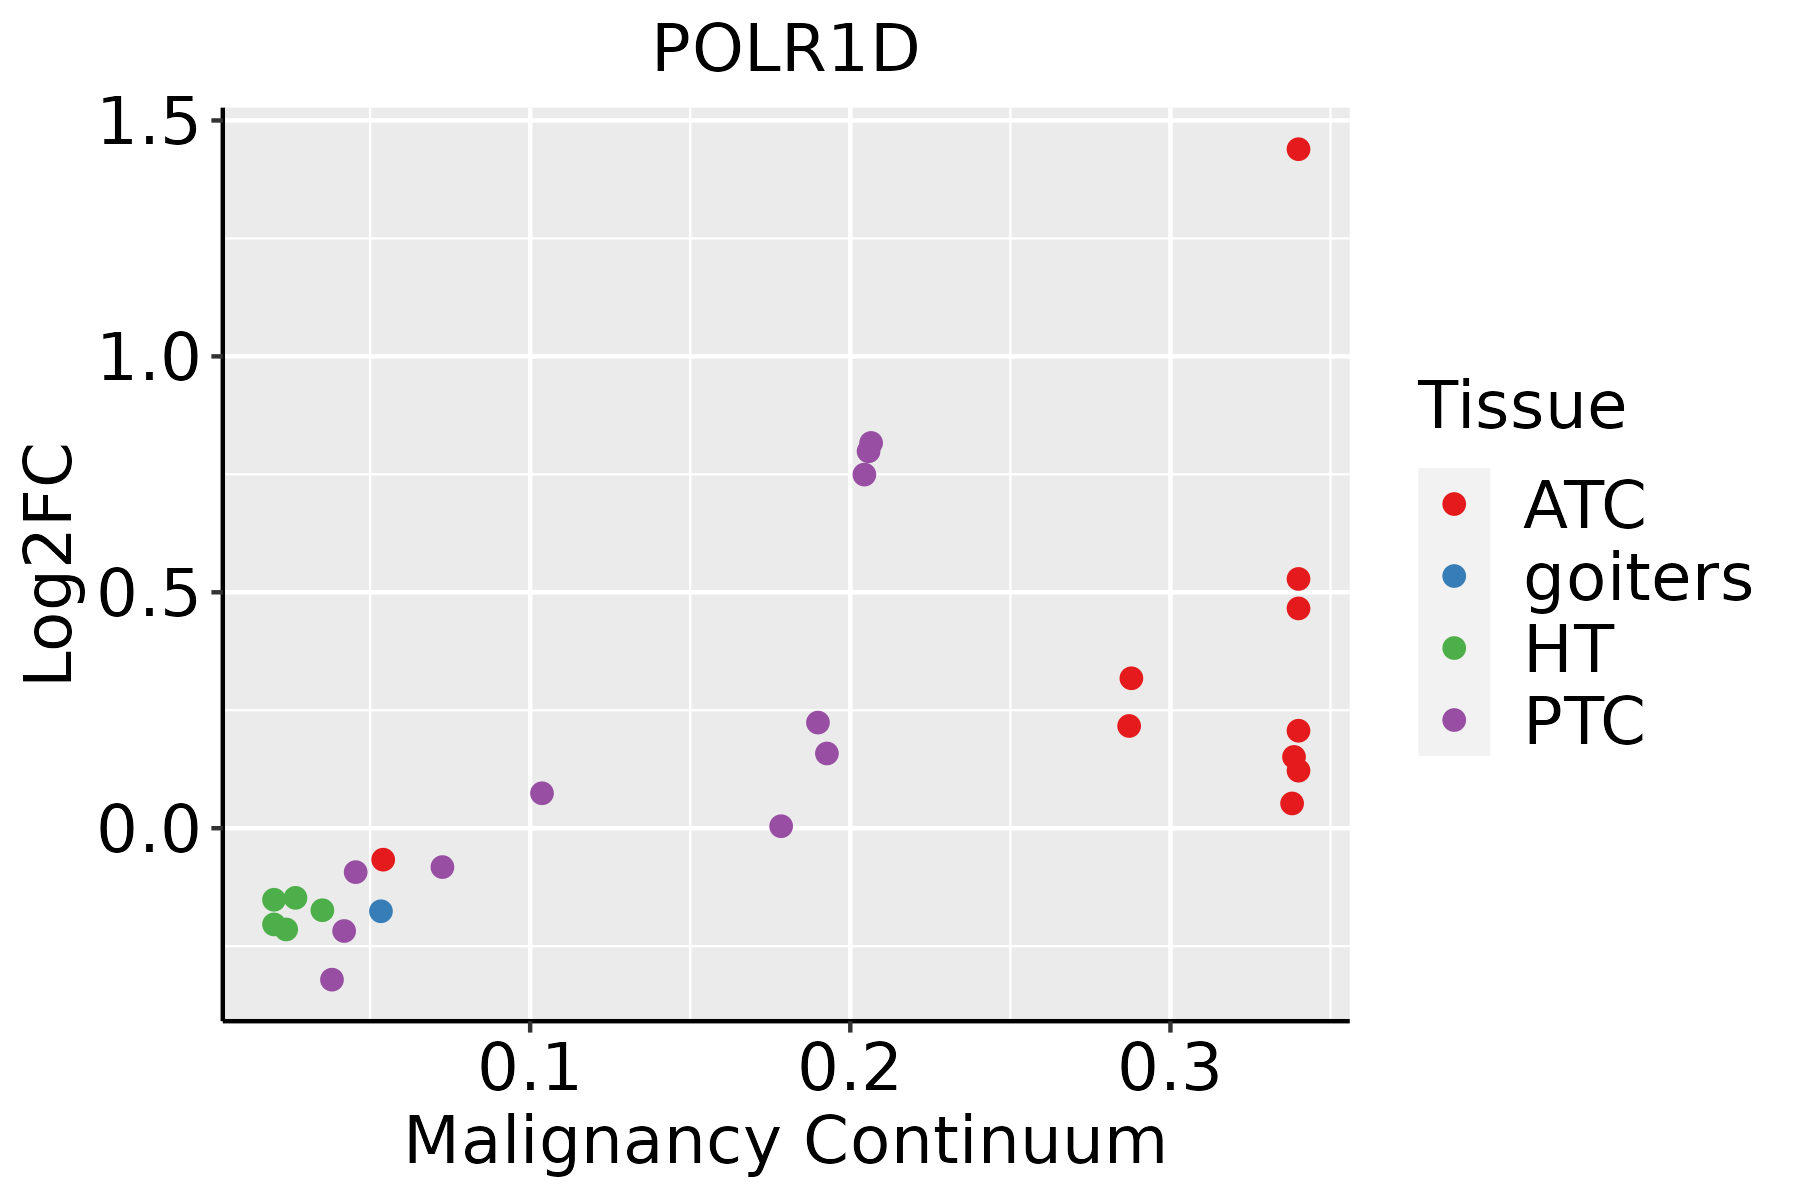 | ATC: Anaplastic thyroid cancer |
| HT: Hashimoto's thyroiditis | ||
| PTC: Papillary thyroid cancer |
| ∗log2FC in expression of this searched gene in stem-like cells from each diseased tissue sample relative to stem-like cells in normal samples in each tissue plotted against the malignancy continuum. Samples are colored based on if they are from different disease stage. |
Top |
Malignant transformation related pathway analysis |
| Find out the enriched GO biological processes and KEGG pathways involved in transition from healthy to precancer to cancer |
| Tissue | Disease Stage | Enriched GO biological Processes |
| Colorectum | AD |  |
| Colorectum | SER |  |
| Colorectum | MSS |  |
| Colorectum | MSI-H |  |
| Colorectum | FAP |  |
| ∗Top 15 enriched GO BP terms are showed in the bar plot of each disease state in each tissue. Each row represents a significant GO biological process which is colored according to the -log10(p.adjust). |
| Page: 1 2 3 4 5 6 7 8 9 |
| GO ID | Tissue | Disease Stage | Description | Gene Ratio | Bg Ratio | pvalue | p.adjust | Count |
| Page: 1 |
| Pathway ID | Tissue | Disease Stage | Description | Gene Ratio | Bg Ratio | pvalue | p.adjust | qvalue | Count |
| hsa0302021 | Esophagus | ESCC | RNA polymerase | 28/4205 | 34/8465 | 8.19e-05 | 3.35e-04 | 1.71e-04 | 28 |
| hsa046234 | Esophagus | ESCC | Cytosolic DNA-sensing pathway | 49/4205 | 75/8465 | 4.35e-03 | 1.12e-02 | 5.74e-03 | 49 |
| hsa0302031 | Esophagus | ESCC | RNA polymerase | 28/4205 | 34/8465 | 8.19e-05 | 3.35e-04 | 1.71e-04 | 28 |
| hsa0462311 | Esophagus | ESCC | Cytosolic DNA-sensing pathway | 49/4205 | 75/8465 | 4.35e-03 | 1.12e-02 | 5.74e-03 | 49 |
| hsa03020 | Liver | HCC | RNA polymerase | 24/4020 | 34/8465 | 5.40e-03 | 1.57e-02 | 8.75e-03 | 24 |
| hsa030201 | Liver | HCC | RNA polymerase | 24/4020 | 34/8465 | 5.40e-03 | 1.57e-02 | 8.75e-03 | 24 |
| hsa030204 | Oral cavity | OSCC | RNA polymerase | 25/3704 | 34/8465 | 4.12e-04 | 1.27e-03 | 6.45e-04 | 25 |
| hsa04623 | Oral cavity | OSCC | Cytosolic DNA-sensing pathway | 44/3704 | 75/8465 | 6.44e-03 | 1.51e-02 | 7.68e-03 | 44 |
| hsa0302011 | Oral cavity | OSCC | RNA polymerase | 25/3704 | 34/8465 | 4.12e-04 | 1.27e-03 | 6.45e-04 | 25 |
| hsa046231 | Oral cavity | OSCC | Cytosolic DNA-sensing pathway | 44/3704 | 75/8465 | 6.44e-03 | 1.51e-02 | 7.68e-03 | 44 |
| hsa030202 | Oral cavity | LP | RNA polymerase | 18/2418 | 34/8465 | 2.35e-03 | 1.03e-02 | 6.63e-03 | 18 |
| hsa046232 | Oral cavity | LP | Cytosolic DNA-sensing pathway | 31/2418 | 75/8465 | 1.17e-02 | 3.91e-02 | 2.52e-02 | 31 |
| hsa030203 | Oral cavity | LP | RNA polymerase | 18/2418 | 34/8465 | 2.35e-03 | 1.03e-02 | 6.63e-03 | 18 |
| hsa046233 | Oral cavity | LP | Cytosolic DNA-sensing pathway | 31/2418 | 75/8465 | 1.17e-02 | 3.91e-02 | 2.52e-02 | 31 |
| Page: 1 |
Top |
Cell-cell communication analysis |
| Identification of potential cell-cell interactions between two cell types and their ligand-receptor pairs for different disease states |
| Ligand | Receptor | LRpair | Pathway | Tissue | Disease Stage |
| Page: 1 |
Top |
Single-cell gene regulatory network inference analysis |
| Find out the significant the regulons (TFs) and the target genes of each regulon across cell types for different disease states |
| TF | Cell Type | Tissue | Disease Stage | Target Gene | RSS | Regulon Activity |
| ∗The dot plots of a searched regulon are shown for all cell subpopulations in each disease state of each tissue based on the regulon specific score inferred using pySCENIC and by calculating the average expression. |
| Page: 1 |
Top |
Somatic mutation of malignant transformation related genes |
| Annotation of somatic variants for genes involved in malignant transformation |
| Hugo Symbol | Variant Class | Variant Classification | dbSNP RS | HGVSc | HGVSp | HGVSp Short | SWISSPROT | BIOTYPE | SIFT | PolyPhen | Tumor Sample Barcode | Tissue | Histology | Sex | Age | Stage | Therapy Types | Drugs | Outcome |
| POLR1D | SNV | Missense_Mutation | c.161N>T | p.Ser54Phe | p.S54F | Q9Y2S0 | protein_coding | deleterious(0) | possibly_damaging(0.745) | TCGA-A8-A083-01 | Breast | breast invasive carcinoma | Female | >=65 | I/II | Unknown | Unknown | SD | |
| POLR1D | SNV | Missense_Mutation | c.293G>C | p.Arg98Thr | p.R98T | Q9Y2S0 | protein_coding | deleterious(0) | benign(0.015) | TCGA-C8-A12T-01 | Breast | breast invasive carcinoma | Female | <65 | I/II | Unknown | Unknown | SD | |
| POLR1D | SNV | Missense_Mutation | c.218C>T | p.Thr73Ile | p.T73I | Q9Y2S0 | protein_coding | deleterious(0.01) | probably_damaging(0.958) | TCGA-AD-6895-01 | Colorectum | colon adenocarcinoma | Male | >=65 | III/IV | Unknown | Unknown | SD | |
| POLR1D | SNV | Missense_Mutation | c.166N>T | p.Arg56Cys | p.R56C | Q9Y2S0 | protein_coding | deleterious(0.02) | probably_damaging(1) | TCGA-AZ-4315-01 | Colorectum | colon adenocarcinoma | Male | <65 | I/II | Unknown | Unknown | SD | |
| POLR1D | SNV | Missense_Mutation | c.101N>A | p.Gly34Glu | p.G34E | Q9Y2S0 | protein_coding | deleterious(0.03) | benign(0.056) | TCGA-CA-6718-01 | Colorectum | colon adenocarcinoma | Male | <65 | I/II | Unknown | Unknown | PD | |
| POLR1D | SNV | Missense_Mutation | novel | c.9G>T | p.Glu3Asp | p.E3D | Q9Y2S0 | protein_coding | tolerated_low_confidence(0.18) | benign(0) | TCGA-F5-6814-01 | Colorectum | rectum adenocarcinoma | Male | <65 | I/II | Unknown | Unknown | SD |
| POLR1D | SNV | Missense_Mutation | novel | c.82G>A | p.Glu28Lys | p.E28K | Q9Y2S0 | protein_coding | tolerated(0.7) | benign(0.007) | TCGA-A5-A1OF-01 | Endometrium | uterine corpus endometrioid carcinoma | Female | <65 | I/II | Unknown | Unknown | SD |
| POLR1D | SNV | Missense_Mutation | novel | c.97G>T | p.Ala33Ser | p.A33S | Q9Y2S0 | protein_coding | tolerated(0.7) | benign(0.01) | TCGA-AP-A05O-01 | Endometrium | uterine corpus endometrioid carcinoma | Female | >=65 | I/II | Chemotherapy | carboplatin | PD |
| POLR1D | SNV | Missense_Mutation | c.136N>A | p.Glu46Lys | p.E46K | Q9Y2S0 | protein_coding | tolerated(0.26) | benign(0.102) | TCGA-AP-A0LM-01 | Endometrium | uterine corpus endometrioid carcinoma | Female | <65 | III/IV | Chemotherapy | cisplatin | SD | |
| POLR1D | SNV | Missense_Mutation | rs770558990 | c.61N>T | p.Arg21Cys | p.R21C | Q9Y2S0 | protein_coding | deleterious(0) | probably_damaging(0.999) | TCGA-AP-A1DV-01 | Endometrium | uterine corpus endometrioid carcinoma | Female | <65 | I/II | Unknown | Unknown | SD |
| Page: 1 2 |
Top |
Related drugs of malignant transformation related genes |
| Identification of chemicals and drugs interact with genes involved in malignant transfromation |
| (DGIdb 4.0) |
| Entrez ID | Symbol | Category | Interaction Types | Drug Claim Name | Drug Name | PMIDs |
| Page: 1 |

Copyright 2023-Present -The University of Texas Health Science Center at Houston |