
|
|||||
|
 | |
| |
| |
| |
| |
| |
|
Gene: POLR1A |
Gene summary for POLR1A |
| Gene information | Species | Human | Gene symbol | POLR1A | Gene ID | 25885 |
| Gene name | RNA polymerase I subunit A | |
| Gene Alias | A190 | |
| Cytomap | 2p11.2 | |
| Gene Type | protein-coding | GO ID | GO:0006139 | UniProtAcc | O95602 |
Top |
Malignant transformation analysis |
| Identification of the aberrant gene expression in precancerous and cancerous lesions by comparing the gene expression of stem-like cells in diseased tissues with normal stem cells |
| Entrez ID | Symbol | Replicates | Species | Organ | Tissue | Adj P-value | Log2FC | Malignancy |
| 25885 | POLR1A | LZE7T | Human | Esophagus | ESCC | 7.76e-08 | 2.06e-01 | 0.0667 |
| 25885 | POLR1A | LZE24T | Human | Esophagus | ESCC | 7.67e-11 | 1.35e-01 | 0.0596 |
| 25885 | POLR1A | P2T-E | Human | Esophagus | ESCC | 1.61e-23 | 3.73e-01 | 0.1177 |
| 25885 | POLR1A | P4T-E | Human | Esophagus | ESCC | 1.66e-12 | 2.55e-01 | 0.1323 |
| 25885 | POLR1A | P5T-E | Human | Esophagus | ESCC | 1.12e-11 | 1.67e-01 | 0.1327 |
| 25885 | POLR1A | P8T-E | Human | Esophagus | ESCC | 9.99e-10 | 1.30e-01 | 0.0889 |
| 25885 | POLR1A | P9T-E | Human | Esophagus | ESCC | 6.98e-06 | 1.40e-01 | 0.1131 |
| 25885 | POLR1A | P10T-E | Human | Esophagus | ESCC | 2.08e-29 | 4.73e-01 | 0.116 |
| 25885 | POLR1A | P11T-E | Human | Esophagus | ESCC | 1.72e-04 | 3.20e-01 | 0.1426 |
| 25885 | POLR1A | P12T-E | Human | Esophagus | ESCC | 8.54e-15 | 1.99e-01 | 0.1122 |
| 25885 | POLR1A | P15T-E | Human | Esophagus | ESCC | 7.20e-11 | 2.15e-01 | 0.1149 |
| 25885 | POLR1A | P16T-E | Human | Esophagus | ESCC | 8.00e-14 | 2.32e-01 | 0.1153 |
| 25885 | POLR1A | P17T-E | Human | Esophagus | ESCC | 9.21e-07 | 1.64e-01 | 0.1278 |
| 25885 | POLR1A | P19T-E | Human | Esophagus | ESCC | 1.58e-02 | 2.40e-01 | 0.1662 |
| 25885 | POLR1A | P20T-E | Human | Esophagus | ESCC | 6.35e-11 | 2.88e-01 | 0.1124 |
| 25885 | POLR1A | P21T-E | Human | Esophagus | ESCC | 9.65e-16 | 2.90e-01 | 0.1617 |
| 25885 | POLR1A | P22T-E | Human | Esophagus | ESCC | 6.27e-11 | 1.83e-01 | 0.1236 |
| 25885 | POLR1A | P23T-E | Human | Esophagus | ESCC | 8.12e-10 | 2.27e-01 | 0.108 |
| 25885 | POLR1A | P24T-E | Human | Esophagus | ESCC | 3.13e-08 | 1.68e-01 | 0.1287 |
| 25885 | POLR1A | P26T-E | Human | Esophagus | ESCC | 8.01e-17 | 3.38e-01 | 0.1276 |
| Page: 1 2 3 4 |
| Tissue | Expression Dynamics | Abbreviation |
| Esophagus | 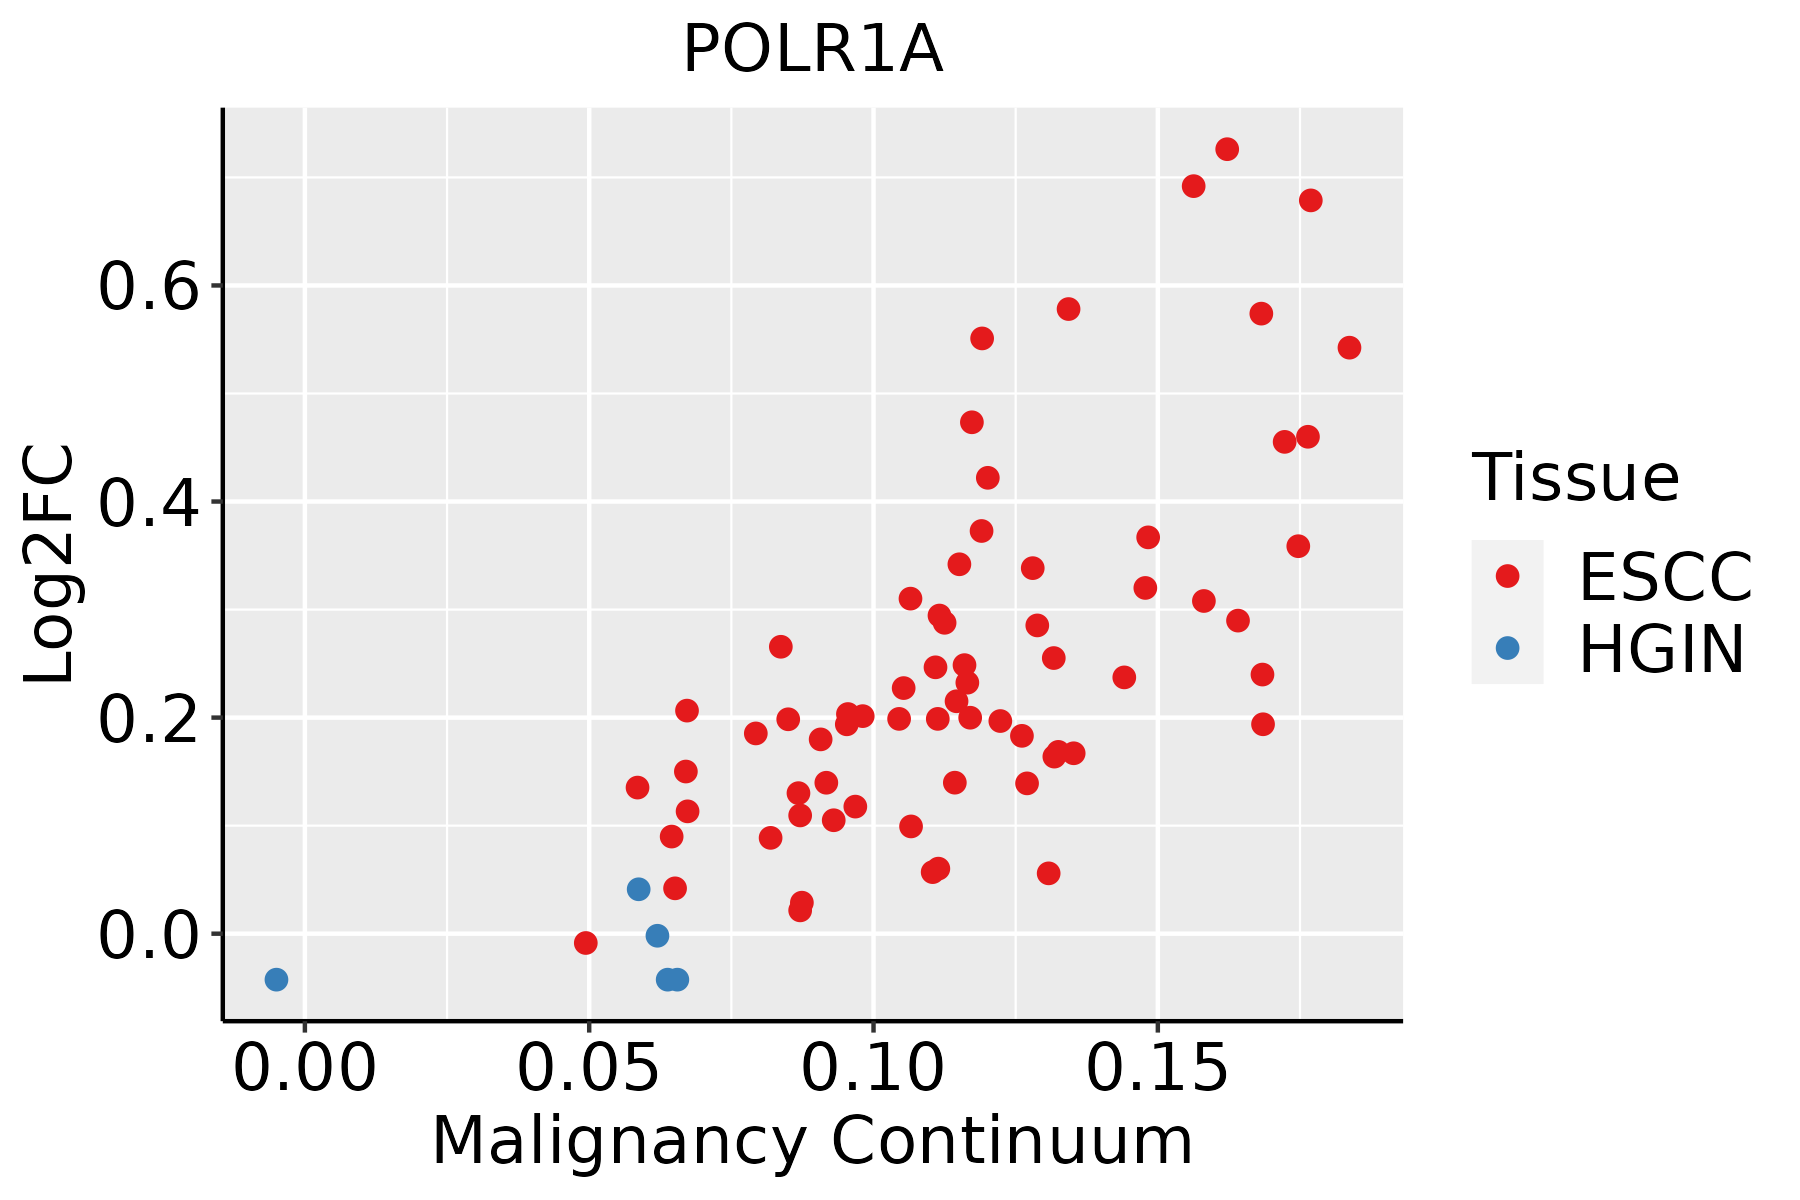 | ESCC: Esophageal squamous cell carcinoma |
| HGIN: High-grade intraepithelial neoplasias | ||
| LGIN: Low-grade intraepithelial neoplasias | ||
| Liver |  | HCC: Hepatocellular carcinoma |
| NAFLD: Non-alcoholic fatty liver disease |
| ∗log2FC in expression of this searched gene in stem-like cells from each diseased tissue sample relative to stem-like cells in normal samples in each tissue plotted against the malignancy continuum. Samples are colored based on if they are from different disease stage. |
Top |
Malignant transformation related pathway analysis |
| Find out the enriched GO biological processes and KEGG pathways involved in transition from healthy to precancer to cancer |
| Tissue | Disease Stage | Enriched GO biological Processes |
| Colorectum | AD |  |
| Colorectum | SER |  |
| Colorectum | MSS |  |
| Colorectum | MSI-H |  |
| Colorectum | FAP |  |
| ∗Top 15 enriched GO BP terms are showed in the bar plot of each disease state in each tissue. Each row represents a significant GO biological process which is colored according to the -log10(p.adjust). |
| Page: 1 2 3 4 5 6 7 8 9 |
| GO ID | Tissue | Disease Stage | Description | Gene Ratio | Bg Ratio | pvalue | p.adjust | Count |
| GO:003450418 | Esophagus | ESCC | protein localization to nucleus | 211/8552 | 290/18723 | 4.06e-21 | 6.60e-19 | 211 |
| GO:190018018 | Esophagus | ESCC | regulation of protein localization to nucleus | 102/8552 | 136/18723 | 2.84e-12 | 1.13e-10 | 102 |
| GO:00063602 | Esophagus | ESCC | transcription by RNA polymerase I | 42/8552 | 55/18723 | 3.41e-06 | 3.78e-05 | 42 |
| GO:19038289 | Esophagus | ESCC | negative regulation of cellular protein localization | 76/8552 | 117/18723 | 1.97e-05 | 1.72e-04 | 76 |
| GO:190257011 | Esophagus | ESCC | protein localization to nucleolus | 13/8552 | 16/18723 | 4.05e-03 | 1.62e-02 | 13 |
| GO:003450421 | Liver | HCC | protein localization to nucleus | 194/7958 | 290/18723 | 2.84e-17 | 2.85e-15 | 194 |
| GO:190018012 | Liver | HCC | regulation of protein localization to nucleus | 95/7958 | 136/18723 | 9.26e-11 | 3.26e-09 | 95 |
| GO:190382811 | Liver | HCC | negative regulation of cellular protein localization | 71/7958 | 117/18723 | 5.44e-05 | 5.12e-04 | 71 |
| GO:0006360 | Liver | HCC | transcription by RNA polymerase I | 36/7958 | 55/18723 | 4.94e-04 | 3.23e-03 | 36 |
| GO:19025701 | Liver | HCC | protein localization to nucleolus | 13/7958 | 16/18723 | 1.84e-03 | 9.42e-03 | 13 |
| Page: 1 |
| Pathway ID | Tissue | Disease Stage | Description | Gene Ratio | Bg Ratio | pvalue | p.adjust | qvalue | Count |
| hsa0302021 | Esophagus | ESCC | RNA polymerase | 28/4205 | 34/8465 | 8.19e-05 | 3.35e-04 | 1.71e-04 | 28 |
| hsa0302031 | Esophagus | ESCC | RNA polymerase | 28/4205 | 34/8465 | 8.19e-05 | 3.35e-04 | 1.71e-04 | 28 |
| hsa03020 | Liver | HCC | RNA polymerase | 24/4020 | 34/8465 | 5.40e-03 | 1.57e-02 | 8.75e-03 | 24 |
| hsa030201 | Liver | HCC | RNA polymerase | 24/4020 | 34/8465 | 5.40e-03 | 1.57e-02 | 8.75e-03 | 24 |
| Page: 1 |
Top |
Cell-cell communication analysis |
| Identification of potential cell-cell interactions between two cell types and their ligand-receptor pairs for different disease states |
| Ligand | Receptor | LRpair | Pathway | Tissue | Disease Stage |
| Page: 1 |
Top |
Single-cell gene regulatory network inference analysis |
| Find out the significant the regulons (TFs) and the target genes of each regulon across cell types for different disease states |
| TF | Cell Type | Tissue | Disease Stage | Target Gene | RSS | Regulon Activity |
| ∗The dot plots of a searched regulon are shown for all cell subpopulations in each disease state of each tissue based on the regulon specific score inferred using pySCENIC and by calculating the average expression. |
| Page: 1 |
Top |
Somatic mutation of malignant transformation related genes |
| Annotation of somatic variants for genes involved in malignant transformation |
| Hugo Symbol | Variant Class | Variant Classification | dbSNP RS | HGVSc | HGVSp | HGVSp Short | SWISSPROT | BIOTYPE | SIFT | PolyPhen | Tumor Sample Barcode | Tissue | Histology | Sex | Age | Stage | Therapy Types | Drugs | Outcome |
| POLR1A | SNV | Missense_Mutation | novel | c.2069C>A | p.Thr690Lys | p.T690K | O95602 | protein_coding | deleterious(0) | probably_damaging(0.99) | TCGA-A2-A0EP-01 | Breast | breast invasive carcinoma | Female | <65 | I/II | Chemotherapy | cyclophosphamide | CR |
| POLR1A | SNV | Missense_Mutation | novel | c.1794N>A | p.Phe598Leu | p.F598L | O95602 | protein_coding | tolerated(0.09) | possibly_damaging(0.841) | TCGA-AN-A046-01 | Breast | breast invasive carcinoma | Female | >=65 | I/II | Unknown | Unknown | SD |
| POLR1A | SNV | Missense_Mutation | c.799N>A | p.Ala267Thr | p.A267T | O95602 | protein_coding | tolerated(0.22) | benign(0.021) | TCGA-AN-A0AK-01 | Breast | breast invasive carcinoma | Female | >=65 | I/II | Unknown | Unknown | SD | |
| POLR1A | SNV | Missense_Mutation | rs373061040 | c.4682N>A | p.Arg1561Gln | p.R1561Q | O95602 | protein_coding | tolerated(0.05) | probably_damaging(0.961) | TCGA-AO-A128-01 | Breast | breast invasive carcinoma | Female | <65 | I/II | Chemotherapy | doxorubicin | SD |
| POLR1A | SNV | Missense_Mutation | rs762778123 | c.2528G>A | p.Arg843Gln | p.R843Q | O95602 | protein_coding | tolerated(1) | benign(0.003) | TCGA-AR-A250-01 | Breast | breast invasive carcinoma | Female | <65 | I/II | Chemotherapy | doxorubicin | SD |
| POLR1A | SNV | Missense_Mutation | c.4538N>G | p.Asp1513Gly | p.D1513G | O95602 | protein_coding | tolerated(0.14) | benign(0) | TCGA-BH-A0B1-01 | Breast | breast invasive carcinoma | Female | >=65 | I/II | Chemotherapy | adriamycin | SD | |
| POLR1A | SNV | Missense_Mutation | novel | c.4411G>C | p.Glu1471Gln | p.E1471Q | O95602 | protein_coding | tolerated(0.28) | possibly_damaging(0.87) | TCGA-BH-A18P-01 | Breast | breast invasive carcinoma | Female | <65 | I/II | Unknown | Unknown | PD |
| POLR1A | SNV | Missense_Mutation | c.2614T>G | p.Tyr872Asp | p.Y872D | O95602 | protein_coding | deleterious(0.03) | benign(0.409) | TCGA-D8-A1JG-01 | Breast | breast invasive carcinoma | Female | <65 | I/II | Chemotherapy | doxorubicin | SD | |
| POLR1A | SNV | Missense_Mutation | c.721G>C | p.Glu241Gln | p.E241Q | O95602 | protein_coding | tolerated(0.17) | benign(0.076) | TCGA-GM-A2DO-01 | Breast | breast invasive carcinoma | Female | <65 | I/II | Hormone Therapy | tamoxiphen | CR | |
| POLR1A | SNV | Missense_Mutation | novel | c.4006N>A | p.Glu1336Lys | p.E1336K | O95602 | protein_coding | tolerated(0.9) | benign(0.011) | TCGA-PE-A5DE-01 | Breast | breast invasive carcinoma | Female | <65 | I/II | Chemotherapy | taxotere | CR |
| Page: 1 2 3 4 5 6 7 8 9 10 11 12 13 14 15 16 |
Top |
Related drugs of malignant transformation related genes |
| Identification of chemicals and drugs interact with genes involved in malignant transfromation |
| (DGIdb 4.0) |
| Entrez ID | Symbol | Category | Interaction Types | Drug Claim Name | Drug Name | PMIDs |
| Page: 1 |

Copyright 2023-Present -The University of Texas Health Science Center at Houston |