
|
|||||
|
 | |
| |
| |
| |
| |
| |
|
Gene: POLM |
Gene summary for POLM |
| Gene information | Species | Human | Gene symbol | POLM | Gene ID | 27434 |
| Gene name | DNA polymerase mu | |
| Gene Alias | Pol Mu | |
| Cytomap | 7p13 | |
| Gene Type | protein-coding | GO ID | GO:0006139 | UniProtAcc | Q9NP87 |
Top |
Malignant transformation analysis |
| Identification of the aberrant gene expression in precancerous and cancerous lesions by comparing the gene expression of stem-like cells in diseased tissues with normal stem cells |
| Entrez ID | Symbol | Replicates | Species | Organ | Tissue | Adj P-value | Log2FC | Malignancy |
| 27434 | POLM | LZE4T | Human | Esophagus | ESCC | 3.00e-04 | 9.52e-02 | 0.0811 |
| 27434 | POLM | LZE5T | Human | Esophagus | ESCC | 2.91e-03 | 1.97e-01 | 0.0514 |
| 27434 | POLM | LZE8T | Human | Esophagus | ESCC | 7.58e-06 | 1.53e-01 | 0.067 |
| 27434 | POLM | LZE20T | Human | Esophagus | ESCC | 1.07e-02 | 1.05e-01 | 0.0662 |
| 27434 | POLM | LZE22D1 | Human | Esophagus | HGIN | 4.32e-04 | 1.94e-01 | 0.0595 |
| 27434 | POLM | LZE22T | Human | Esophagus | ESCC | 6.45e-04 | 2.55e-01 | 0.068 |
| 27434 | POLM | LZE24T | Human | Esophagus | ESCC | 7.46e-11 | 2.47e-01 | 0.0596 |
| 27434 | POLM | LZE6T | Human | Esophagus | ESCC | 4.52e-02 | 1.78e-01 | 0.0845 |
| 27434 | POLM | P1T-E | Human | Esophagus | ESCC | 2.06e-15 | 5.30e-01 | 0.0875 |
| 27434 | POLM | P2T-E | Human | Esophagus | ESCC | 3.41e-16 | 2.71e-01 | 0.1177 |
| 27434 | POLM | P4T-E | Human | Esophagus | ESCC | 8.12e-09 | 2.16e-01 | 0.1323 |
| 27434 | POLM | P5T-E | Human | Esophagus | ESCC | 7.17e-07 | 1.11e-01 | 0.1327 |
| 27434 | POLM | P8T-E | Human | Esophagus | ESCC | 1.40e-11 | 1.54e-01 | 0.0889 |
| 27434 | POLM | P9T-E | Human | Esophagus | ESCC | 9.24e-14 | 2.21e-01 | 0.1131 |
| 27434 | POLM | P10T-E | Human | Esophagus | ESCC | 1.71e-22 | 3.04e-01 | 0.116 |
| 27434 | POLM | P11T-E | Human | Esophagus | ESCC | 9.86e-10 | 2.69e-01 | 0.1426 |
| 27434 | POLM | P12T-E | Human | Esophagus | ESCC | 3.39e-16 | 2.71e-01 | 0.1122 |
| 27434 | POLM | P15T-E | Human | Esophagus | ESCC | 1.86e-16 | 3.31e-01 | 0.1149 |
| 27434 | POLM | P16T-E | Human | Esophagus | ESCC | 4.11e-22 | 3.80e-01 | 0.1153 |
| 27434 | POLM | P20T-E | Human | Esophagus | ESCC | 5.70e-16 | 4.12e-01 | 0.1124 |
| Page: 1 2 3 4 |
| Tissue | Expression Dynamics | Abbreviation |
| Esophagus | 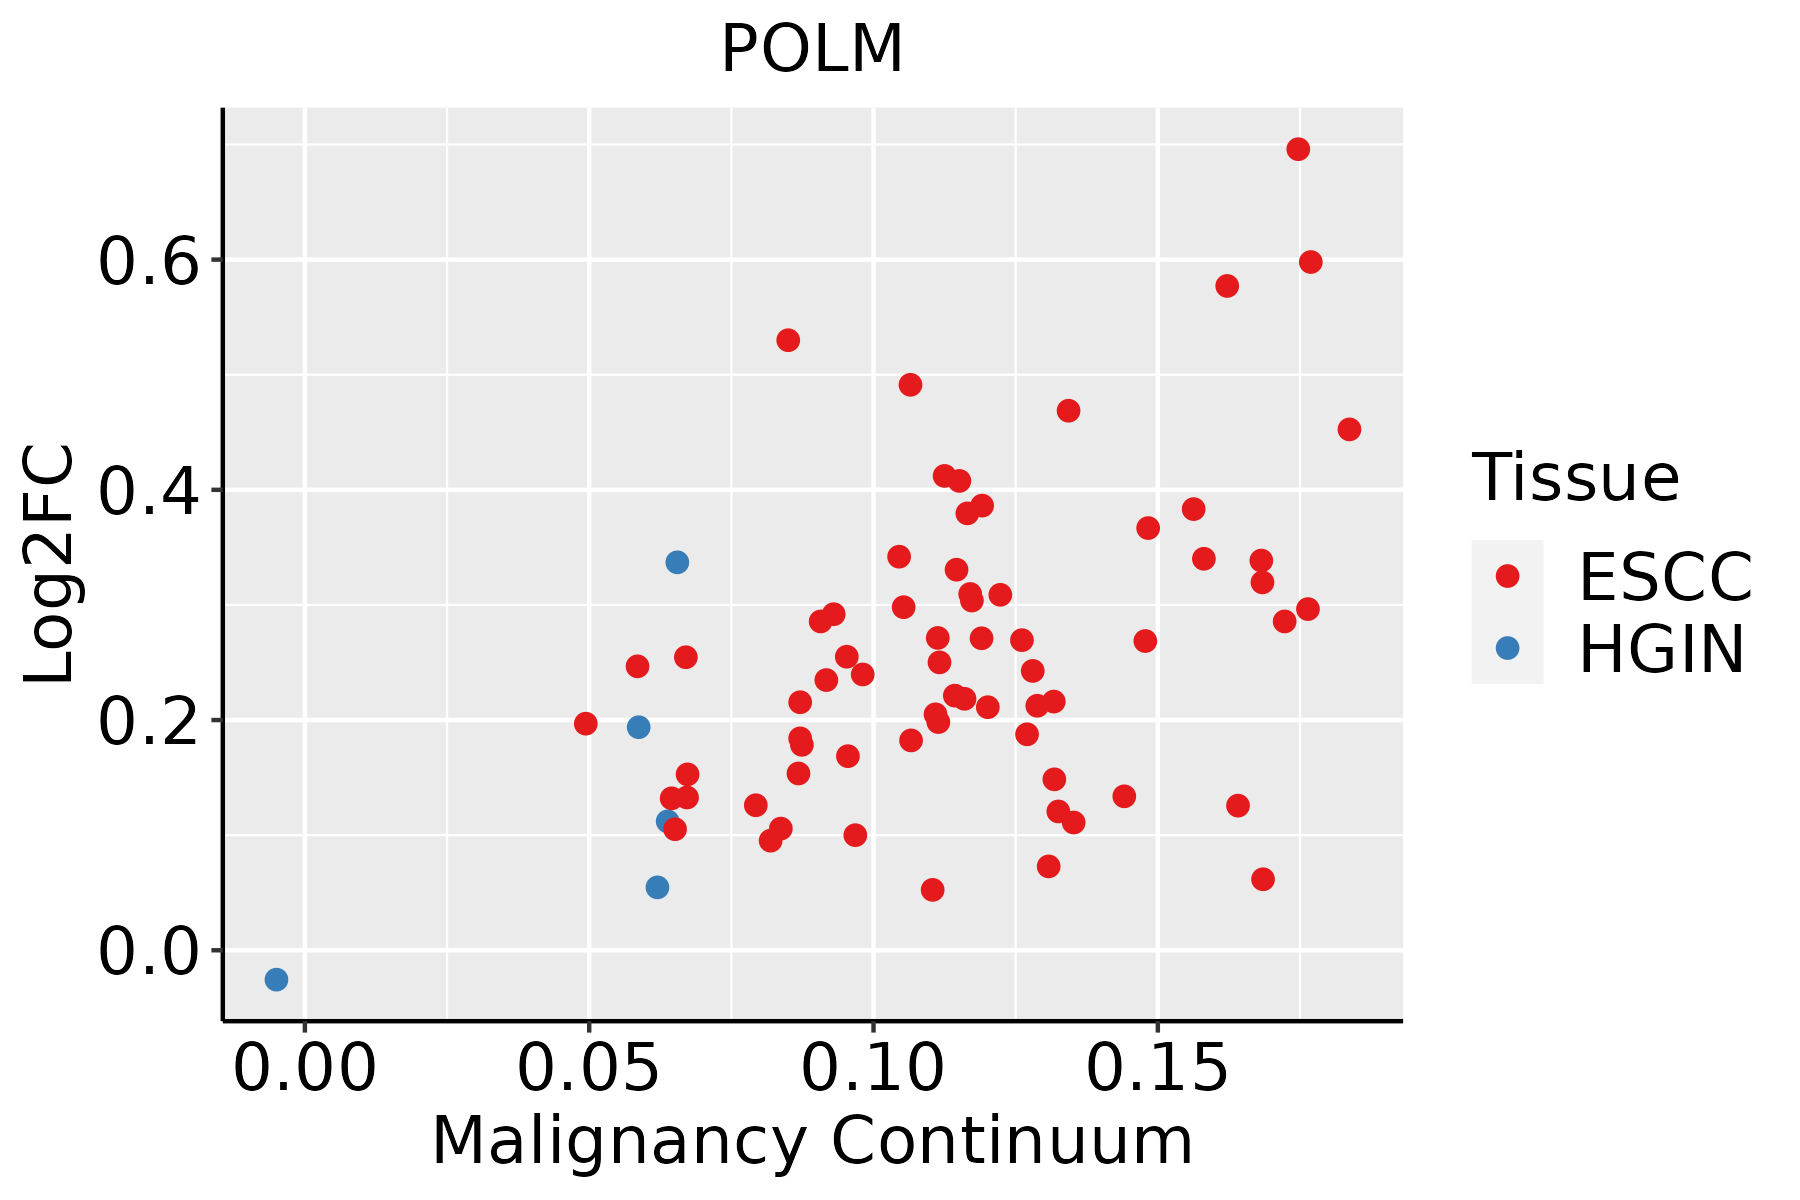 | ESCC: Esophageal squamous cell carcinoma |
| HGIN: High-grade intraepithelial neoplasias | ||
| LGIN: Low-grade intraepithelial neoplasias | ||
| Oral Cavity | 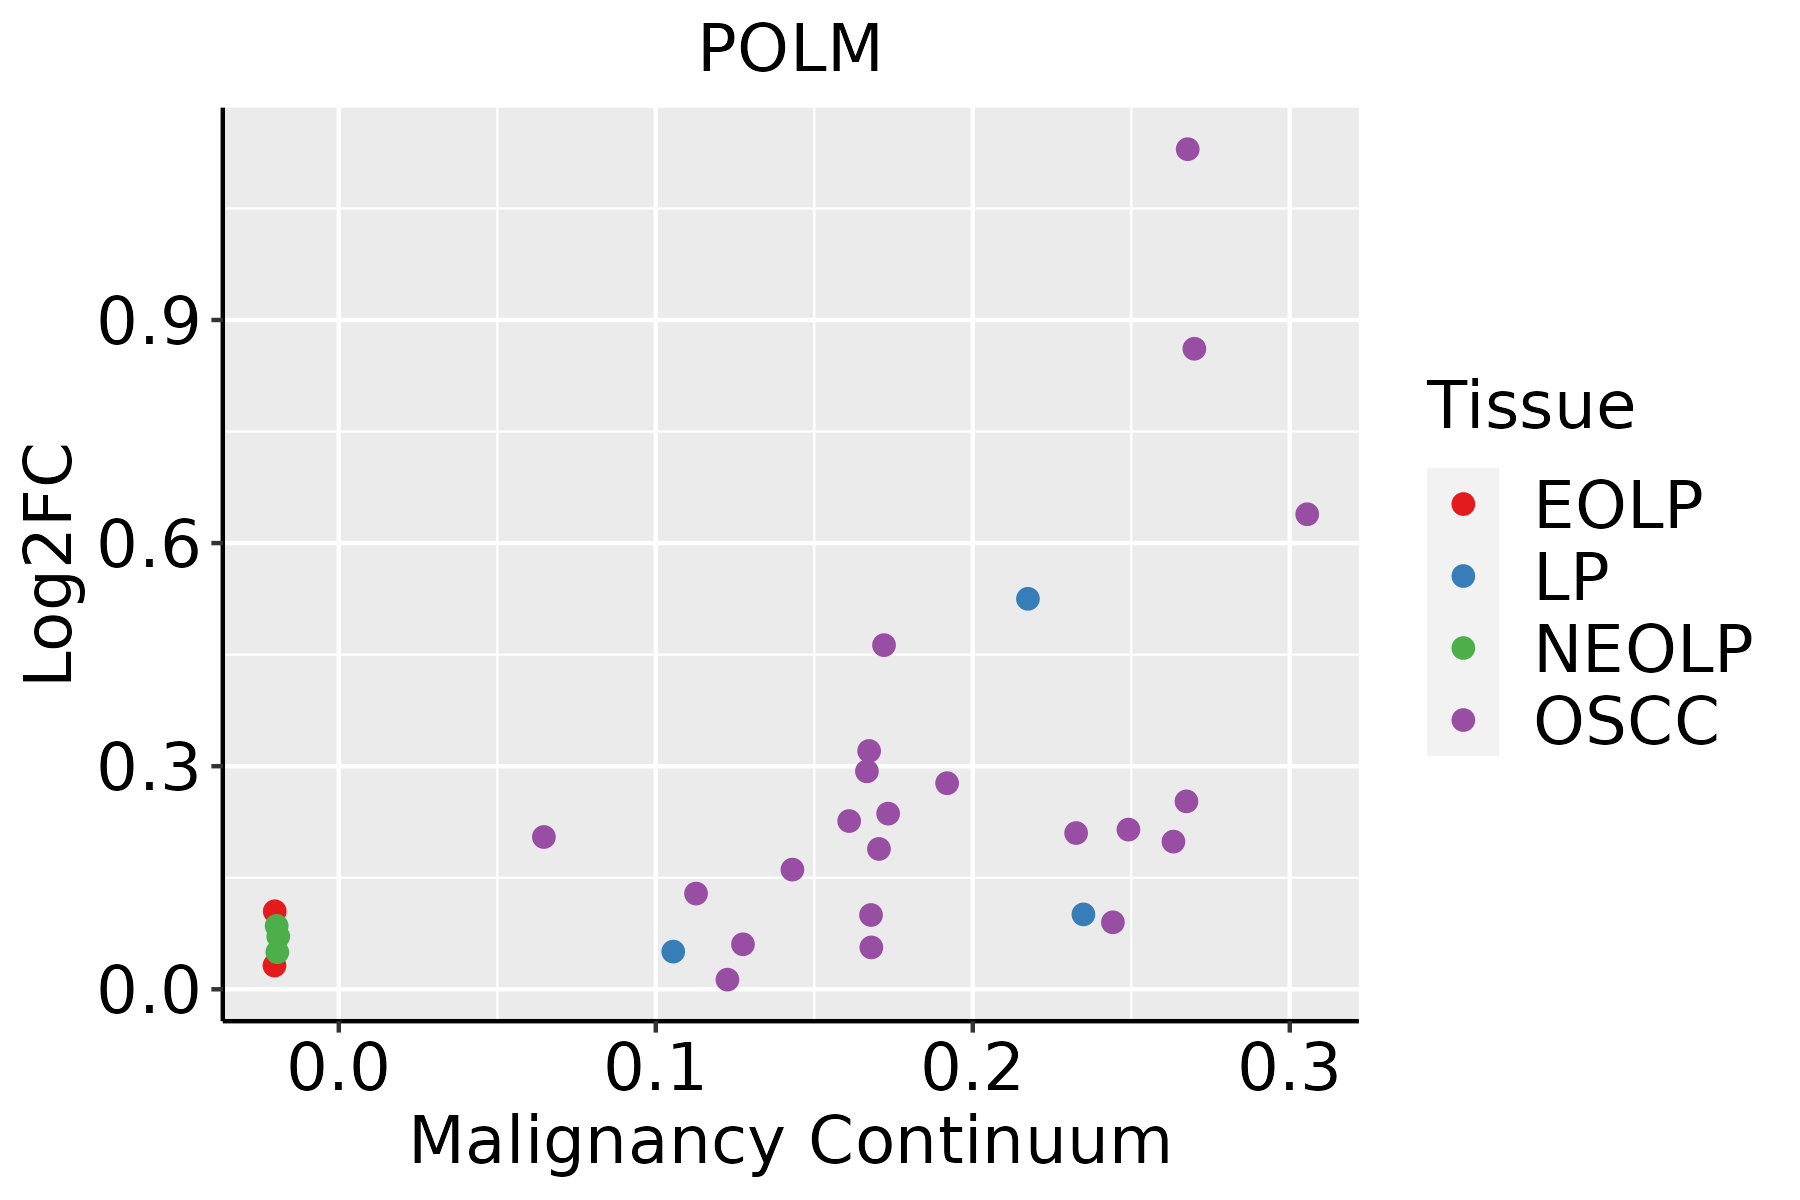 | EOLP: Erosive Oral lichen planus |
| LP: leukoplakia | ||
| NEOLP: Non-erosive oral lichen planus | ||
| OSCC: Oral squamous cell carcinoma |
| ∗log2FC in expression of this searched gene in stem-like cells from each diseased tissue sample relative to stem-like cells in normal samples in each tissue plotted against the malignancy continuum. Samples are colored based on if they are from different disease stage. |
Top |
Malignant transformation related pathway analysis |
| Find out the enriched GO biological processes and KEGG pathways involved in transition from healthy to precancer to cancer |
| Tissue | Disease Stage | Enriched GO biological Processes |
| Colorectum | AD |  |
| Colorectum | SER |  |
| Colorectum | MSS |  |
| Colorectum | MSI-H |  |
| Colorectum | FAP |  |
| ∗Top 15 enriched GO BP terms are showed in the bar plot of each disease state in each tissue. Each row represents a significant GO biological process which is colored according to the -log10(p.adjust). |
| Page: 1 2 3 4 5 6 7 8 9 |
| GO ID | Tissue | Disease Stage | Description | Gene Ratio | Bg Ratio | pvalue | p.adjust | Count |
| GO:007189710 | Esophagus | HGIN | DNA biosynthetic process | 44/2587 | 180/18723 | 8.97e-05 | 1.96e-03 | 44 |
| GO:007189716 | Esophagus | ESCC | DNA biosynthetic process | 127/8552 | 180/18723 | 1.04e-11 | 3.85e-10 | 127 |
| GO:00063024 | Esophagus | ESCC | double-strand break repair | 152/8552 | 251/18723 | 1.33e-06 | 1.62e-05 | 152 |
| GO:00063101 | Esophagus | ESCC | DNA recombination | 168/8552 | 305/18723 | 5.58e-04 | 3.05e-03 | 168 |
| GO:0006303 | Esophagus | ESCC | double-strand break repair via nonhomologous end joining | 43/8552 | 66/18723 | 1.10e-03 | 5.53e-03 | 43 |
| GO:00718979 | Oral cavity | OSCC | DNA biosynthetic process | 106/7305 | 180/18723 | 4.86e-08 | 8.95e-07 | 106 |
| GO:00063023 | Oral cavity | OSCC | double-strand break repair | 132/7305 | 251/18723 | 7.93e-06 | 8.52e-05 | 132 |
| GO:0006310 | Oral cavity | OSCC | DNA recombination | 147/7305 | 305/18723 | 6.33e-04 | 3.56e-03 | 147 |
| Page: 1 |
| Pathway ID | Tissue | Disease Stage | Description | Gene Ratio | Bg Ratio | pvalue | p.adjust | qvalue | Count |
| Page: 1 |
Top |
Cell-cell communication analysis |
| Identification of potential cell-cell interactions between two cell types and their ligand-receptor pairs for different disease states |
| Ligand | Receptor | LRpair | Pathway | Tissue | Disease Stage |
| Page: 1 |
Top |
Single-cell gene regulatory network inference analysis |
| Find out the significant the regulons (TFs) and the target genes of each regulon across cell types for different disease states |
| TF | Cell Type | Tissue | Disease Stage | Target Gene | RSS | Regulon Activity |
| ∗The dot plots of a searched regulon are shown for all cell subpopulations in each disease state of each tissue based on the regulon specific score inferred using pySCENIC and by calculating the average expression. |
| Page: 1 |
Top |
Somatic mutation of malignant transformation related genes |
| Annotation of somatic variants for genes involved in malignant transformation |
| Hugo Symbol | Variant Class | Variant Classification | dbSNP RS | HGVSc | HGVSp | HGVSp Short | SWISSPROT | BIOTYPE | SIFT | PolyPhen | Tumor Sample Barcode | Tissue | Histology | Sex | Age | Stage | Therapy Types | Drugs | Outcome |
| POLM | SNV | Missense_Mutation | novel | c.164N>C | p.Gly55Ala | p.G55A | Q9NP87 | protein_coding | deleterious(0.02) | probably_damaging(0.999) | TCGA-A7-A4SA-01 | Breast | breast invasive carcinoma | Female | <65 | I/II | Chemotherapy | doxorubicin | CR |
| POLM | SNV | Missense_Mutation | novel | c.1196N>T | p.Ser399Phe | p.S399F | Q9NP87 | protein_coding | deleterious_low_confidence(0) | benign(0.169) | TCGA-AC-A23H-01 | Breast | breast invasive carcinoma | Female | >=65 | I/II | Unknown | Unknown | PD |
| POLM | SNV | Missense_Mutation | rs766237933 | c.493N>A | p.Glu165Lys | p.E165K | Q9NP87 | protein_coding | tolerated(0.16) | probably_damaging(0.998) | TCGA-AC-A23H-01 | Breast | breast invasive carcinoma | Female | >=65 | I/II | Unknown | Unknown | PD |
| POLM | SNV | Missense_Mutation | c.1297G>A | p.Glu433Lys | p.E433K | Q9NP87 | protein_coding | deleterious_low_confidence(0) | benign(0.297) | TCGA-IR-A3LA-01 | Cervix | cervical & endocervical cancer | Female | <65 | I/II | Chemotherapy | cisplatin | CR | |
| POLM | SNV | Missense_Mutation | rs757549738 | c.1160G>A | p.Gly387Glu | p.G387E | Q9NP87 | protein_coding | tolerated(0.08) | benign(0.347) | TCGA-IR-A3LA-01 | Cervix | cervical & endocervical cancer | Female | <65 | I/II | Chemotherapy | cisplatin | CR |
| POLM | SNV | Missense_Mutation | novel | c.1007N>T | p.Arg336Ile | p.R336I | Q9NP87 | protein_coding | deleterious(0) | probably_damaging(0.988) | TCGA-VS-A8QH-01 | Cervix | cervical & endocervical cancer | Female | >=65 | I/II | Chemotherapy | gemcitabine | PD |
| POLM | SNV | Missense_Mutation | novel | c.361C>T | p.His121Tyr | p.H121Y | Q9NP87 | protein_coding | tolerated(0.08) | possibly_damaging(0.629) | TCGA-AA-3492-01 | Colorectum | colon adenocarcinoma | Female | >=65 | I/II | Unknown | Unknown | SD |
| POLM | SNV | Missense_Mutation | novel | c.841N>A | p.Leu281Met | p.L281M | Q9NP87 | protein_coding | deleterious(0.01) | probably_damaging(0.998) | TCGA-AA-3663-01 | Colorectum | colon adenocarcinoma | Male | <65 | I/II | Unknown | Unknown | SD |
| POLM | SNV | Missense_Mutation | c.986N>A | p.Cys329Tyr | p.C329Y | Q9NP87 | protein_coding | deleterious(0.02) | possibly_damaging(0.519) | TCGA-AA-3672-01 | Colorectum | colon adenocarcinoma | Female | >=65 | III/IV | Unknown | Unknown | SD | |
| POLM | deletion | Frame_Shift_Del | rs770109474 | c.290delN | p.Pro97GlnfsTer6 | p.P97Qfs*6 | Q9NP87 | protein_coding | TCGA-AZ-4313-01 | Colorectum | colon adenocarcinoma | Female | <65 | I/II | Unknown | Unknown | SD |
| Page: 1 2 3 4 5 6 7 |
Top |
Related drugs of malignant transformation related genes |
| Identification of chemicals and drugs interact with genes involved in malignant transfromation |
| (DGIdb 4.0) |
| Entrez ID | Symbol | Category | Interaction Types | Drug Claim Name | Drug Name | PMIDs |
| Page: 1 |

Copyright 2023-Present -The University of Texas Health Science Center at Houston |