
|
|||||
|
 | |
| |
| |
| |
| |
| |
|
Gene: POLL |
Gene summary for POLL |
| Gene information | Species | Human | Gene symbol | POLL | Gene ID | 27343 |
| Gene name | DNA polymerase lambda | |
| Gene Alias | BETAN | |
| Cytomap | 10q24.32 | |
| Gene Type | protein-coding | GO ID | GO:0000724 | UniProtAcc | Q9UGP5 |
Top |
Malignant transformation analysis |
| Identification of the aberrant gene expression in precancerous and cancerous lesions by comparing the gene expression of stem-like cells in diseased tissues with normal stem cells |
| Entrez ID | Symbol | Replicates | Species | Organ | Tissue | Adj P-value | Log2FC | Malignancy |
| 27343 | POLL | LZE4T | Human | Esophagus | ESCC | 2.25e-05 | 1.33e-01 | 0.0811 |
| 27343 | POLL | LZE8T | Human | Esophagus | ESCC | 1.73e-02 | 1.28e-01 | 0.067 |
| 27343 | POLL | LZE20T | Human | Esophagus | ESCC | 9.40e-04 | 9.12e-02 | 0.0662 |
| 27343 | POLL | LZE24T | Human | Esophagus | ESCC | 3.17e-07 | 2.84e-01 | 0.0596 |
| 27343 | POLL | LZE6T | Human | Esophagus | ESCC | 7.05e-04 | 1.32e-01 | 0.0845 |
| 27343 | POLL | P1T-E | Human | Esophagus | ESCC | 6.12e-03 | 1.26e-01 | 0.0875 |
| 27343 | POLL | P2T-E | Human | Esophagus | ESCC | 4.94e-13 | 2.81e-01 | 0.1177 |
| 27343 | POLL | P4T-E | Human | Esophagus | ESCC | 6.35e-14 | 2.94e-01 | 0.1323 |
| 27343 | POLL | P5T-E | Human | Esophagus | ESCC | 2.03e-16 | 2.10e-01 | 0.1327 |
| 27343 | POLL | P8T-E | Human | Esophagus | ESCC | 7.09e-06 | 1.57e-01 | 0.0889 |
| 27343 | POLL | P9T-E | Human | Esophagus | ESCC | 4.33e-11 | 1.10e-01 | 0.1131 |
| 27343 | POLL | P10T-E | Human | Esophagus | ESCC | 3.31e-07 | 7.80e-02 | 0.116 |
| 27343 | POLL | P11T-E | Human | Esophagus | ESCC | 3.10e-05 | 2.69e-01 | 0.1426 |
| 27343 | POLL | P12T-E | Human | Esophagus | ESCC | 1.28e-14 | 2.36e-01 | 0.1122 |
| 27343 | POLL | P15T-E | Human | Esophagus | ESCC | 3.98e-10 | 2.39e-01 | 0.1149 |
| 27343 | POLL | P16T-E | Human | Esophagus | ESCC | 2.54e-21 | 2.87e-01 | 0.1153 |
| 27343 | POLL | P20T-E | Human | Esophagus | ESCC | 7.35e-13 | 2.11e-01 | 0.1124 |
| 27343 | POLL | P21T-E | Human | Esophagus | ESCC | 1.15e-09 | 1.43e-01 | 0.1617 |
| 27343 | POLL | P22T-E | Human | Esophagus | ESCC | 8.58e-07 | 1.30e-01 | 0.1236 |
| 27343 | POLL | P23T-E | Human | Esophagus | ESCC | 2.10e-24 | 4.04e-01 | 0.108 |
| Page: 1 2 3 4 |
| Tissue | Expression Dynamics | Abbreviation |
| Esophagus | 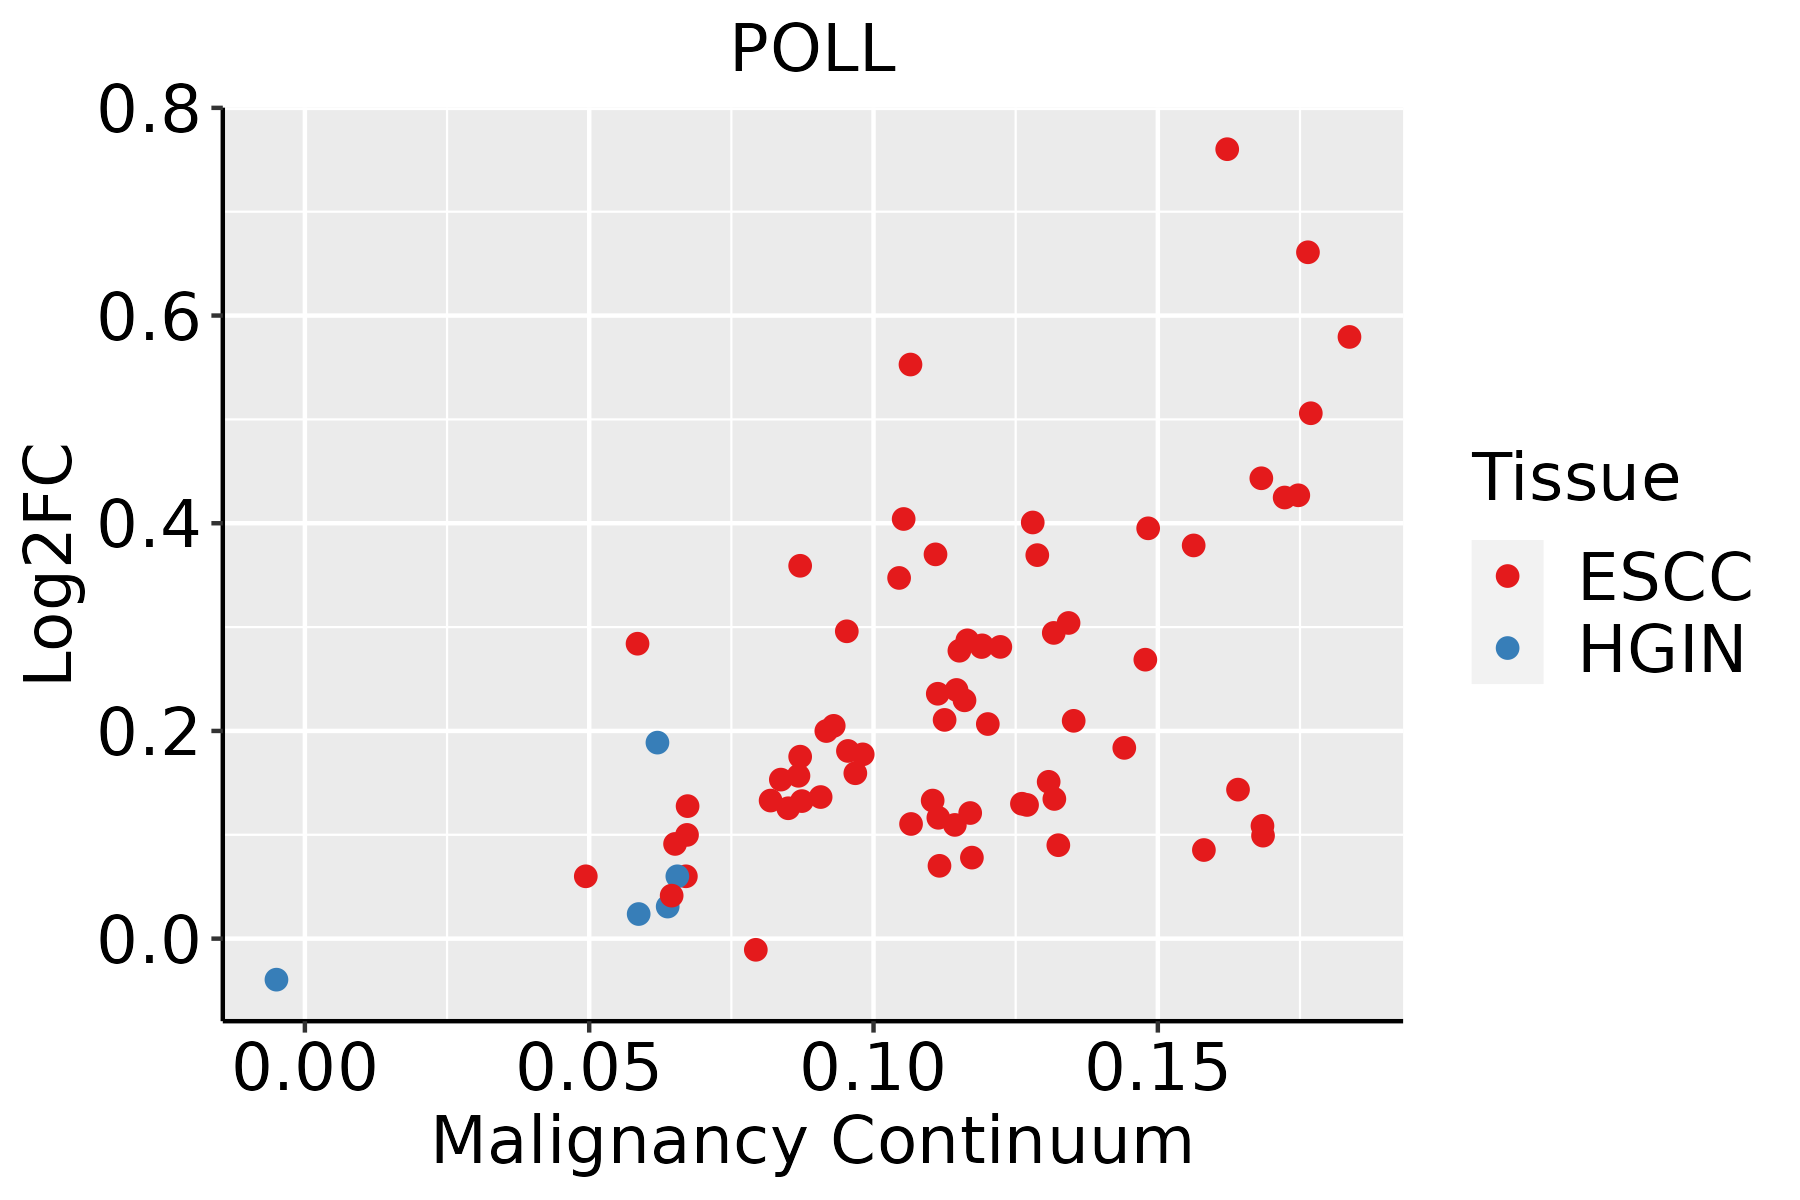 | ESCC: Esophageal squamous cell carcinoma |
| HGIN: High-grade intraepithelial neoplasias | ||
| LGIN: Low-grade intraepithelial neoplasias | ||
| Liver | 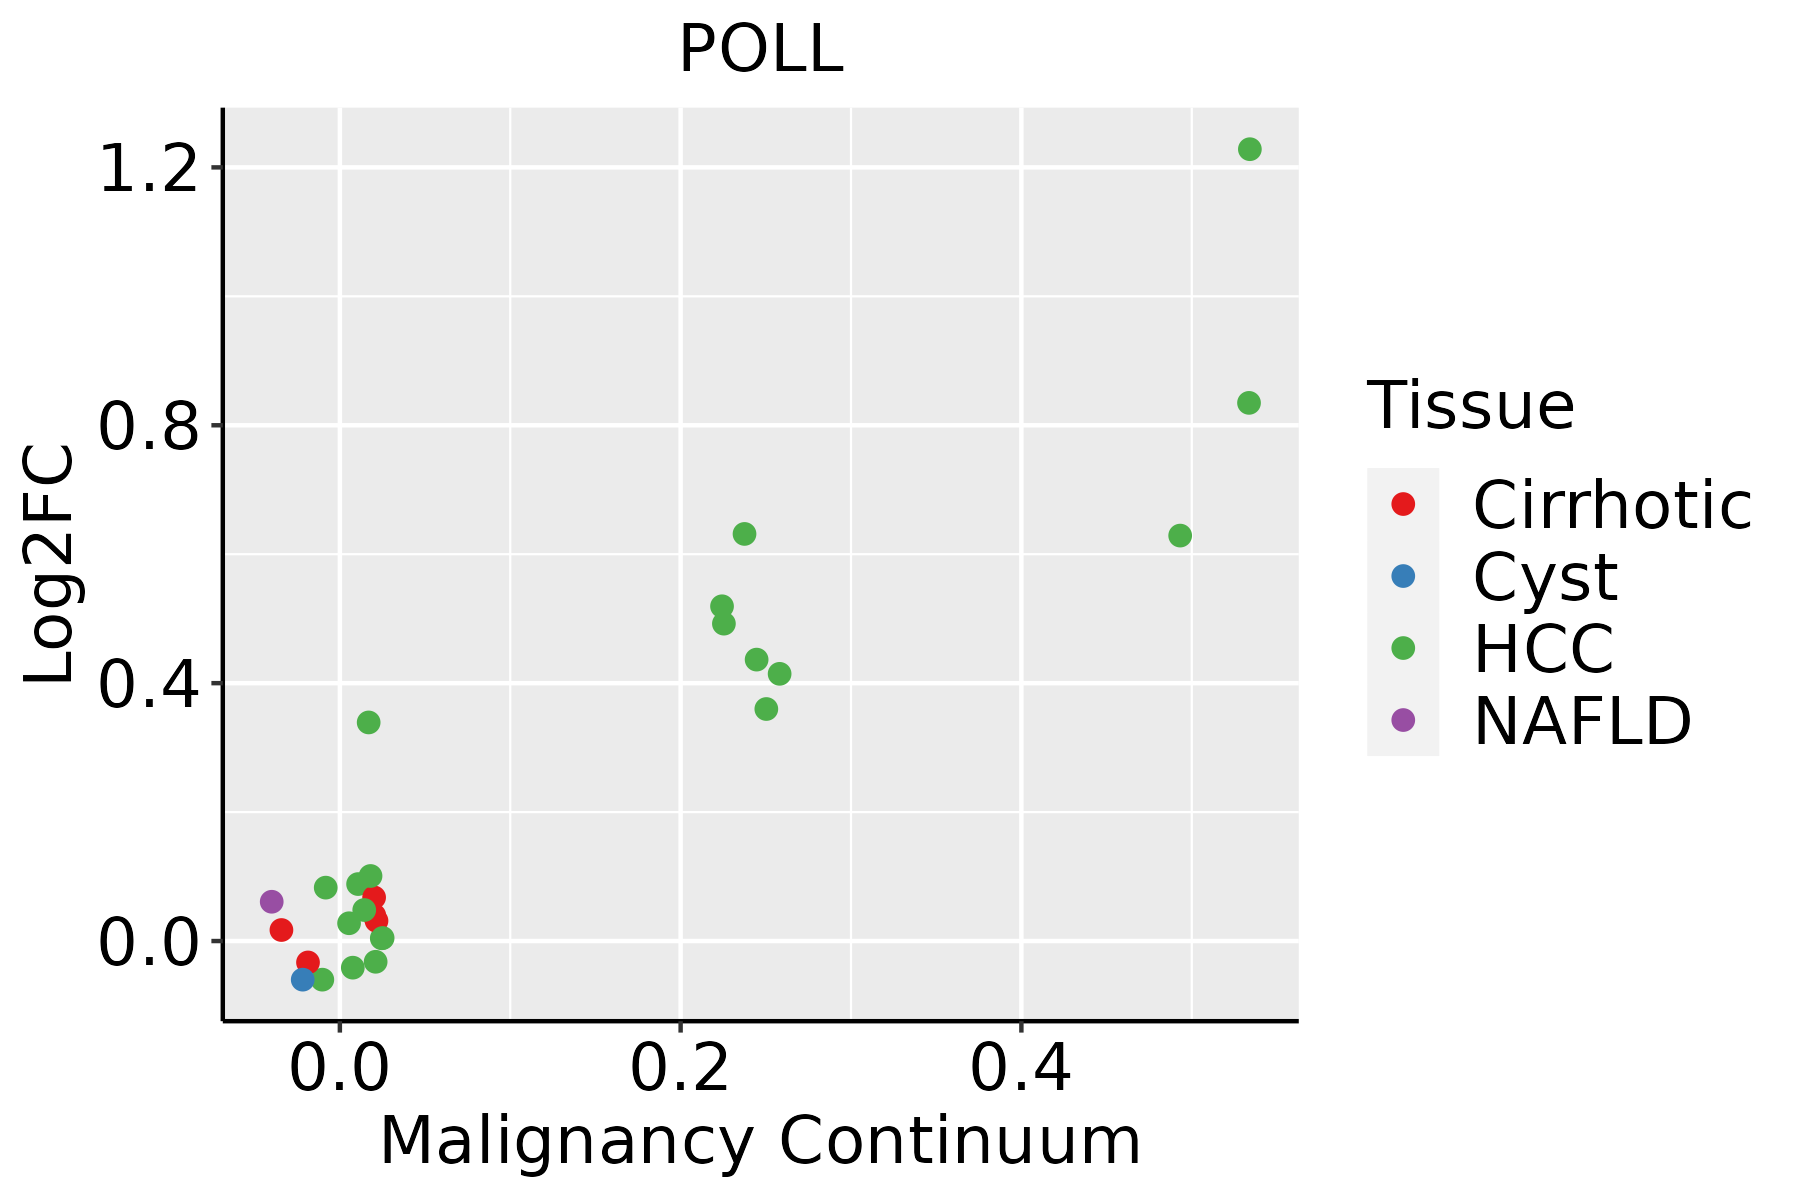 | HCC: Hepatocellular carcinoma |
| NAFLD: Non-alcoholic fatty liver disease | ||
| Oral Cavity | 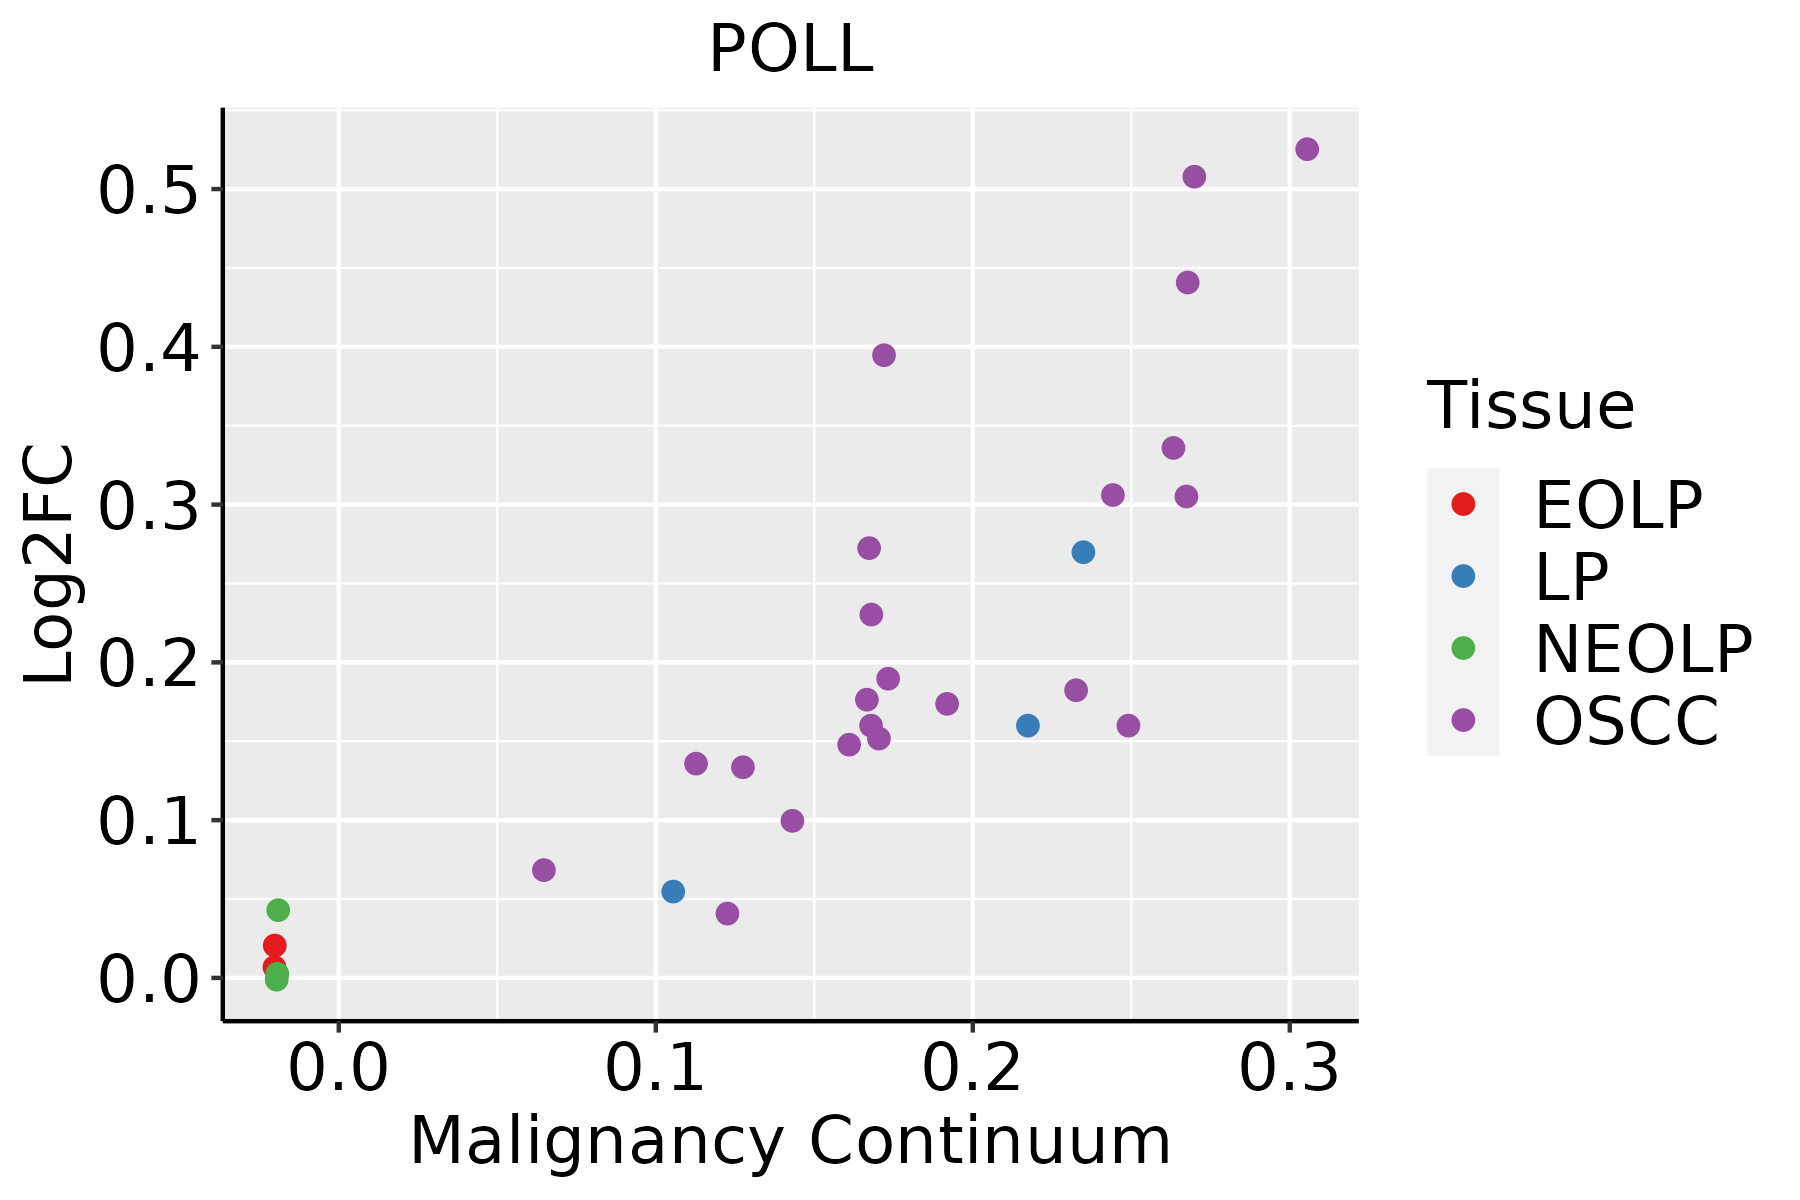 | EOLP: Erosive Oral lichen planus |
| LP: leukoplakia | ||
| NEOLP: Non-erosive oral lichen planus | ||
| OSCC: Oral squamous cell carcinoma |
| ∗log2FC in expression of this searched gene in stem-like cells from each diseased tissue sample relative to stem-like cells in normal samples in each tissue plotted against the malignancy continuum. Samples are colored based on if they are from different disease stage. |
Top |
Malignant transformation related pathway analysis |
| Find out the enriched GO biological processes and KEGG pathways involved in transition from healthy to precancer to cancer |
| Tissue | Disease Stage | Enriched GO biological Processes |
| Colorectum | AD |  |
| Colorectum | SER |  |
| Colorectum | MSS |  |
| Colorectum | MSI-H |  |
| Colorectum | FAP |  |
| ∗Top 15 enriched GO BP terms are showed in the bar plot of each disease state in each tissue. Each row represents a significant GO biological process which is colored according to the -log10(p.adjust). |
| Page: 1 2 3 4 5 6 7 8 9 |
| GO ID | Tissue | Disease Stage | Description | Gene Ratio | Bg Ratio | pvalue | p.adjust | Count |
| GO:00062604 | Esophagus | ESCC | DNA replication | 181/8552 | 260/18723 | 3.55e-15 | 2.05e-13 | 181 |
| GO:007189716 | Esophagus | ESCC | DNA biosynthetic process | 127/8552 | 180/18723 | 1.04e-11 | 3.85e-10 | 127 |
| GO:00063024 | Esophagus | ESCC | double-strand break repair | 152/8552 | 251/18723 | 1.33e-06 | 1.62e-05 | 152 |
| GO:00062843 | Esophagus | ESCC | base-excision repair | 33/8552 | 43/18723 | 3.25e-05 | 2.69e-04 | 33 |
| GO:00062891 | Esophagus | ESCC | nucleotide-excision repair | 42/8552 | 60/18723 | 1.18e-04 | 8.14e-04 | 42 |
| GO:00063101 | Esophagus | ESCC | DNA recombination | 168/8552 | 305/18723 | 5.58e-04 | 3.05e-03 | 168 |
| GO:0006303 | Esophagus | ESCC | double-strand break repair via nonhomologous end joining | 43/8552 | 66/18723 | 1.10e-03 | 5.53e-03 | 43 |
| GO:00022003 | Esophagus | ESCC | somatic diversification of immune receptors | 49/8552 | 77/18723 | 1.12e-03 | 5.60e-03 | 49 |
| GO:00164452 | Esophagus | ESCC | somatic diversification of immunoglobulins | 43/8552 | 67/18723 | 1.73e-03 | 7.97e-03 | 43 |
| GO:00007241 | Esophagus | ESCC | double-strand break repair via homologous recombination | 79/8552 | 138/18723 | 4.05e-03 | 1.62e-02 | 79 |
| GO:00007251 | Esophagus | ESCC | recombinational repair | 80/8552 | 140/18723 | 4.10e-03 | 1.63e-02 | 80 |
| GO:0006287 | Esophagus | ESCC | base-excision repair, gap-filling | 11/8552 | 14/18723 | 1.30e-02 | 4.27e-02 | 11 |
| GO:00062601 | Liver | HCC | DNA replication | 146/7958 | 260/18723 | 5.68e-06 | 7.02e-05 | 146 |
| GO:00718975 | Liver | HCC | DNA biosynthetic process | 99/7958 | 180/18723 | 4.66e-04 | 3.08e-03 | 99 |
| GO:00063021 | Liver | HCC | double-strand break repair | 131/7958 | 251/18723 | 1.17e-03 | 6.54e-03 | 131 |
| GO:0006284 | Liver | HCC | base-excision repair | 27/7958 | 43/18723 | 5.79e-03 | 2.40e-02 | 27 |
| GO:0002200 | Liver | HCC | somatic diversification of immune receptors | 44/7958 | 77/18723 | 6.70e-03 | 2.72e-02 | 44 |
| GO:0016445 | Liver | HCC | somatic diversification of immunoglobulins | 38/7958 | 67/18723 | 1.32e-02 | 4.73e-02 | 38 |
| GO:00062603 | Oral cavity | OSCC | DNA replication | 159/7305 | 260/18723 | 3.25e-13 | 1.59e-11 | 159 |
| GO:00718979 | Oral cavity | OSCC | DNA biosynthetic process | 106/7305 | 180/18723 | 4.86e-08 | 8.95e-07 | 106 |
| Page: 1 2 |
| Pathway ID | Tissue | Disease Stage | Description | Gene Ratio | Bg Ratio | pvalue | p.adjust | qvalue | Count |
| hsa034104 | Esophagus | ESCC | Base excision repair | 38/4205 | 44/8465 | 3.59e-07 | 2.62e-06 | 1.34e-06 | 38 |
| hsa0341011 | Esophagus | ESCC | Base excision repair | 38/4205 | 44/8465 | 3.59e-07 | 2.62e-06 | 1.34e-06 | 38 |
| hsa03410 | Oral cavity | OSCC | Base excision repair | 32/3704 | 44/8465 | 9.11e-05 | 3.25e-04 | 1.65e-04 | 32 |
| hsa034101 | Oral cavity | OSCC | Base excision repair | 32/3704 | 44/8465 | 9.11e-05 | 3.25e-04 | 1.65e-04 | 32 |
| Page: 1 |
Top |
Cell-cell communication analysis |
| Identification of potential cell-cell interactions between two cell types and their ligand-receptor pairs for different disease states |
| Ligand | Receptor | LRpair | Pathway | Tissue | Disease Stage |
| Page: 1 |
Top |
Single-cell gene regulatory network inference analysis |
| Find out the significant the regulons (TFs) and the target genes of each regulon across cell types for different disease states |
| TF | Cell Type | Tissue | Disease Stage | Target Gene | RSS | Regulon Activity |
| ∗The dot plots of a searched regulon are shown for all cell subpopulations in each disease state of each tissue based on the regulon specific score inferred using pySCENIC and by calculating the average expression. |
| Page: 1 |
Top |
Somatic mutation of malignant transformation related genes |
| Annotation of somatic variants for genes involved in malignant transformation |
| Hugo Symbol | Variant Class | Variant Classification | dbSNP RS | HGVSc | HGVSp | HGVSp Short | SWISSPROT | BIOTYPE | SIFT | PolyPhen | Tumor Sample Barcode | Tissue | Histology | Sex | Age | Stage | Therapy Types | Drugs | Outcome |
| POLL | SNV | Missense_Mutation | rs548269958 | c.149G>A | p.Arg50His | p.R50H | Q9UGP5 | protein_coding | deleterious(0.01) | benign(0.001) | TCGA-AA-3672-01 | Colorectum | colon adenocarcinoma | Female | >=65 | III/IV | Unknown | Unknown | SD |
| POLL | SNV | Missense_Mutation | rs373860780 | c.1463N>A | p.Arg488His | p.R488H | Q9UGP5 | protein_coding | deleterious(0) | probably_damaging(0.999) | TCGA-AD-6895-01 | Colorectum | colon adenocarcinoma | Male | >=65 | III/IV | Unknown | Unknown | SD |
| POLL | SNV | Missense_Mutation | rs548269958 | c.149G>A | p.Arg50His | p.R50H | Q9UGP5 | protein_coding | deleterious(0.01) | benign(0.001) | TCGA-F5-6811-01 | Colorectum | rectum adenocarcinoma | Female | >=65 | I/II | Unknown | Unknown | SD |
| POLL | SNV | Missense_Mutation | c.1291N>T | p.Leu431Phe | p.L431F | Q9UGP5 | protein_coding | deleterious(0) | probably_damaging(0.99) | TCGA-A5-A0GI-01 | Endometrium | uterine corpus endometrioid carcinoma | Female | <65 | I/II | Unknown | Unknown | SD | |
| POLL | SNV | Missense_Mutation | c.1543N>A | p.Ser515Thr | p.S515T | Q9UGP5 | protein_coding | deleterious(0) | benign(0.326) | TCGA-AP-A051-01 | Endometrium | uterine corpus endometrioid carcinoma | Female | >=65 | I/II | Unknown | Unknown | SD | |
| POLL | SNV | Missense_Mutation | c.1592N>T | p.Ala531Val | p.A531V | Q9UGP5 | protein_coding | deleterious(0) | benign(0.096) | TCGA-AP-A059-01 | Endometrium | uterine corpus endometrioid carcinoma | Female | >=65 | I/II | Unknown | Unknown | SD | |
| POLL | SNV | Missense_Mutation | c.235N>T | p.Gly79Cys | p.G79C | Q9UGP5 | protein_coding | tolerated(0.06) | benign(0.387) | TCGA-AP-A059-01 | Endometrium | uterine corpus endometrioid carcinoma | Female | >=65 | I/II | Unknown | Unknown | SD | |
| POLL | SNV | Missense_Mutation | novel | c.646A>T | p.Ser216Cys | p.S216C | Q9UGP5 | protein_coding | deleterious(0) | possibly_damaging(0.879) | TCGA-AP-A1DV-01 | Endometrium | uterine corpus endometrioid carcinoma | Female | <65 | I/II | Unknown | Unknown | SD |
| POLL | SNV | Missense_Mutation | rs757253356 | c.874N>T | p.Pro292Ser | p.P292S | Q9UGP5 | protein_coding | deleterious(0.01) | benign(0.359) | TCGA-AX-A1CE-01 | Endometrium | uterine corpus endometrioid carcinoma | Female | <65 | I/II | Unspecific | Paclitaxel | SD |
| POLL | SNV | Missense_Mutation | rs548269958 | c.149N>A | p.Arg50His | p.R50H | Q9UGP5 | protein_coding | deleterious(0.01) | benign(0.001) | TCGA-AX-A1CE-01 | Endometrium | uterine corpus endometrioid carcinoma | Female | <65 | I/II | Unspecific | Paclitaxel | SD |
| Page: 1 2 3 4 |
Top |
Related drugs of malignant transformation related genes |
| Identification of chemicals and drugs interact with genes involved in malignant transfromation |
| (DGIdb 4.0) |
| Entrez ID | Symbol | Category | Interaction Types | Drug Claim Name | Drug Name | PMIDs |
| 27343 | POLL | NA | 1-DEOXYRUBRALACTONE | CHEMBL260980 | 18178092 | |
| 27343 | POLL | NA | TALAROFLAVONE | TALAROFLAVONE | 18178092 | |
| 27343 | POLL | NA | HYMENOIC ACID | HYMENOIC ACID | 18364258 | |
| 27343 | POLL | NA | JUGLONE | JUGLONE | 21903399 |
| Page: 1 |

Copyright 2023-Present -The University of Texas Health Science Center at Houston |