
|
|||||
|
 | |
| |
| |
| |
| |
| |
|
Gene: POLK |
Gene summary for POLK |
| Gene information | Species | Human | Gene symbol | POLK | Gene ID | 51426 |
| Gene name | DNA polymerase kappa | |
| Gene Alias | DINB1 | |
| Cytomap | 5q13.3 | |
| Gene Type | protein-coding | GO ID | GO:0000731 | UniProtAcc | Q9UBT6 |
Top |
Malignant transformation analysis |
| Identification of the aberrant gene expression in precancerous and cancerous lesions by comparing the gene expression of stem-like cells in diseased tissues with normal stem cells |
| Entrez ID | Symbol | Replicates | Species | Organ | Tissue | Adj P-value | Log2FC | Malignancy |
| 51426 | POLK | LZE4T | Human | Esophagus | ESCC | 3.64e-14 | 3.37e-01 | 0.0811 |
| 51426 | POLK | LZE8T | Human | Esophagus | ESCC | 2.00e-05 | 2.13e-01 | 0.067 |
| 51426 | POLK | LZE24T | Human | Esophagus | ESCC | 1.05e-11 | 2.78e-01 | 0.0596 |
| 51426 | POLK | LZE6T | Human | Esophagus | ESCC | 8.60e-03 | 1.20e-01 | 0.0845 |
| 51426 | POLK | P2T-E | Human | Esophagus | ESCC | 9.73e-22 | 3.60e-01 | 0.1177 |
| 51426 | POLK | P4T-E | Human | Esophagus | ESCC | 8.80e-10 | 1.64e-01 | 0.1323 |
| 51426 | POLK | P5T-E | Human | Esophagus | ESCC | 1.73e-11 | 1.29e-01 | 0.1327 |
| 51426 | POLK | P8T-E | Human | Esophagus | ESCC | 2.44e-13 | 1.94e-01 | 0.0889 |
| 51426 | POLK | P9T-E | Human | Esophagus | ESCC | 2.32e-10 | 2.13e-01 | 0.1131 |
| 51426 | POLK | P10T-E | Human | Esophagus | ESCC | 1.43e-17 | 2.54e-01 | 0.116 |
| 51426 | POLK | P12T-E | Human | Esophagus | ESCC | 3.33e-17 | 2.72e-01 | 0.1122 |
| 51426 | POLK | P15T-E | Human | Esophagus | ESCC | 3.57e-21 | 3.43e-01 | 0.1149 |
| 51426 | POLK | P16T-E | Human | Esophagus | ESCC | 3.97e-11 | 1.60e-01 | 0.1153 |
| 51426 | POLK | P17T-E | Human | Esophagus | ESCC | 6.34e-03 | 2.17e-01 | 0.1278 |
| 51426 | POLK | P20T-E | Human | Esophagus | ESCC | 7.11e-14 | 3.49e-01 | 0.1124 |
| 51426 | POLK | P21T-E | Human | Esophagus | ESCC | 7.97e-15 | 2.54e-01 | 0.1617 |
| 51426 | POLK | P22T-E | Human | Esophagus | ESCC | 6.05e-21 | 3.05e-01 | 0.1236 |
| 51426 | POLK | P23T-E | Human | Esophagus | ESCC | 1.21e-03 | 1.26e-01 | 0.108 |
| 51426 | POLK | P24T-E | Human | Esophagus | ESCC | 9.67e-08 | 1.36e-01 | 0.1287 |
| 51426 | POLK | P26T-E | Human | Esophagus | ESCC | 1.66e-22 | 2.87e-01 | 0.1276 |
| Page: 1 2 3 4 5 |
| Tissue | Expression Dynamics | Abbreviation |
| Esophagus |  | ESCC: Esophageal squamous cell carcinoma |
| HGIN: High-grade intraepithelial neoplasias | ||
| LGIN: Low-grade intraepithelial neoplasias | ||
| Liver |  | HCC: Hepatocellular carcinoma |
| NAFLD: Non-alcoholic fatty liver disease | ||
| Skin | 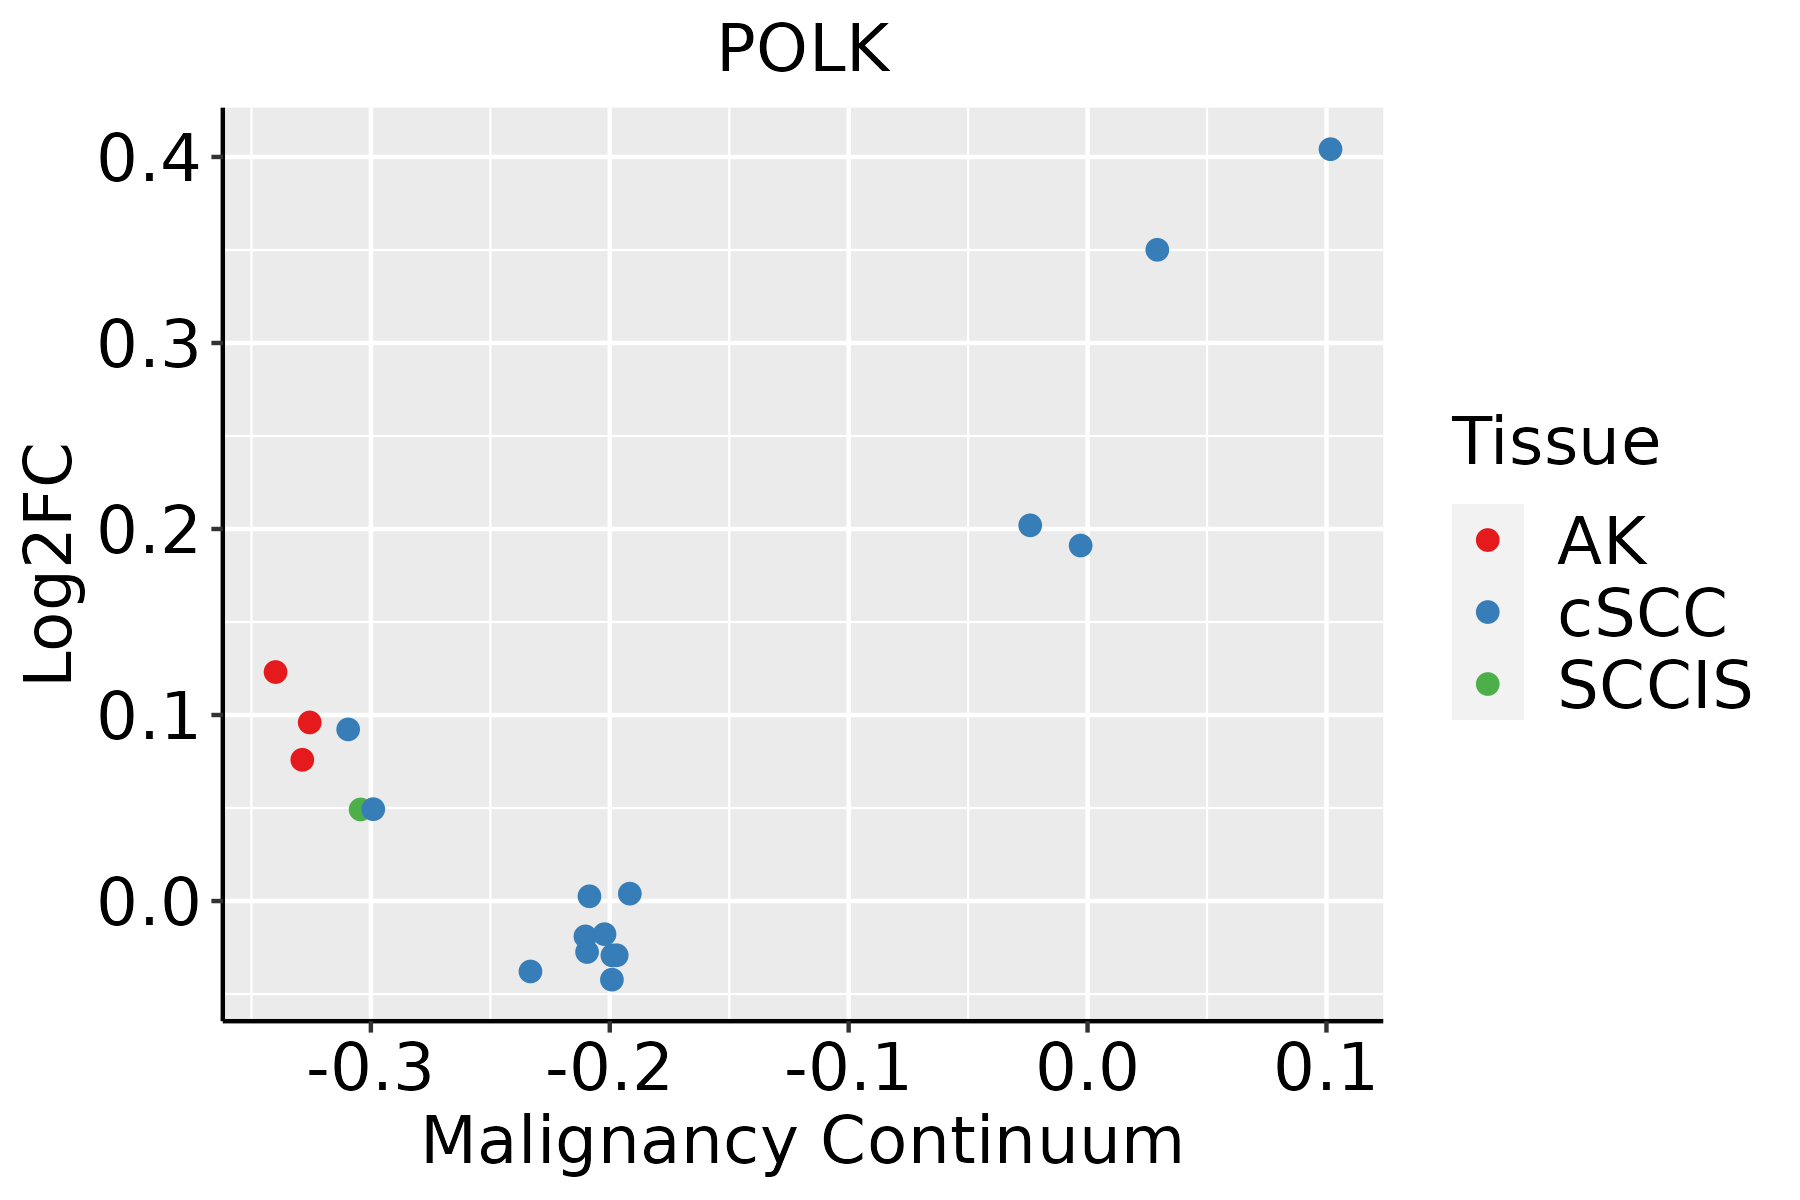 | AK: Actinic keratosis |
| cSCC: Cutaneous squamous cell carcinoma | ||
| SCCIS:squamous cell carcinoma in situ | ||
| Thyroid |  | ATC: Anaplastic thyroid cancer |
| HT: Hashimoto's thyroiditis | ||
| PTC: Papillary thyroid cancer |
| ∗log2FC in expression of this searched gene in stem-like cells from each diseased tissue sample relative to stem-like cells in normal samples in each tissue plotted against the malignancy continuum. Samples are colored based on if they are from different disease stage. |
Top |
Malignant transformation related pathway analysis |
| Find out the enriched GO biological processes and KEGG pathways involved in transition from healthy to precancer to cancer |
| Tissue | Disease Stage | Enriched GO biological Processes |
| Colorectum | AD |  |
| Colorectum | SER |  |
| Colorectum | MSS |  |
| Colorectum | MSI-H |  |
| Colorectum | FAP |  |
| ∗Top 15 enriched GO BP terms are showed in the bar plot of each disease state in each tissue. Each row represents a significant GO biological process which is colored according to the -log10(p.adjust). |
| Page: 1 2 3 4 5 6 7 8 9 |
| GO ID | Tissue | Disease Stage | Description | Gene Ratio | Bg Ratio | pvalue | p.adjust | Count |
| GO:000941113 | Esophagus | ESCC | response to UV | 115/8552 | 149/18723 | 3.29e-15 | 1.93e-13 | 115 |
| GO:00062604 | Esophagus | ESCC | DNA replication | 181/8552 | 260/18723 | 3.55e-15 | 2.05e-13 | 181 |
| GO:007189716 | Esophagus | ESCC | DNA biosynthetic process | 127/8552 | 180/18723 | 1.04e-11 | 3.85e-10 | 127 |
| GO:000931419 | Esophagus | ESCC | response to radiation | 277/8552 | 456/18723 | 4.42e-11 | 1.43e-09 | 277 |
| GO:003464413 | Esophagus | ESCC | cellular response to UV | 70/8552 | 90/18723 | 4.59e-10 | 1.20e-08 | 70 |
| GO:007121419 | Esophagus | ESCC | cellular response to abiotic stimulus | 206/8552 | 331/18723 | 7.52e-10 | 1.88e-08 | 206 |
| GO:010400419 | Esophagus | ESCC | cellular response to environmental stimulus | 206/8552 | 331/18723 | 7.52e-10 | 1.88e-08 | 206 |
| GO:007147816 | Esophagus | ESCC | cellular response to radiation | 122/8552 | 186/18723 | 3.07e-08 | 5.73e-07 | 122 |
| GO:00063012 | Esophagus | ESCC | postreplication repair | 26/8552 | 31/18723 | 1.32e-05 | 1.21e-04 | 26 |
| GO:000941611 | Esophagus | ESCC | response to light stimulus | 183/8552 | 320/18723 | 2.03e-05 | 1.76e-04 | 183 |
| GO:00062891 | Esophagus | ESCC | nucleotide-excision repair | 42/8552 | 60/18723 | 1.18e-04 | 8.14e-04 | 42 |
| GO:00714821 | Esophagus | ESCC | cellular response to light stimulus | 75/8552 | 123/18723 | 4.45e-04 | 2.50e-03 | 75 |
| GO:0019985 | Esophagus | ESCC | translesion synthesis | 17/8552 | 21/18723 | 1.03e-03 | 5.19e-03 | 17 |
| GO:00712145 | Liver | NAFLD | cellular response to abiotic stimulus | 56/1882 | 331/18723 | 7.01e-05 | 1.47e-03 | 56 |
| GO:01040045 | Liver | NAFLD | cellular response to environmental stimulus | 56/1882 | 331/18723 | 7.01e-05 | 1.47e-03 | 56 |
| GO:00714783 | Liver | NAFLD | cellular response to radiation | 33/1882 | 186/18723 | 8.76e-04 | 1.07e-02 | 33 |
| GO:007121421 | Liver | HCC | cellular response to abiotic stimulus | 183/7958 | 331/18723 | 1.59e-06 | 2.26e-05 | 183 |
| GO:010400421 | Liver | HCC | cellular response to environmental stimulus | 183/7958 | 331/18723 | 1.59e-06 | 2.26e-05 | 183 |
| GO:00062601 | Liver | HCC | DNA replication | 146/7958 | 260/18723 | 5.68e-06 | 7.02e-05 | 146 |
| GO:00346441 | Liver | HCC | cellular response to UV | 56/7958 | 90/18723 | 1.25e-04 | 1.03e-03 | 56 |
| Page: 1 2 3 |
| Pathway ID | Tissue | Disease Stage | Description | Gene Ratio | Bg Ratio | pvalue | p.adjust | qvalue | Count |
| hsa05169210 | Esophagus | ESCC | Epstein-Barr virus infection | 151/4205 | 202/8465 | 1.55e-13 | 3.45e-12 | 1.77e-12 | 151 |
| hsa0521020 | Esophagus | ESCC | Colorectal cancer | 69/4205 | 86/8465 | 4.06e-09 | 4.13e-08 | 2.11e-08 | 69 |
| hsa0521216 | Esophagus | ESCC | Pancreatic cancer | 62/4205 | 76/8465 | 7.37e-09 | 6.85e-08 | 3.51e-08 | 62 |
| hsa0522020 | Esophagus | ESCC | Chronic myeloid leukemia | 61/4205 | 76/8465 | 3.20e-08 | 2.68e-07 | 1.37e-07 | 61 |
| hsa052229 | Esophagus | ESCC | Small cell lung cancer | 69/4205 | 92/8465 | 5.40e-07 | 3.85e-06 | 1.97e-06 | 69 |
| hsa0521628 | Esophagus | ESCC | Thyroid cancer | 32/4205 | 37/8465 | 2.98e-06 | 1.72e-05 | 8.81e-06 | 32 |
| hsa0521320 | Esophagus | ESCC | Endometrial cancer | 45/4205 | 58/8465 | 1.14e-05 | 5.98e-05 | 3.06e-05 | 45 |
| hsa0522518 | Esophagus | ESCC | Hepatocellular carcinoma | 109/4205 | 168/8465 | 4.27e-05 | 1.88e-04 | 9.64e-05 | 109 |
| hsa0521417 | Esophagus | ESCC | Glioma | 52/4205 | 75/8465 | 4.20e-04 | 1.45e-03 | 7.43e-04 | 52 |
| hsa052028 | Esophagus | ESCC | Transcriptional misregulation in cancer | 116/4205 | 193/8465 | 2.08e-03 | 5.95e-03 | 3.05e-03 | 116 |
| hsa052237 | Esophagus | ESCC | Non-small cell lung cancer | 48/4205 | 72/8465 | 2.57e-03 | 7.05e-03 | 3.61e-03 | 48 |
| hsa0516937 | Esophagus | ESCC | Epstein-Barr virus infection | 151/4205 | 202/8465 | 1.55e-13 | 3.45e-12 | 1.77e-12 | 151 |
| hsa05210110 | Esophagus | ESCC | Colorectal cancer | 69/4205 | 86/8465 | 4.06e-09 | 4.13e-08 | 2.11e-08 | 69 |
| hsa0521217 | Esophagus | ESCC | Pancreatic cancer | 62/4205 | 76/8465 | 7.37e-09 | 6.85e-08 | 3.51e-08 | 62 |
| hsa05220110 | Esophagus | ESCC | Chronic myeloid leukemia | 61/4205 | 76/8465 | 3.20e-08 | 2.68e-07 | 1.37e-07 | 61 |
| hsa0522216 | Esophagus | ESCC | Small cell lung cancer | 69/4205 | 92/8465 | 5.40e-07 | 3.85e-06 | 1.97e-06 | 69 |
| hsa0521638 | Esophagus | ESCC | Thyroid cancer | 32/4205 | 37/8465 | 2.98e-06 | 1.72e-05 | 8.81e-06 | 32 |
| hsa05213110 | Esophagus | ESCC | Endometrial cancer | 45/4205 | 58/8465 | 1.14e-05 | 5.98e-05 | 3.06e-05 | 45 |
| hsa0522519 | Esophagus | ESCC | Hepatocellular carcinoma | 109/4205 | 168/8465 | 4.27e-05 | 1.88e-04 | 9.64e-05 | 109 |
| hsa0521418 | Esophagus | ESCC | Glioma | 52/4205 | 75/8465 | 4.20e-04 | 1.45e-03 | 7.43e-04 | 52 |
| Page: 1 2 3 |
Top |
Cell-cell communication analysis |
| Identification of potential cell-cell interactions between two cell types and their ligand-receptor pairs for different disease states |
| Ligand | Receptor | LRpair | Pathway | Tissue | Disease Stage |
| Page: 1 |
Top |
Single-cell gene regulatory network inference analysis |
| Find out the significant the regulons (TFs) and the target genes of each regulon across cell types for different disease states |
| TF | Cell Type | Tissue | Disease Stage | Target Gene | RSS | Regulon Activity |
| ∗The dot plots of a searched regulon are shown for all cell subpopulations in each disease state of each tissue based on the regulon specific score inferred using pySCENIC and by calculating the average expression. |
| Page: 1 |
Top |
Somatic mutation of malignant transformation related genes |
| Annotation of somatic variants for genes involved in malignant transformation |
| Hugo Symbol | Variant Class | Variant Classification | dbSNP RS | HGVSc | HGVSp | HGVSp Short | SWISSPROT | BIOTYPE | SIFT | PolyPhen | Tumor Sample Barcode | Tissue | Histology | Sex | Age | Stage | Therapy Types | Drugs | Outcome |
| POLK | SNV | Missense_Mutation | novel | c.1828N>G | p.Leu610Val | p.L610V | Q9UBT6 | protein_coding | tolerated(0.33) | benign(0.001) | TCGA-AN-A046-01 | Breast | breast invasive carcinoma | Female | >=65 | I/II | Unknown | Unknown | SD |
| POLK | SNV | Missense_Mutation | rs759513397 | c.2080N>C | p.Glu694Gln | p.E694Q | Q9UBT6 | protein_coding | tolerated(0.37) | benign(0.28) | TCGA-AR-A0U0-01 | Breast | breast invasive carcinoma | Female | >=65 | I/II | Unknown | Unknown | SD |
| POLK | SNV | Missense_Mutation | novel | c.2081N>C | p.Glu694Ala | p.E694A | Q9UBT6 | protein_coding | tolerated(0.1) | benign(0.114) | TCGA-AR-A0U0-01 | Breast | breast invasive carcinoma | Female | >=65 | I/II | Unknown | Unknown | SD |
| POLK | SNV | Missense_Mutation | c.304A>G | p.Thr102Ala | p.T102A | Q9UBT6 | protein_coding | deleterious(0.03) | benign(0.241) | TCGA-BH-A18G-01 | Breast | breast invasive carcinoma | Female | >=65 | I/II | Unknown | Unknown | SD | |
| POLK | SNV | Missense_Mutation | novel | c.760G>A | p.Glu254Lys | p.E254K | Q9UBT6 | protein_coding | deleterious(0) | possibly_damaging(0.825) | TCGA-LL-A9Q3-01 | Breast | breast invasive carcinoma | Female | >=65 | III/IV | Immunotherapy | herceptin | CR |
| POLK | insertion | Frame_Shift_Ins | novel | c.466_467insATATTAGG | p.Ile156AsnfsTer13 | p.I156Nfs*13 | Q9UBT6 | protein_coding | TCGA-AR-A0U0-01 | Breast | breast invasive carcinoma | Female | >=65 | I/II | Unknown | Unknown | SD | ||
| POLK | SNV | Missense_Mutation | c.1249A>T | p.Ser417Cys | p.S417C | Q9UBT6 | protein_coding | deleterious(0) | probably_damaging(0.999) | TCGA-A6-A565-01 | Colorectum | colon adenocarcinoma | Female | <65 | III/IV | Unspecific | 5FU | PD | |
| POLK | SNV | Missense_Mutation | c.287G>T | p.Ser96Ile | p.S96I | Q9UBT6 | protein_coding | deleterious(0.02) | possibly_damaging(0.729) | TCGA-AA-3864-01 | Colorectum | colon adenocarcinoma | Male | >=65 | I/II | Unknown | Unknown | SD | |
| POLK | SNV | Missense_Mutation | c.2490N>A | p.Ser830Arg | p.S830R | Q9UBT6 | protein_coding | tolerated(0.57) | benign(0.003) | TCGA-AA-A010-01 | Colorectum | colon adenocarcinoma | Female | <65 | I/II | Chemotherapy | folinic | CR | |
| POLK | SNV | Missense_Mutation | c.1226N>T | p.Arg409Met | p.R409M | Q9UBT6 | protein_coding | deleterious(0) | probably_damaging(0.983) | TCGA-AM-5821-01 | Colorectum | colon adenocarcinoma | Female | >=65 | I/II | Unknown | Unknown | SD |
| Page: 1 2 3 4 5 6 7 8 |
Top |
Related drugs of malignant transformation related genes |
| Identification of chemicals and drugs interact with genes involved in malignant transfromation |
| (DGIdb 4.0) |
| Entrez ID | Symbol | Category | Interaction Types | Drug Claim Name | Drug Name | PMIDs |
| 51426 | POLK | DNA REPAIR, ENZYME | RESVERATROL | RESVERATROL | ||
| 51426 | POLK | DNA REPAIR, ENZYME | IODOPHTHALEIN | IODOPHTHALEIN | ||
| 51426 | POLK | DNA REPAIR, ENZYME | CARMINE | CARMINE | ||
| 51426 | POLK | DNA REPAIR, ENZYME | PYROGALLOL RED | PYROGALLOL RED | ||
| 51426 | POLK | DNA REPAIR, ENZYME | AG-99 | CHEMBL296407 | ||
| 51426 | POLK | DNA REPAIR, ENZYME | TETROQUINONE | TETROQUINONE | ||
| 51426 | POLK | DNA REPAIR, ENZYME | TRYPAN BLUE | TRYPAN BLUE | ||
| 51426 | POLK | DNA REPAIR, ENZYME | MAREIN | MAREIN | ||
| 51426 | POLK | DNA REPAIR, ENZYME | 3,8'-BIAPIGENIN | CHEMBL515252 | ||
| 51426 | POLK | DNA REPAIR, ENZYME | RACEPINEPHRINE | RACEPINEPHRINE |
| Page: 1 2 3 4 5 6 7 8 9 10 11 12 13 14 15 16 17 18 19 20 21 22 23 24 25 26 27 |

Copyright 2023-Present -The University of Texas Health Science Center at Houston |