
|
|||||
|
 | |
| |
| |
| |
| |
| |
|
Gene: POLH |
Gene summary for POLH |
| Gene information | Species | Human | Gene symbol | POLH | Gene ID | 5429 |
| Gene name | DNA polymerase eta | |
| Gene Alias | RAD30 | |
| Cytomap | 6p21.1 | |
| Gene Type | protein-coding | GO ID | GO:0000731 | UniProtAcc | B3KN75 |
Top |
Malignant transformation analysis |
| Identification of the aberrant gene expression in precancerous and cancerous lesions by comparing the gene expression of stem-like cells in diseased tissues with normal stem cells |
| Entrez ID | Symbol | Replicates | Species | Organ | Tissue | Adj P-value | Log2FC | Malignancy |
| 5429 | POLH | HCC1_Meng | Human | Liver | HCC | 1.11e-05 | -4.93e-03 | 0.0246 |
| 5429 | POLH | HCC1 | Human | Liver | HCC | 1.23e-25 | 3.25e+00 | 0.5336 |
| 5429 | POLH | HCC2 | Human | Liver | HCC | 4.24e-35 | 2.74e+00 | 0.5341 |
| 5429 | POLH | HCC5 | Human | Liver | HCC | 2.93e-46 | 3.03e+00 | 0.4932 |
| 5429 | POLH | S029 | Human | Liver | HCC | 2.80e-03 | 2.13e-01 | 0.2581 |
| 5429 | POLH | male-WTA | Human | Thyroid | PTC | 2.29e-02 | 5.42e-02 | 0.1037 |
| 5429 | POLH | PTC01 | Human | Thyroid | PTC | 1.09e-02 | 5.95e-02 | 0.1899 |
| 5429 | POLH | PTC04 | Human | Thyroid | PTC | 4.82e-02 | 7.21e-02 | 0.1927 |
| 5429 | POLH | PTC05 | Human | Thyroid | PTC | 2.91e-06 | 3.41e-01 | 0.2065 |
| 5429 | POLH | PTC06 | Human | Thyroid | PTC | 8.22e-07 | 2.46e-01 | 0.2057 |
| 5429 | POLH | PTC07 | Human | Thyroid | PTC | 7.89e-11 | 1.61e-01 | 0.2044 |
| 5429 | POLH | ATC13 | Human | Thyroid | ATC | 3.75e-36 | 5.79e-01 | 0.34 |
| 5429 | POLH | ATC5 | Human | Thyroid | ATC | 2.56e-35 | 6.54e-01 | 0.34 |
| Page: 1 |
| Tissue | Expression Dynamics | Abbreviation |
| Liver |  | HCC: Hepatocellular carcinoma |
| NAFLD: Non-alcoholic fatty liver disease | ||
| Thyroid | 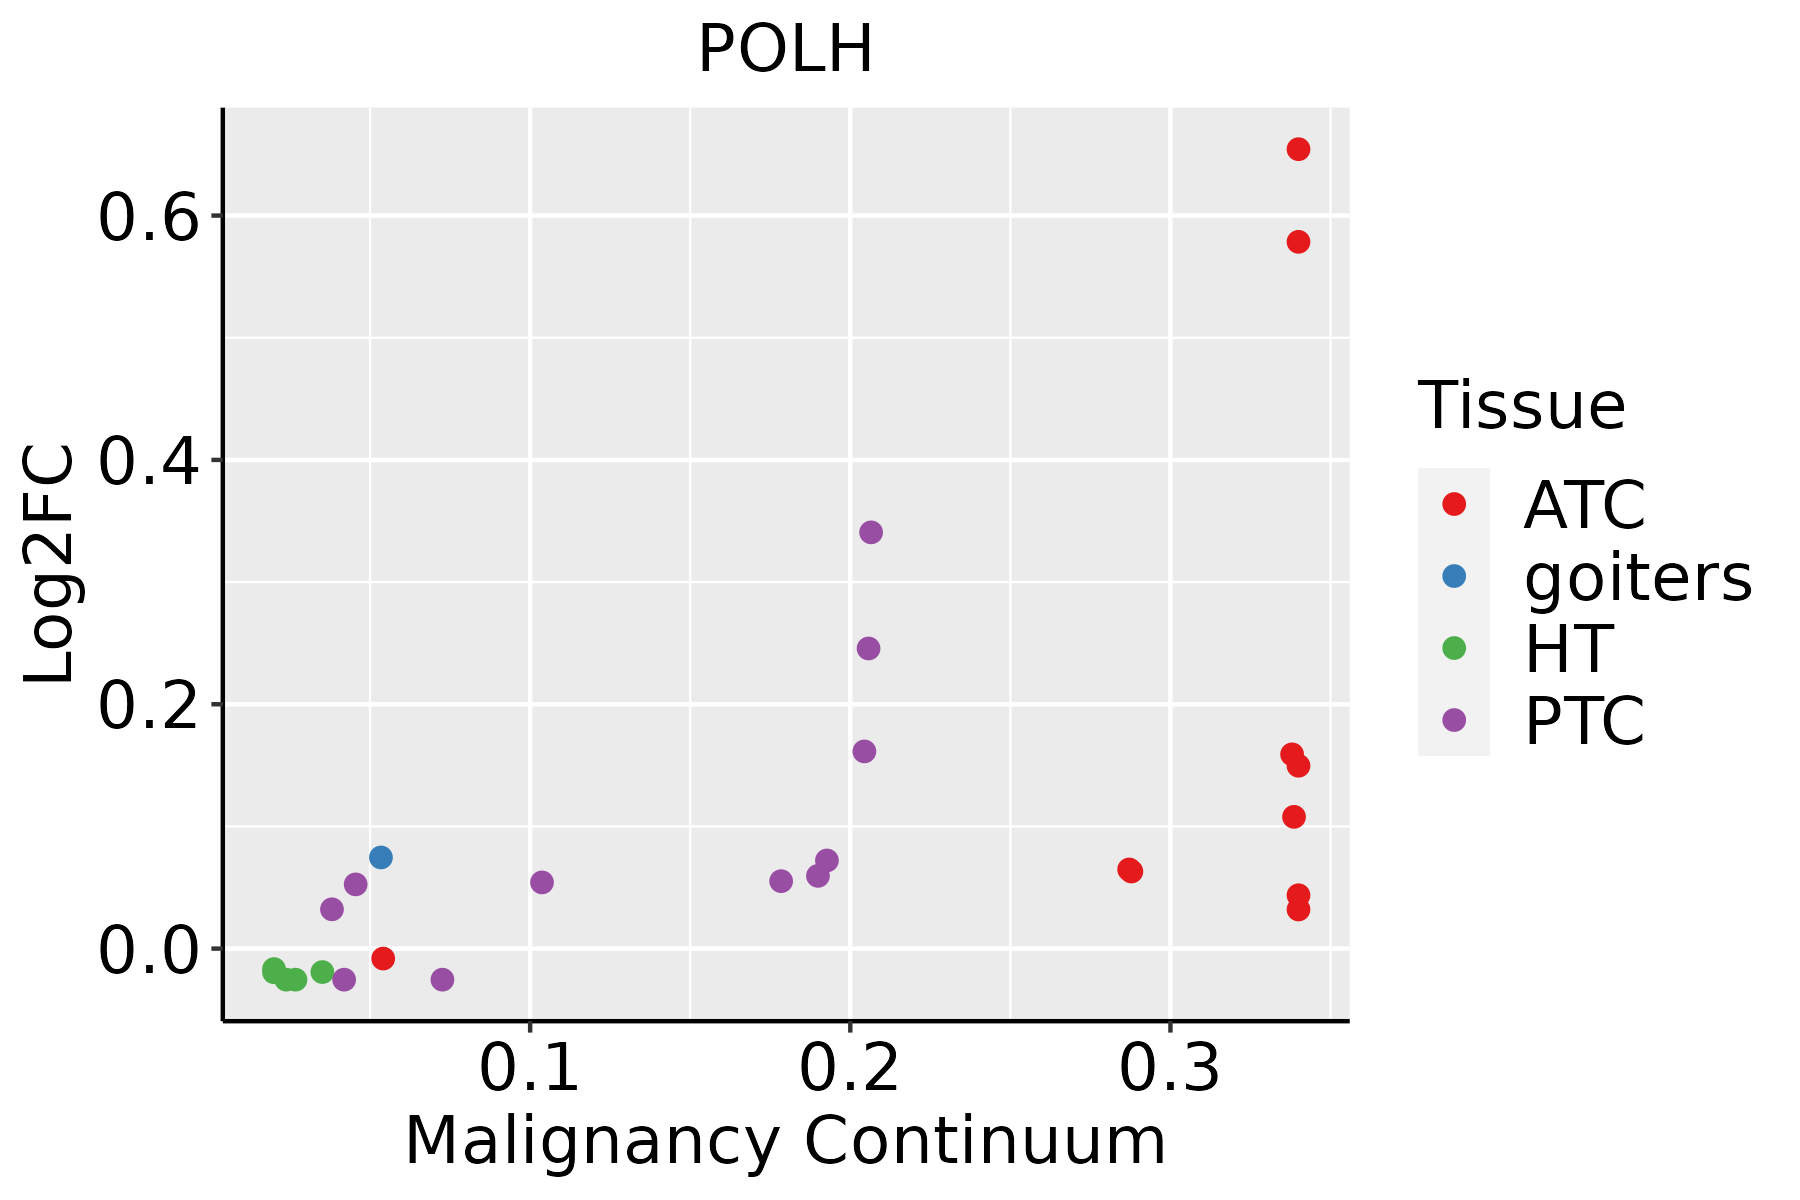 | ATC: Anaplastic thyroid cancer |
| HT: Hashimoto's thyroiditis | ||
| PTC: Papillary thyroid cancer |
| ∗log2FC in expression of this searched gene in stem-like cells from each diseased tissue sample relative to stem-like cells in normal samples in each tissue plotted against the malignancy continuum. Samples are colored based on if they are from different disease stage. |
Top |
Malignant transformation related pathway analysis |
| Find out the enriched GO biological processes and KEGG pathways involved in transition from healthy to precancer to cancer |
| Tissue | Disease Stage | Enriched GO biological Processes |
| Colorectum | AD |  |
| Colorectum | SER |  |
| Colorectum | MSS |  |
| Colorectum | MSI-H |  |
| Colorectum | FAP |  |
| ∗Top 15 enriched GO BP terms are showed in the bar plot of each disease state in each tissue. Each row represents a significant GO biological process which is colored according to the -log10(p.adjust). |
| Page: 1 2 3 4 5 6 7 8 9 |
| GO ID | Tissue | Disease Stage | Description | Gene Ratio | Bg Ratio | pvalue | p.adjust | Count |
| GO:005105221 | Liver | HCC | regulation of DNA metabolic process | 198/7958 | 359/18723 | 7.62e-07 | 1.17e-05 | 198 |
| GO:200102021 | Liver | HCC | regulation of response to DNA damage stimulus | 128/7958 | 219/18723 | 1.31e-06 | 1.90e-05 | 128 |
| GO:007121421 | Liver | HCC | cellular response to abiotic stimulus | 183/7958 | 331/18723 | 1.59e-06 | 2.26e-05 | 183 |
| GO:010400421 | Liver | HCC | cellular response to environmental stimulus | 183/7958 | 331/18723 | 1.59e-06 | 2.26e-05 | 183 |
| GO:00062601 | Liver | HCC | DNA replication | 146/7958 | 260/18723 | 5.68e-06 | 7.02e-05 | 146 |
| GO:00346441 | Liver | HCC | cellular response to UV | 56/7958 | 90/18723 | 1.25e-04 | 1.03e-03 | 56 |
| GO:00714782 | Liver | HCC | cellular response to radiation | 104/7958 | 186/18723 | 1.48e-04 | 1.19e-03 | 104 |
| GO:0009411 | Liver | HCC | response to UV | 85/7958 | 149/18723 | 2.34e-04 | 1.77e-03 | 85 |
| GO:00718975 | Liver | HCC | DNA biosynthetic process | 99/7958 | 180/18723 | 4.66e-04 | 3.08e-03 | 99 |
| GO:00062824 | Liver | HCC | regulation of DNA repair | 74/7958 | 130/18723 | 6.27e-04 | 3.89e-03 | 74 |
| GO:00093146 | Liver | HCC | response to radiation | 223/7958 | 456/18723 | 3.08e-03 | 1.43e-02 | 223 |
| GO:005105218 | Thyroid | PTC | regulation of DNA metabolic process | 171/5968 | 359/18723 | 2.52e-10 | 8.33e-09 | 171 |
| GO:2001020112 | Thyroid | PTC | regulation of response to DNA damage stimulus | 113/5968 | 219/18723 | 9.37e-10 | 2.77e-08 | 113 |
| GO:0071214111 | Thyroid | PTC | cellular response to abiotic stimulus | 158/5968 | 331/18723 | 9.90e-10 | 2.89e-08 | 158 |
| GO:0104004111 | Thyroid | PTC | cellular response to environmental stimulus | 158/5968 | 331/18723 | 9.90e-10 | 2.89e-08 | 158 |
| GO:007147819 | Thyroid | PTC | cellular response to radiation | 93/5968 | 186/18723 | 1.90e-07 | 3.51e-06 | 93 |
| GO:0009314111 | Thyroid | PTC | response to radiation | 195/5968 | 456/18723 | 5.10e-07 | 8.27e-06 | 195 |
| GO:00094117 | Thyroid | PTC | response to UV | 76/5968 | 149/18723 | 8.97e-07 | 1.36e-05 | 76 |
| GO:00346447 | Thyroid | PTC | cellular response to UV | 49/5968 | 90/18723 | 7.58e-06 | 8.77e-05 | 49 |
| GO:00062828 | Thyroid | PTC | regulation of DNA repair | 65/5968 | 130/18723 | 1.25e-05 | 1.36e-04 | 65 |
| Page: 1 2 |
| Pathway ID | Tissue | Disease Stage | Description | Gene Ratio | Bg Ratio | pvalue | p.adjust | qvalue | Count |
| hsa015242 | Liver | HCC | Platinum drug resistance | 52/4020 | 73/8465 | 3.14e-05 | 1.88e-04 | 1.04e-04 | 52 |
| hsa015243 | Liver | HCC | Platinum drug resistance | 52/4020 | 73/8465 | 3.14e-05 | 1.88e-04 | 1.04e-04 | 52 |
| Page: 1 |
Top |
Cell-cell communication analysis |
| Identification of potential cell-cell interactions between two cell types and their ligand-receptor pairs for different disease states |
| Ligand | Receptor | LRpair | Pathway | Tissue | Disease Stage |
| Page: 1 |
Top |
Single-cell gene regulatory network inference analysis |
| Find out the significant the regulons (TFs) and the target genes of each regulon across cell types for different disease states |
| TF | Cell Type | Tissue | Disease Stage | Target Gene | RSS | Regulon Activity |
| ∗The dot plots of a searched regulon are shown for all cell subpopulations in each disease state of each tissue based on the regulon specific score inferred using pySCENIC and by calculating the average expression. |
| Page: 1 |
Top |
Somatic mutation of malignant transformation related genes |
| Annotation of somatic variants for genes involved in malignant transformation |
| Hugo Symbol | Variant Class | Variant Classification | dbSNP RS | HGVSc | HGVSp | HGVSp Short | SWISSPROT | BIOTYPE | SIFT | PolyPhen | Tumor Sample Barcode | Tissue | Histology | Sex | Age | Stage | Therapy Types | Drugs | Outcome |
| POLH | SNV | Missense_Mutation | rs113074920 | c.241C>T | p.Arg81Cys | p.R81C | Q9Y253 | protein_coding | deleterious(0.01) | possibly_damaging(0.903) | TCGA-AN-A046-01 | Breast | breast invasive carcinoma | Female | >=65 | I/II | Unknown | Unknown | SD |
| POLH | SNV | Missense_Mutation | c.87N>C | p.Leu29Phe | p.L29F | Q9Y253 | protein_coding | deleterious(0.05) | probably_damaging(0.996) | TCGA-BH-A0HP-01 | Breast | breast invasive carcinoma | Female | >=65 | III/IV | Chemotherapy | doxorubicin | SD | |
| POLH | SNV | Missense_Mutation | c.1712N>G | p.Tyr571Cys | p.Y571C | Q9Y253 | protein_coding | tolerated(0.18) | benign(0) | TCGA-D8-A1XK-01 | Breast | breast invasive carcinoma | Female | <65 | I/II | Chemotherapy | doxorubicine+cyclophosphamide | SD | |
| POLH | insertion | In_Frame_Ins | novel | c.479_480insAGCTTCCTGGCTAAGGTGTCA | p.Thr160_Val161insAlaSerTrpLeuArgCysHis | p.T160_V161insASWLRCH | Q9Y253 | protein_coding | TCGA-A8-A06Q-01 | Breast | breast invasive carcinoma | Female | <65 | III/IV | Unknown | Unknown | SD | ||
| POLH | SNV | Missense_Mutation | novel | c.989C>T | p.Ala330Val | p.A330V | Q9Y253 | protein_coding | deleterious(0) | probably_damaging(0.977) | TCGA-2W-A8YY-01 | Cervix | cervical & endocervical cancer | Female | <65 | I/II | Chemotherapy | cisplatin | CR |
| POLH | SNV | Missense_Mutation | novel | c.523N>T | p.Leu175Phe | p.L175F | Q9Y253 | protein_coding | deleterious(0) | probably_damaging(0.995) | TCGA-A6-2672-01 | Colorectum | colon adenocarcinoma | Female | >=65 | III/IV | Unknown | Unknown | SD |
| POLH | SNV | Missense_Mutation | c.871N>T | p.Gly291Trp | p.G291W | Q9Y253 | protein_coding | deleterious(0) | probably_damaging(1) | TCGA-A6-5659-01 | Colorectum | colon adenocarcinoma | Male | >=65 | I/II | Unknown | Unknown | SD | |
| POLH | SNV | Missense_Mutation | rs551944293 | c.1147C>T | p.Arg383Cys | p.R383C | Q9Y253 | protein_coding | deleterious(0) | probably_damaging(1) | TCGA-A6-5665-01 | Colorectum | colon adenocarcinoma | Female | >=65 | I/II | Unknown | Unknown | PD |
| POLH | SNV | Missense_Mutation | c.153N>G | p.Ser51Arg | p.S51R | Q9Y253 | protein_coding | deleterious(0) | probably_damaging(1) | TCGA-AA-3510-01 | Colorectum | colon adenocarcinoma | Male | >=65 | I/II | Unknown | Unknown | SD | |
| POLH | SNV | Missense_Mutation | c.1593N>A | p.Phe531Leu | p.F531L | Q9Y253 | protein_coding | tolerated(0.12) | benign(0.003) | TCGA-AA-3510-01 | Colorectum | colon adenocarcinoma | Male | >=65 | I/II | Unknown | Unknown | SD |
| Page: 1 2 3 4 5 6 7 |
Top |
Related drugs of malignant transformation related genes |
| Identification of chemicals and drugs interact with genes involved in malignant transfromation |
| (DGIdb 4.0) |
| Entrez ID | Symbol | Category | Interaction Types | Drug Claim Name | Drug Name | PMIDs |
| 5429 | POLH | CLINICALLY ACTIONABLE, ENZYME, DNA REPAIR | AG-538 | CHEMBL56393 | ||
| 5429 | POLH | CLINICALLY ACTIONABLE, ENZYME, DNA REPAIR | IDARUBICIN | IDARUBICIN | ||
| 5429 | POLH | CLINICALLY ACTIONABLE, ENZYME, DNA REPAIR | GNF-PF-3148 | CHEMBL81782 | ||
| 5429 | POLH | CLINICALLY ACTIONABLE, ENZYME, DNA REPAIR | ASTERRIC ACID | ASTERRIC ACID | ||
| 5429 | POLH | CLINICALLY ACTIONABLE, ENZYME, DNA REPAIR | NSC-107022 | CHEMBL1601846 | ||
| 5429 | POLH | CLINICALLY ACTIONABLE, ENZYME, DNA REPAIR | 2,3,4-TRIHYDROXYBENZOPHENONE | CHEMBL1527 | ||
| 5429 | POLH | CLINICALLY ACTIONABLE, ENZYME, DNA REPAIR | CCG-63802 | CHEMBL1476646 | ||
| 5429 | POLH | CLINICALLY ACTIONABLE, ENZYME, DNA REPAIR | GNF-PF-5510 | CHEMBL578741 | ||
| 5429 | POLH | CLINICALLY ACTIONABLE, ENZYME, DNA REPAIR | NSC-61836 | CHEMBL521171 | ||
| 5429 | POLH | CLINICALLY ACTIONABLE, ENZYME, DNA REPAIR | CEFMETAZOLE SODIUM | CEFMETAZOLE SODIUM |
| Page: 1 2 3 4 5 6 7 8 9 10 11 12 13 14 15 16 17 18 |

Copyright 2023-Present -The University of Texas Health Science Center at Houston |