
|
|||||
|
 | |
| |
| |
| |
| |
| |
|
Gene: POLG2 |
Gene summary for POLG2 |
| Gene information | Species | Human | Gene symbol | POLG2 | Gene ID | 11232 |
| Gene name | DNA polymerase gamma 2, accessory subunit | |
| Gene Alias | HP55 | |
| Cytomap | 17q23.3 | |
| Gene Type | protein-coding | GO ID | GO:0000002 | UniProtAcc | E5KS15 |
Top |
Malignant transformation analysis |
| Identification of the aberrant gene expression in precancerous and cancerous lesions by comparing the gene expression of stem-like cells in diseased tissues with normal stem cells |
| Entrez ID | Symbol | Replicates | Species | Organ | Tissue | Adj P-value | Log2FC | Malignancy |
| 11232 | POLG2 | AEH-subject4 | Human | Endometrium | AEH | 9.00e-04 | 3.22e-01 | -0.2657 |
| 11232 | POLG2 | GSM6177620_NYU_UCEC1_lib3_lib3 | Human | Endometrium | EEC | 3.57e-05 | -8.06e-02 | -0.1883 |
| 11232 | POLG2 | GSM6177622_NYU_UCEC3_lib1_lib1 | Human | Endometrium | EEC | 1.46e-04 | -4.81e-02 | -0.1917 |
| 11232 | POLG2 | LZE4T | Human | Esophagus | ESCC | 6.50e-05 | 1.19e-01 | 0.0811 |
| 11232 | POLG2 | LZE7T | Human | Esophagus | ESCC | 3.99e-04 | 1.78e-01 | 0.0667 |
| 11232 | POLG2 | LZE24T | Human | Esophagus | ESCC | 2.08e-08 | 1.52e-01 | 0.0596 |
| 11232 | POLG2 | P1T-E | Human | Esophagus | ESCC | 2.75e-22 | 1.09e+00 | 0.0875 |
| 11232 | POLG2 | P2T-E | Human | Esophagus | ESCC | 2.70e-19 | 2.68e-01 | 0.1177 |
| 11232 | POLG2 | P4T-E | Human | Esophagus | ESCC | 1.61e-10 | 1.10e-01 | 0.1323 |
| 11232 | POLG2 | P8T-E | Human | Esophagus | ESCC | 3.06e-12 | 1.93e-01 | 0.0889 |
| 11232 | POLG2 | P9T-E | Human | Esophagus | ESCC | 7.20e-06 | 1.02e-01 | 0.1131 |
| 11232 | POLG2 | P10T-E | Human | Esophagus | ESCC | 8.67e-21 | 2.35e-01 | 0.116 |
| 11232 | POLG2 | P11T-E | Human | Esophagus | ESCC | 1.15e-14 | 3.61e-01 | 0.1426 |
| 11232 | POLG2 | P12T-E | Human | Esophagus | ESCC | 5.02e-23 | 2.57e-01 | 0.1122 |
| 11232 | POLG2 | P15T-E | Human | Esophagus | ESCC | 1.07e-15 | 3.47e-01 | 0.1149 |
| 11232 | POLG2 | P16T-E | Human | Esophagus | ESCC | 1.56e-19 | 2.49e-01 | 0.1153 |
| 11232 | POLG2 | P20T-E | Human | Esophagus | ESCC | 5.42e-10 | 1.91e-01 | 0.1124 |
| 11232 | POLG2 | P21T-E | Human | Esophagus | ESCC | 1.81e-11 | 1.17e-01 | 0.1617 |
| 11232 | POLG2 | P22T-E | Human | Esophagus | ESCC | 9.03e-10 | 1.24e-01 | 0.1236 |
| 11232 | POLG2 | P23T-E | Human | Esophagus | ESCC | 1.43e-20 | 4.49e-01 | 0.108 |
| Page: 1 2 3 4 |
| Tissue | Expression Dynamics | Abbreviation |
| Endometrium | 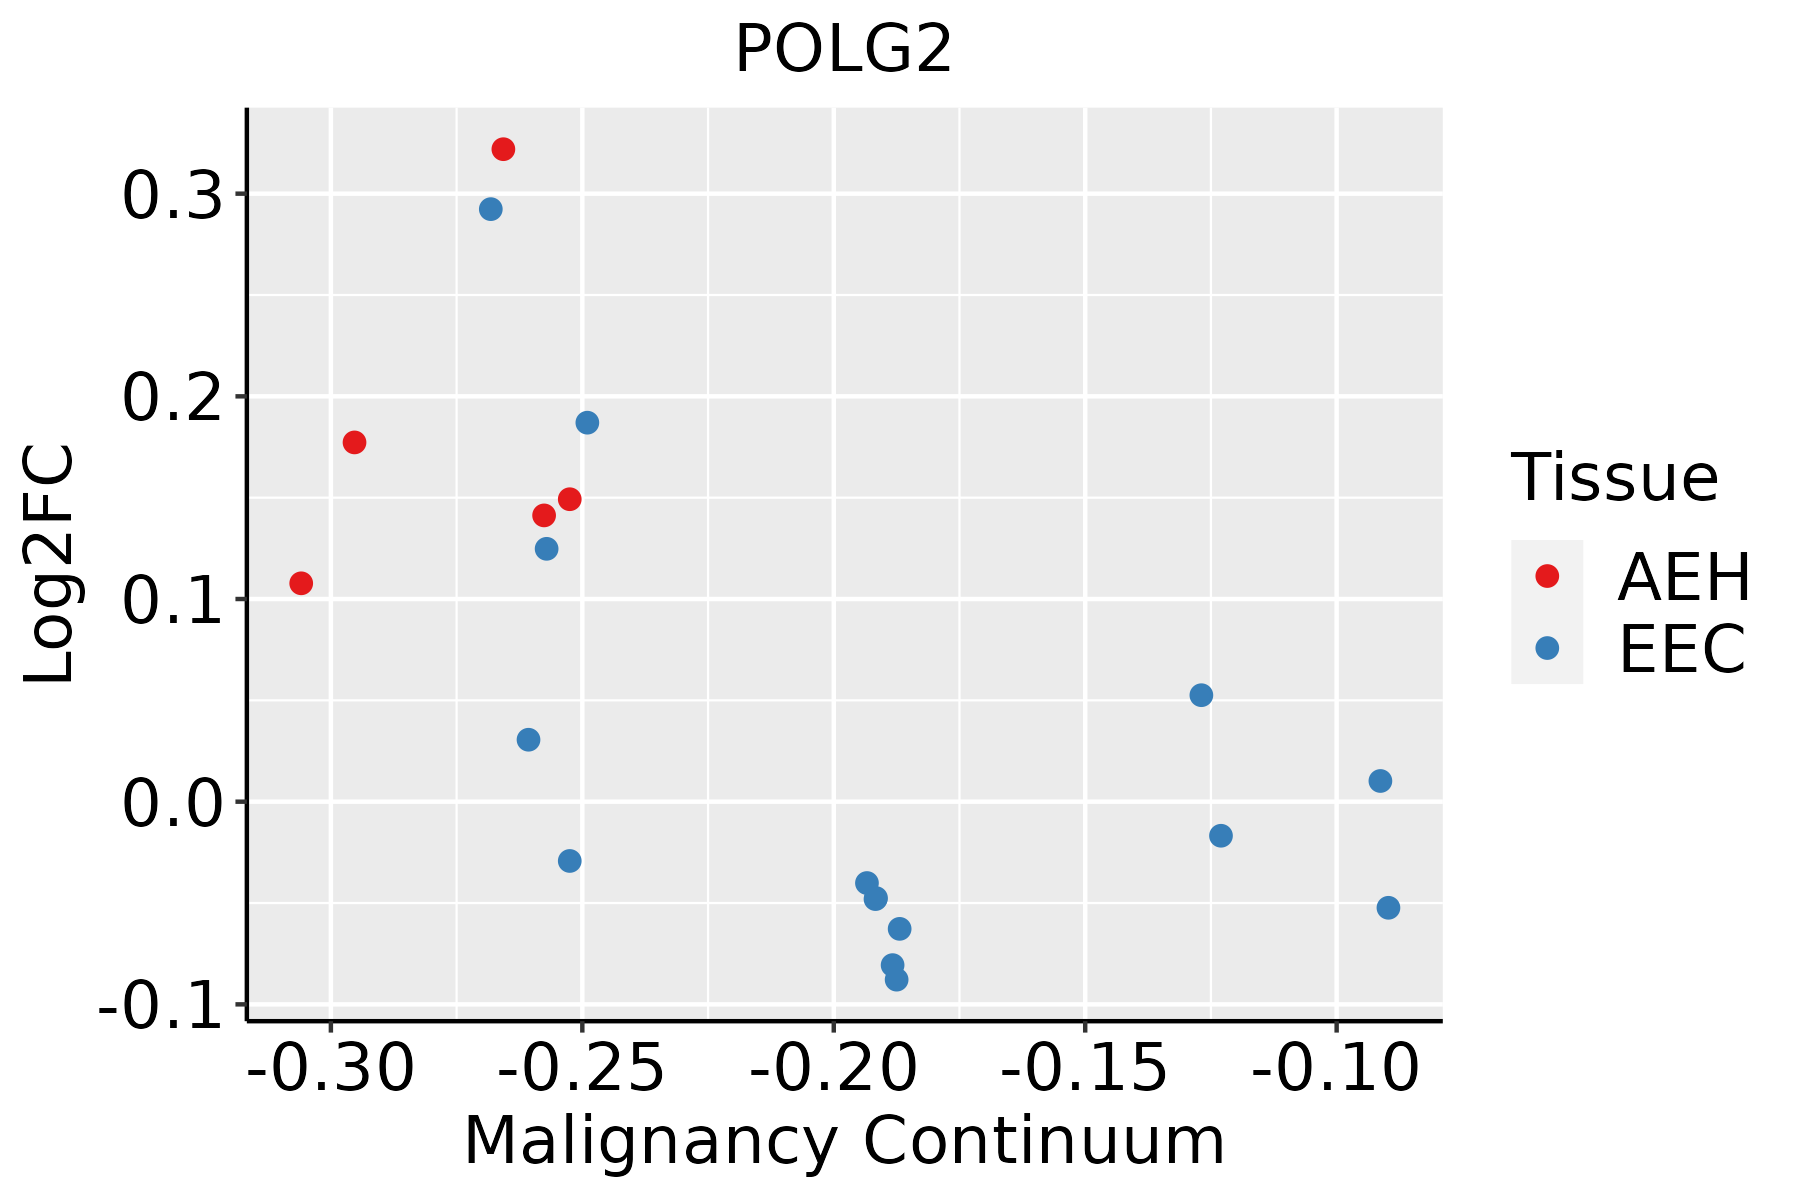 | AEH: Atypical endometrial hyperplasia |
| EEC: Endometrioid Cancer | ||
| Esophagus |  | ESCC: Esophageal squamous cell carcinoma |
| HGIN: High-grade intraepithelial neoplasias | ||
| LGIN: Low-grade intraepithelial neoplasias | ||
| Lung |  | AAH: Atypical adenomatous hyperplasia |
| AIS: Adenocarcinoma in situ | ||
| IAC: Invasive lung adenocarcinoma | ||
| MIA: Minimally invasive adenocarcinoma |
| ∗log2FC in expression of this searched gene in stem-like cells from each diseased tissue sample relative to stem-like cells in normal samples in each tissue plotted against the malignancy continuum. Samples are colored based on if they are from different disease stage. |
Top |
Malignant transformation related pathway analysis |
| Find out the enriched GO biological processes and KEGG pathways involved in transition from healthy to precancer to cancer |
| Tissue | Disease Stage | Enriched GO biological Processes |
| Colorectum | AD |  |
| Colorectum | SER |  |
| Colorectum | MSS |  |
| Colorectum | MSI-H |  |
| Colorectum | FAP |  |
| ∗Top 15 enriched GO BP terms are showed in the bar plot of each disease state in each tissue. Each row represents a significant GO biological process which is colored according to the -log10(p.adjust). |
| Page: 1 2 3 4 5 6 7 8 9 |
| GO ID | Tissue | Disease Stage | Description | Gene Ratio | Bg Ratio | pvalue | p.adjust | Count |
| GO:004533310 | Endometrium | AEH | cellular respiration | 79/2100 | 230/18723 | 8.38e-21 | 7.18e-18 | 79 |
| GO:002290410 | Endometrium | AEH | respiratory electron transport chain | 51/2100 | 114/18723 | 1.28e-19 | 8.54e-17 | 51 |
| GO:001598010 | Endometrium | AEH | energy derivation by oxidation of organic compounds | 93/2100 | 318/18723 | 8.51e-19 | 5.10e-16 | 93 |
| GO:000609110 | Endometrium | AEH | generation of precursor metabolites and energy | 121/2100 | 490/18723 | 1.65e-17 | 8.23e-15 | 121 |
| GO:002290010 | Endometrium | AEH | electron transport chain | 60/2100 | 175/18723 | 4.37e-16 | 1.75e-13 | 60 |
| GO:00017019 | Endometrium | AEH | in utero embryonic development | 73/2100 | 367/18723 | 7.18e-07 | 2.63e-05 | 73 |
| GO:200027810 | Endometrium | AEH | regulation of DNA biosynthetic process | 27/2100 | 106/18723 | 3.12e-05 | 5.66e-04 | 27 |
| GO:00718977 | Endometrium | AEH | DNA biosynthetic process | 37/2100 | 180/18723 | 1.87e-04 | 2.39e-03 | 37 |
| GO:20005739 | Endometrium | AEH | positive regulation of DNA biosynthetic process | 18/2100 | 66/18723 | 2.52e-04 | 2.99e-03 | 18 |
| GO:00510549 | Endometrium | AEH | positive regulation of DNA metabolic process | 36/2100 | 201/18723 | 3.05e-03 | 2.16e-02 | 36 |
| GO:00062752 | Endometrium | AEH | regulation of DNA replication | 21/2100 | 107/18723 | 7.38e-03 | 4.20e-02 | 21 |
| GO:004533315 | Endometrium | EEC | cellular respiration | 83/2168 | 230/18723 | 1.72e-22 | 2.06e-19 | 83 |
| GO:001598015 | Endometrium | EEC | energy derivation by oxidation of organic compounds | 97/2168 | 318/18723 | 5.37e-20 | 3.58e-17 | 97 |
| GO:002290415 | Endometrium | EEC | respiratory electron transport chain | 52/2168 | 114/18723 | 7.97e-20 | 4.78e-17 | 52 |
| GO:000609115 | Endometrium | EEC | generation of precursor metabolites and energy | 125/2168 | 490/18723 | 3.76e-18 | 1.88e-15 | 125 |
| GO:002290015 | Endometrium | EEC | electron transport chain | 61/2168 | 175/18723 | 4.60e-16 | 1.84e-13 | 61 |
| GO:000170114 | Endometrium | EEC | in utero embryonic development | 75/2168 | 367/18723 | 5.86e-07 | 2.16e-05 | 75 |
| GO:200027814 | Endometrium | EEC | regulation of DNA biosynthetic process | 29/2168 | 106/18723 | 6.68e-06 | 1.58e-04 | 29 |
| GO:007189713 | Endometrium | EEC | DNA biosynthetic process | 39/2168 | 180/18723 | 7.68e-05 | 1.11e-03 | 39 |
| GO:200057314 | Endometrium | EEC | positive regulation of DNA biosynthetic process | 19/2168 | 66/18723 | 1.19e-04 | 1.59e-03 | 19 |
| Page: 1 2 3 |
| Pathway ID | Tissue | Disease Stage | Description | Gene Ratio | Bg Ratio | pvalue | p.adjust | qvalue | Count |
| hsa034104 | Esophagus | ESCC | Base excision repair | 38/4205 | 44/8465 | 3.59e-07 | 2.62e-06 | 1.34e-06 | 38 |
| hsa0341011 | Esophagus | ESCC | Base excision repair | 38/4205 | 44/8465 | 3.59e-07 | 2.62e-06 | 1.34e-06 | 38 |
| Page: 1 |
Top |
Cell-cell communication analysis |
| Identification of potential cell-cell interactions between two cell types and their ligand-receptor pairs for different disease states |
| Ligand | Receptor | LRpair | Pathway | Tissue | Disease Stage |
| Page: 1 |
Top |
Single-cell gene regulatory network inference analysis |
| Find out the significant the regulons (TFs) and the target genes of each regulon across cell types for different disease states |
| TF | Cell Type | Tissue | Disease Stage | Target Gene | RSS | Regulon Activity |
| ∗The dot plots of a searched regulon are shown for all cell subpopulations in each disease state of each tissue based on the regulon specific score inferred using pySCENIC and by calculating the average expression. |
| Page: 1 |
Top |
Somatic mutation of malignant transformation related genes |
| Annotation of somatic variants for genes involved in malignant transformation |
| Hugo Symbol | Variant Class | Variant Classification | dbSNP RS | HGVSc | HGVSp | HGVSp Short | SWISSPROT | BIOTYPE | SIFT | PolyPhen | Tumor Sample Barcode | Tissue | Histology | Sex | Age | Stage | Therapy Types | Drugs | Outcome |
| POLG2 | SNV | Missense_Mutation | c.757N>A | p.Asp253Asn | p.D253N | Q9UHN1 | protein_coding | tolerated(0.1) | probably_damaging(0.997) | TCGA-AC-A23H-01 | Breast | breast invasive carcinoma | Female | >=65 | I/II | Unknown | Unknown | PD | |
| POLG2 | SNV | Missense_Mutation | novel | c.915N>A | p.Asn305Lys | p.N305K | Q9UHN1 | protein_coding | deleterious(0.01) | benign(0.164) | TCGA-AC-A3TM-01 | Breast | breast invasive carcinoma | Female | <65 | III/IV | Chemotherapy | cytoxan | CR |
| POLG2 | SNV | Missense_Mutation | c.1301A>G | p.Glu434Gly | p.E434G | Q9UHN1 | protein_coding | deleterious(0) | probably_damaging(0.994) | TCGA-D8-A1JK-01 | Breast | breast invasive carcinoma | Female | >=65 | I/II | Unknown | Unknown | SD | |
| POLG2 | deletion | Frame_Shift_Del | novel | c.756delN | p.Asp253IlefsTer16 | p.D253Ifs*16 | Q9UHN1 | protein_coding | TCGA-D8-A27V-01 | Breast | breast invasive carcinoma | Female | <65 | I/II | Hormone Therapy | tamoxiphen | SD | ||
| POLG2 | deletion | Frame_Shift_Del | novel | c.42delN | p.Cys14Ter | p.C14* | Q9UHN1 | protein_coding | TCGA-D8-A27V-01 | Breast | breast invasive carcinoma | Female | <65 | I/II | Hormone Therapy | tamoxiphen | SD | ||
| POLG2 | SNV | Missense_Mutation | c.1400N>T | p.His467Leu | p.H467L | Q9UHN1 | protein_coding | deleterious(0) | probably_damaging(0.998) | TCGA-EA-A3QD-01 | Cervix | cervical & endocervical cancer | Female | <65 | III/IV | Chemotherapy | cisplatin | CR | |
| POLG2 | SNV | Missense_Mutation | novel | c.1213G>A | p.Glu405Lys | p.E405K | Q9UHN1 | protein_coding | deleterious(0) | probably_damaging(0.998) | TCGA-MA-AA41-01 | Cervix | cervical & endocervical cancer | Female | <65 | I/II | Unknown | Unknown | SD |
| POLG2 | SNV | Missense_Mutation | novel | c.899T>C | p.Ile300Thr | p.I300T | Q9UHN1 | protein_coding | deleterious(0) | possibly_damaging(0.878) | TCGA-VS-A94W-01 | Cervix | cervical & endocervical cancer | Female | <65 | I/II | Chemotherapy | cisplatin | CR |
| POLG2 | SNV | Missense_Mutation | novel | c.158N>G | p.Asn53Ser | p.N53S | Q9UHN1 | protein_coding | tolerated_low_confidence(0.08) | benign(0) | TCGA-A6-3809-01 | Colorectum | colon adenocarcinoma | Female | >=65 | I/II | Unknown | Unknown | SD |
| POLG2 | SNV | Missense_Mutation | c.533C>A | p.Ser178Tyr | p.S178Y | Q9UHN1 | protein_coding | deleterious(0) | possibly_damaging(0.743) | TCGA-AA-3489-01 | Colorectum | colon adenocarcinoma | Male | >=65 | I/II | Unknown | Unknown | PD |
| Page: 1 2 3 4 5 |
Top |
Related drugs of malignant transformation related genes |
| Identification of chemicals and drugs interact with genes involved in malignant transfromation |
| (DGIdb 4.0) |
| Entrez ID | Symbol | Category | Interaction Types | Drug Claim Name | Drug Name | PMIDs |
| Page: 1 |

Copyright 2023-Present -The University of Texas Health Science Center at Houston |