
|
|||||
|
 | |
| |
| |
| |
| |
| |
|
Gene: POLG |
Gene summary for POLG |
| Gene information | Species | Human | Gene symbol | POLG | Gene ID | 5428 |
| Gene name | DNA polymerase gamma, catalytic subunit | |
| Gene Alias | MDP1 | |
| Cytomap | 15q26.1 | |
| Gene Type | protein-coding | GO ID | GO:0001678 | UniProtAcc | E5KNU5 |
Top |
Malignant transformation analysis |
| Identification of the aberrant gene expression in precancerous and cancerous lesions by comparing the gene expression of stem-like cells in diseased tissues with normal stem cells |
| Entrez ID | Symbol | Replicates | Species | Organ | Tissue | Adj P-value | Log2FC | Malignancy |
| 5428 | POLG | LZE4T | Human | Esophagus | ESCC | 5.07e-11 | 2.19e-01 | 0.0811 |
| 5428 | POLG | LZE7T | Human | Esophagus | ESCC | 1.68e-09 | 3.91e-01 | 0.0667 |
| 5428 | POLG | LZE8T | Human | Esophagus | ESCC | 2.18e-04 | 7.38e-02 | 0.067 |
| 5428 | POLG | LZE24T | Human | Esophagus | ESCC | 1.11e-12 | 1.75e-01 | 0.0596 |
| 5428 | POLG | P1T-E | Human | Esophagus | ESCC | 5.49e-06 | 2.94e-01 | 0.0875 |
| 5428 | POLG | P2T-E | Human | Esophagus | ESCC | 8.22e-26 | 1.24e-01 | 0.1177 |
| 5428 | POLG | P4T-E | Human | Esophagus | ESCC | 2.55e-15 | 1.45e-01 | 0.1323 |
| 5428 | POLG | P5T-E | Human | Esophagus | ESCC | 3.95e-04 | -7.53e-03 | 0.1327 |
| 5428 | POLG | P8T-E | Human | Esophagus | ESCC | 1.63e-19 | 1.82e-01 | 0.0889 |
| 5428 | POLG | P9T-E | Human | Esophagus | ESCC | 9.04e-13 | 2.01e-01 | 0.1131 |
| 5428 | POLG | P10T-E | Human | Esophagus | ESCC | 2.29e-18 | 2.84e-01 | 0.116 |
| 5428 | POLG | P11T-E | Human | Esophagus | ESCC | 1.71e-07 | 2.10e-01 | 0.1426 |
| 5428 | POLG | P12T-E | Human | Esophagus | ESCC | 6.87e-17 | 2.82e-01 | 0.1122 |
| 5428 | POLG | P15T-E | Human | Esophagus | ESCC | 8.20e-18 | 3.87e-01 | 0.1149 |
| 5428 | POLG | P16T-E | Human | Esophagus | ESCC | 2.45e-19 | 1.78e-01 | 0.1153 |
| 5428 | POLG | P17T-E | Human | Esophagus | ESCC | 1.04e-09 | 2.29e-01 | 0.1278 |
| 5428 | POLG | P19T-E | Human | Esophagus | ESCC | 1.77e-08 | 3.05e-01 | 0.1662 |
| 5428 | POLG | P20T-E | Human | Esophagus | ESCC | 1.14e-09 | 2.03e-01 | 0.1124 |
| 5428 | POLG | P21T-E | Human | Esophagus | ESCC | 3.20e-12 | 9.78e-02 | 0.1617 |
| 5428 | POLG | P22T-E | Human | Esophagus | ESCC | 4.62e-15 | 1.94e-01 | 0.1236 |
| Page: 1 2 3 4 |
| Tissue | Expression Dynamics | Abbreviation |
| Esophagus | 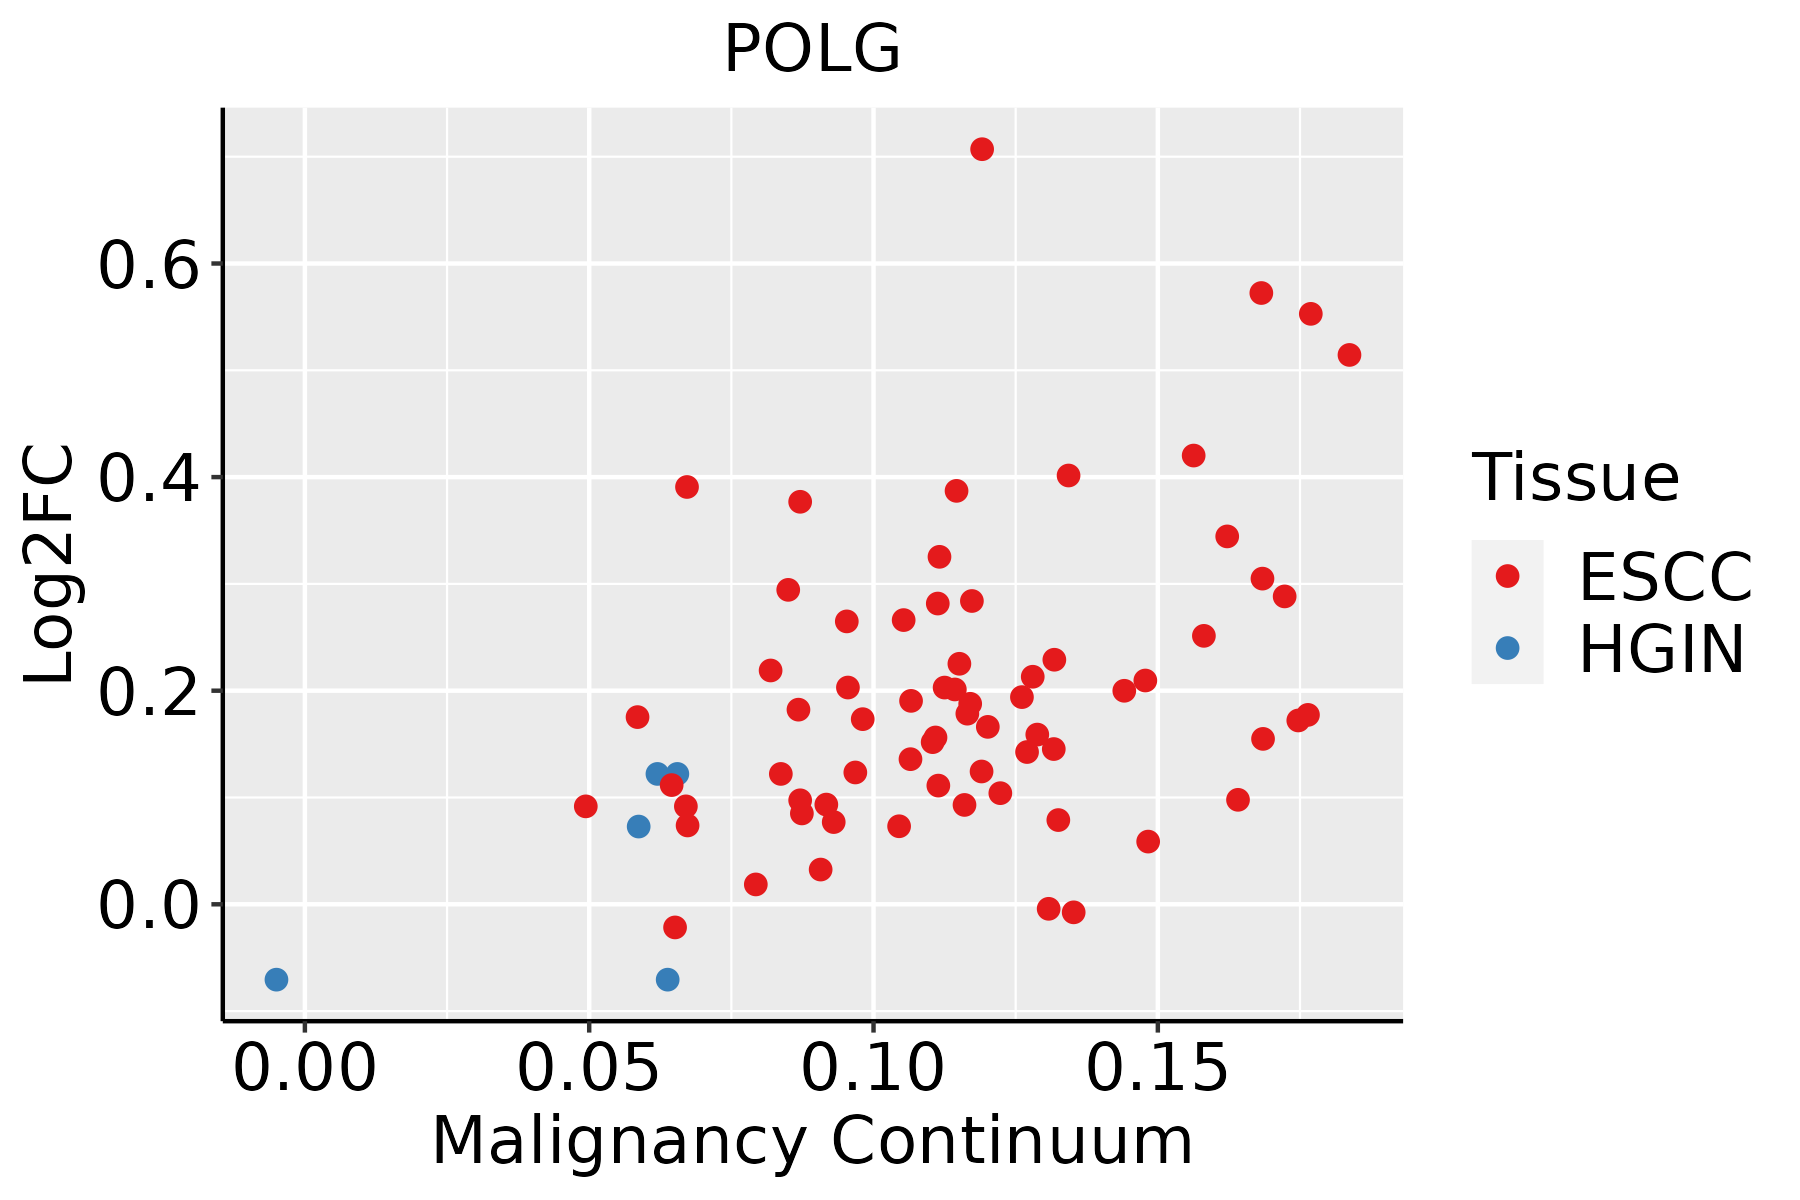 | ESCC: Esophageal squamous cell carcinoma |
| HGIN: High-grade intraepithelial neoplasias | ||
| LGIN: Low-grade intraepithelial neoplasias | ||
| Oral Cavity | 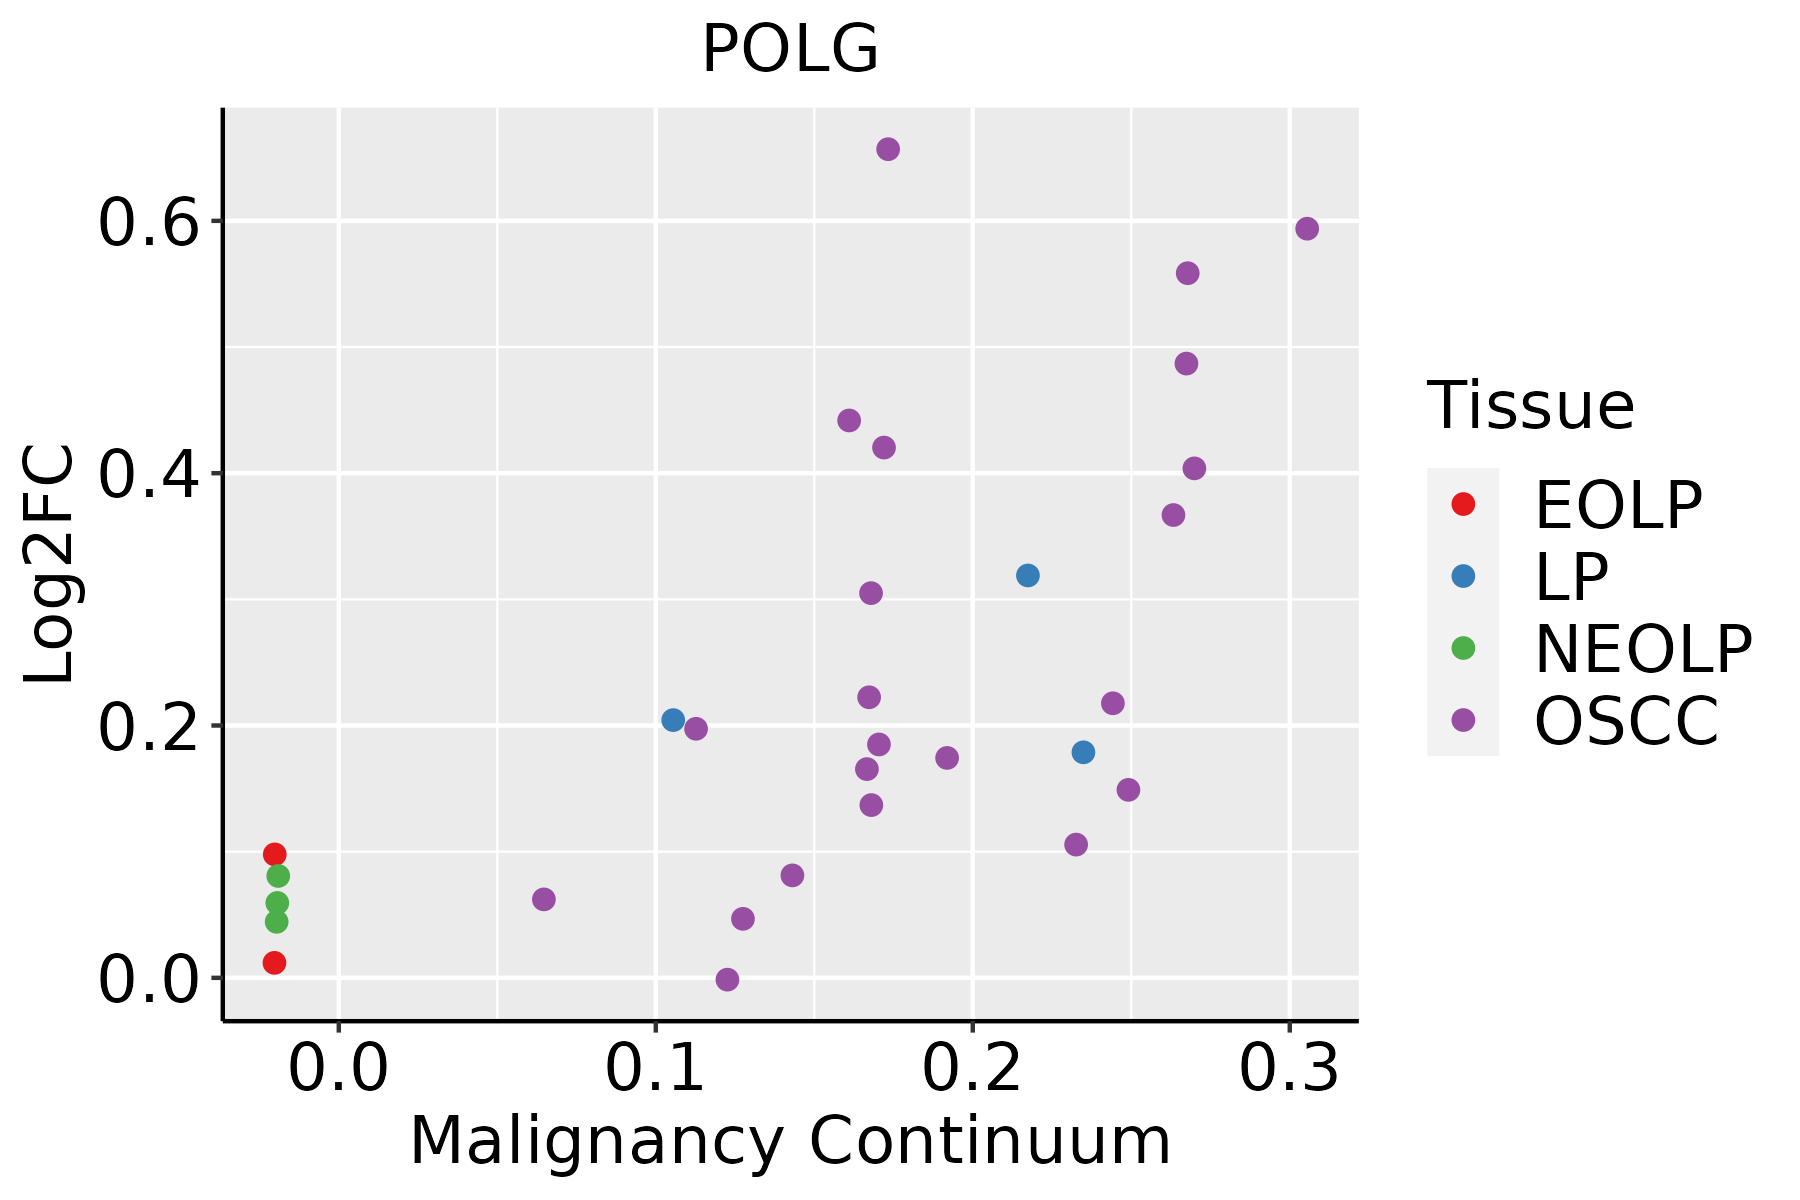 | EOLP: Erosive Oral lichen planus |
| LP: leukoplakia | ||
| NEOLP: Non-erosive oral lichen planus | ||
| OSCC: Oral squamous cell carcinoma |
| ∗log2FC in expression of this searched gene in stem-like cells from each diseased tissue sample relative to stem-like cells in normal samples in each tissue plotted against the malignancy continuum. Samples are colored based on if they are from different disease stage. |
Top |
Malignant transformation related pathway analysis |
| Find out the enriched GO biological processes and KEGG pathways involved in transition from healthy to precancer to cancer |
| Tissue | Disease Stage | Enriched GO biological Processes |
| Colorectum | AD |  |
| Colorectum | SER |  |
| Colorectum | MSS |  |
| Colorectum | MSI-H |  |
| Colorectum | FAP |  |
| ∗Top 15 enriched GO BP terms are showed in the bar plot of each disease state in each tissue. Each row represents a significant GO biological process which is colored according to the -log10(p.adjust). |
| Page: 1 2 3 4 5 6 7 8 9 |
| GO ID | Tissue | Disease Stage | Description | Gene Ratio | Bg Ratio | pvalue | p.adjust | Count |
| GO:004533310 | Endometrium | AEH | cellular respiration | 79/2100 | 230/18723 | 8.38e-21 | 7.18e-18 | 79 |
| GO:002290410 | Endometrium | AEH | respiratory electron transport chain | 51/2100 | 114/18723 | 1.28e-19 | 8.54e-17 | 51 |
| GO:001598010 | Endometrium | AEH | energy derivation by oxidation of organic compounds | 93/2100 | 318/18723 | 8.51e-19 | 5.10e-16 | 93 |
| GO:000609110 | Endometrium | AEH | generation of precursor metabolites and energy | 121/2100 | 490/18723 | 1.65e-17 | 8.23e-15 | 121 |
| GO:002290010 | Endometrium | AEH | electron transport chain | 60/2100 | 175/18723 | 4.37e-16 | 1.75e-13 | 60 |
| GO:00017019 | Endometrium | AEH | in utero embryonic development | 73/2100 | 367/18723 | 7.18e-07 | 2.63e-05 | 73 |
| GO:200027810 | Endometrium | AEH | regulation of DNA biosynthetic process | 27/2100 | 106/18723 | 3.12e-05 | 5.66e-04 | 27 |
| GO:00718977 | Endometrium | AEH | DNA biosynthetic process | 37/2100 | 180/18723 | 1.87e-04 | 2.39e-03 | 37 |
| GO:20005739 | Endometrium | AEH | positive regulation of DNA biosynthetic process | 18/2100 | 66/18723 | 2.52e-04 | 2.99e-03 | 18 |
| GO:00510549 | Endometrium | AEH | positive regulation of DNA metabolic process | 36/2100 | 201/18723 | 3.05e-03 | 2.16e-02 | 36 |
| GO:00062752 | Endometrium | AEH | regulation of DNA replication | 21/2100 | 107/18723 | 7.38e-03 | 4.20e-02 | 21 |
| GO:004533315 | Endometrium | EEC | cellular respiration | 83/2168 | 230/18723 | 1.72e-22 | 2.06e-19 | 83 |
| GO:001598015 | Endometrium | EEC | energy derivation by oxidation of organic compounds | 97/2168 | 318/18723 | 5.37e-20 | 3.58e-17 | 97 |
| GO:002290415 | Endometrium | EEC | respiratory electron transport chain | 52/2168 | 114/18723 | 7.97e-20 | 4.78e-17 | 52 |
| GO:000609115 | Endometrium | EEC | generation of precursor metabolites and energy | 125/2168 | 490/18723 | 3.76e-18 | 1.88e-15 | 125 |
| GO:002290015 | Endometrium | EEC | electron transport chain | 61/2168 | 175/18723 | 4.60e-16 | 1.84e-13 | 61 |
| GO:000170114 | Endometrium | EEC | in utero embryonic development | 75/2168 | 367/18723 | 5.86e-07 | 2.16e-05 | 75 |
| GO:200027814 | Endometrium | EEC | regulation of DNA biosynthetic process | 29/2168 | 106/18723 | 6.68e-06 | 1.58e-04 | 29 |
| GO:007189713 | Endometrium | EEC | DNA biosynthetic process | 39/2168 | 180/18723 | 7.68e-05 | 1.11e-03 | 39 |
| GO:200057314 | Endometrium | EEC | positive regulation of DNA biosynthetic process | 19/2168 | 66/18723 | 1.19e-04 | 1.59e-03 | 19 |
| Page: 1 2 3 4 |
| Pathway ID | Tissue | Disease Stage | Description | Gene Ratio | Bg Ratio | pvalue | p.adjust | qvalue | Count |
| hsa034104 | Esophagus | ESCC | Base excision repair | 38/4205 | 44/8465 | 3.59e-07 | 2.62e-06 | 1.34e-06 | 38 |
| hsa0341011 | Esophagus | ESCC | Base excision repair | 38/4205 | 44/8465 | 3.59e-07 | 2.62e-06 | 1.34e-06 | 38 |
| hsa03410 | Oral cavity | OSCC | Base excision repair | 32/3704 | 44/8465 | 9.11e-05 | 3.25e-04 | 1.65e-04 | 32 |
| hsa034101 | Oral cavity | OSCC | Base excision repair | 32/3704 | 44/8465 | 9.11e-05 | 3.25e-04 | 1.65e-04 | 32 |
| Page: 1 |
Top |
Cell-cell communication analysis |
| Identification of potential cell-cell interactions between two cell types and their ligand-receptor pairs for different disease states |
| Ligand | Receptor | LRpair | Pathway | Tissue | Disease Stage |
| Page: 1 |
Top |
Single-cell gene regulatory network inference analysis |
| Find out the significant the regulons (TFs) and the target genes of each regulon across cell types for different disease states |
| TF | Cell Type | Tissue | Disease Stage | Target Gene | RSS | Regulon Activity |
| ∗The dot plots of a searched regulon are shown for all cell subpopulations in each disease state of each tissue based on the regulon specific score inferred using pySCENIC and by calculating the average expression. |
| Page: 1 |
Top |
Somatic mutation of malignant transformation related genes |
| Annotation of somatic variants for genes involved in malignant transformation |
| Hugo Symbol | Variant Class | Variant Classification | dbSNP RS | HGVSc | HGVSp | HGVSp Short | SWISSPROT | BIOTYPE | SIFT | PolyPhen | Tumor Sample Barcode | Tissue | Histology | Sex | Age | Stage | Therapy Types | Drugs | Outcome |
| POLG | SNV | Missense_Mutation | c.2993N>G | p.Ser998Trp | p.S998W | P54098 | protein_coding | deleterious(0.01) | probably_damaging(0.953) | TCGA-A8-A08R-01 | Breast | breast invasive carcinoma | Female | <65 | I/II | Unknown | Unknown | SD | |
| POLG | SNV | Missense_Mutation | c.1488N>T | p.Lys496Asn | p.K496N | P54098 | protein_coding | deleterious(0) | benign(0.052) | TCGA-AO-A0J3-01 | Breast | breast invasive carcinoma | Female | >=65 | I/II | Chemotherapy | cyclophosphamide | SD | |
| POLG | SNV | Missense_Mutation | c.1013G>A | p.Arg338Lys | p.R338K | P54098 | protein_coding | tolerated(1) | benign(0) | TCGA-BH-A209-01 | Breast | breast invasive carcinoma | Female | >=65 | I/II | Unknown | Unknown | SD | |
| POLG | SNV | Missense_Mutation | novel | c.736C>T | p.Pro246Ser | p.P246S | P54098 | protein_coding | deleterious(0.03) | probably_damaging(0.997) | TCGA-C8-A8HR-01 | Breast | breast invasive carcinoma | Female | <65 | III/IV | Chemotherapy | 5-fluorouracil | CR |
| POLG | SNV | Missense_Mutation | c.653N>T | p.Ser218Leu | p.S218L | P54098 | protein_coding | tolerated(0.22) | benign(0.041) | TCGA-D8-A1XK-01 | Breast | breast invasive carcinoma | Female | <65 | I/II | Chemotherapy | doxorubicine+cyclophosphamide | SD | |
| POLG | insertion | Nonsense_Mutation | novel | c.1805_1806insGTATTTTTAATTCAGTCACCC | p.Leu602_Met603insTyrPheTerPheSerHisPro | p.L602_M603insYF*FSHP | P54098 | protein_coding | TCGA-AN-A049-01 | Breast | breast invasive carcinoma | Female | <65 | I/II | Unknown | Unknown | SD | ||
| POLG | SNV | Missense_Mutation | rs757987765 | c.3004N>A | p.Glu1002Lys | p.E1002K | P54098 | protein_coding | tolerated(0.12) | probably_damaging(0.996) | TCGA-2W-A8YY-01 | Cervix | cervical & endocervical cancer | Female | <65 | I/II | Chemotherapy | cisplatin | CR |
| POLG | SNV | Missense_Mutation | rs373316463 | c.3257C>T | p.Ser1086Leu | p.S1086L | P54098 | protein_coding | tolerated(0.2) | benign(0.094) | TCGA-DR-A0ZM-01 | Cervix | cervical & endocervical cancer | Female | <65 | III/IV | Unspecific | Cisplatin | SD |
| POLG | SNV | Missense_Mutation | novel | c.1221N>G | p.Phe407Leu | p.F407L | P54098 | protein_coding | tolerated(0.72) | benign(0.368) | TCGA-VS-A9V1-01 | Cervix | cervical & endocervical cancer | Female | <65 | I/II | Chemotherapy | cisplatin | PD |
| POLG | SNV | Missense_Mutation | novel | c.2193C>A | p.Ser731Arg | p.S731R | P54098 | protein_coding | tolerated(0.43) | benign(0.054) | TCGA-ZJ-A8QO-01 | Cervix | cervical & endocervical cancer | Female | >=65 | I/II | Unknown | Unknown | SD |
| Page: 1 2 3 4 5 6 7 8 9 |
Top |
Related drugs of malignant transformation related genes |
| Identification of chemicals and drugs interact with genes involved in malignant transfromation |
| (DGIdb 4.0) |
| Entrez ID | Symbol | Category | Interaction Types | Drug Claim Name | Drug Name | PMIDs |
| 5428 | POLG | ENZYME | Valproic Acid | |||
| 5428 | POLG | ENZYME | KASANOSIN A | KASANOSIN A | 18308572 | |
| 5428 | POLG | ENZYME | divalproex sodium | |||
| 5428 | POLG | ENZYME | KASANOSIN B | KASANOSIN B | 18308572 | |
| 5428 | POLG | ENZYME | valproic acid | 23448099,21357833,21686371,21455106,21038416,19054397,18208989,20138553 |
| Page: 1 |

Copyright 2023-Present -The University of Texas Health Science Center at Houston |