
|
|||||
|
 | |
| |
| |
| |
| |
| |
|
Gene: POLE4 |
Gene summary for POLE4 |
| Gene information | Species | Human | Gene symbol | POLE4 | Gene ID | 56655 |
| Gene name | DNA polymerase epsilon 4, accessory subunit | |
| Gene Alias | YHHQ1 | |
| Cytomap | 2p12 | |
| Gene Type | protein-coding | GO ID | GO:0006139 | UniProtAcc | Q9NR33 |
Top |
Malignant transformation analysis |
| Identification of the aberrant gene expression in precancerous and cancerous lesions by comparing the gene expression of stem-like cells in diseased tissues with normal stem cells |
| Entrez ID | Symbol | Replicates | Species | Organ | Tissue | Adj P-value | Log2FC | Malignancy |
| 56655 | POLE4 | HTA11_2487_2000001011 | Human | Colorectum | SER | 4.76e-04 | 1.92e-01 | -0.1808 |
| 56655 | POLE4 | HTA11_1938_2000001011 | Human | Colorectum | AD | 3.59e-07 | 3.42e-01 | -0.0811 |
| 56655 | POLE4 | HTA11_347_2000001011 | Human | Colorectum | AD | 3.77e-09 | 2.37e-01 | -0.1954 |
| 56655 | POLE4 | HTA11_411_2000001011 | Human | Colorectum | SER | 4.02e-03 | 3.54e-01 | -0.2602 |
| 56655 | POLE4 | HTA11_3361_2000001011 | Human | Colorectum | AD | 1.74e-03 | 2.18e-01 | -0.1207 |
| 56655 | POLE4 | HTA11_83_2000001011 | Human | Colorectum | SER | 4.54e-08 | 3.58e-01 | -0.1526 |
| 56655 | POLE4 | HTA11_696_2000001011 | Human | Colorectum | AD | 1.26e-03 | 2.34e-01 | -0.1464 |
| 56655 | POLE4 | HTA11_1391_2000001011 | Human | Colorectum | AD | 1.07e-08 | 2.99e-01 | -0.059 |
| 56655 | POLE4 | HTA11_2992_2000001011 | Human | Colorectum | SER | 5.70e-03 | 2.84e-01 | -0.1706 |
| 56655 | POLE4 | HTA11_546_2000001011 | Human | Colorectum | AD | 7.09e-05 | 3.11e-01 | -0.0842 |
| 56655 | POLE4 | HTA11_866_3004761011 | Human | Colorectum | AD | 1.77e-03 | 1.56e-01 | 0.096 |
| 56655 | POLE4 | HTA11_7696_3000711011 | Human | Colorectum | AD | 1.61e-02 | 2.09e-01 | 0.0674 |
| 56655 | POLE4 | HTA11_6818_2000001021 | Human | Colorectum | AD | 1.03e-02 | 1.69e-01 | 0.0588 |
| 56655 | POLE4 | HTA11_99999970781_79442 | Human | Colorectum | MSS | 1.74e-03 | 2.24e-01 | 0.294 |
| 56655 | POLE4 | HTA11_99999973899_84307 | Human | Colorectum | MSS | 1.84e-02 | 3.11e-01 | 0.2585 |
| 56655 | POLE4 | HTA11_99999974143_84620 | Human | Colorectum | MSS | 2.79e-06 | 2.65e-01 | 0.3005 |
| 56655 | POLE4 | LZE2D | Human | Esophagus | HGIN | 1.27e-02 | 4.47e-01 | 0.0642 |
| 56655 | POLE4 | LZE2T | Human | Esophagus | ESCC | 3.22e-03 | 9.46e-01 | 0.082 |
| 56655 | POLE4 | LZE4T | Human | Esophagus | ESCC | 5.23e-17 | 4.52e-01 | 0.0811 |
| 56655 | POLE4 | LZE5T | Human | Esophagus | ESCC | 1.54e-03 | 4.67e-01 | 0.0514 |
| Page: 1 2 3 4 5 6 7 8 |
| Tissue | Expression Dynamics | Abbreviation |
| Colorectum (GSE201348) |  | FAP: Familial adenomatous polyposis |
| CRC: Colorectal cancer | ||
| Colorectum (HTA11) |  | AD: Adenomas |
| SER: Sessile serrated lesions | ||
| MSI-H: Microsatellite-high colorectal cancer | ||
| MSS: Microsatellite stable colorectal cancer | ||
| Esophagus | 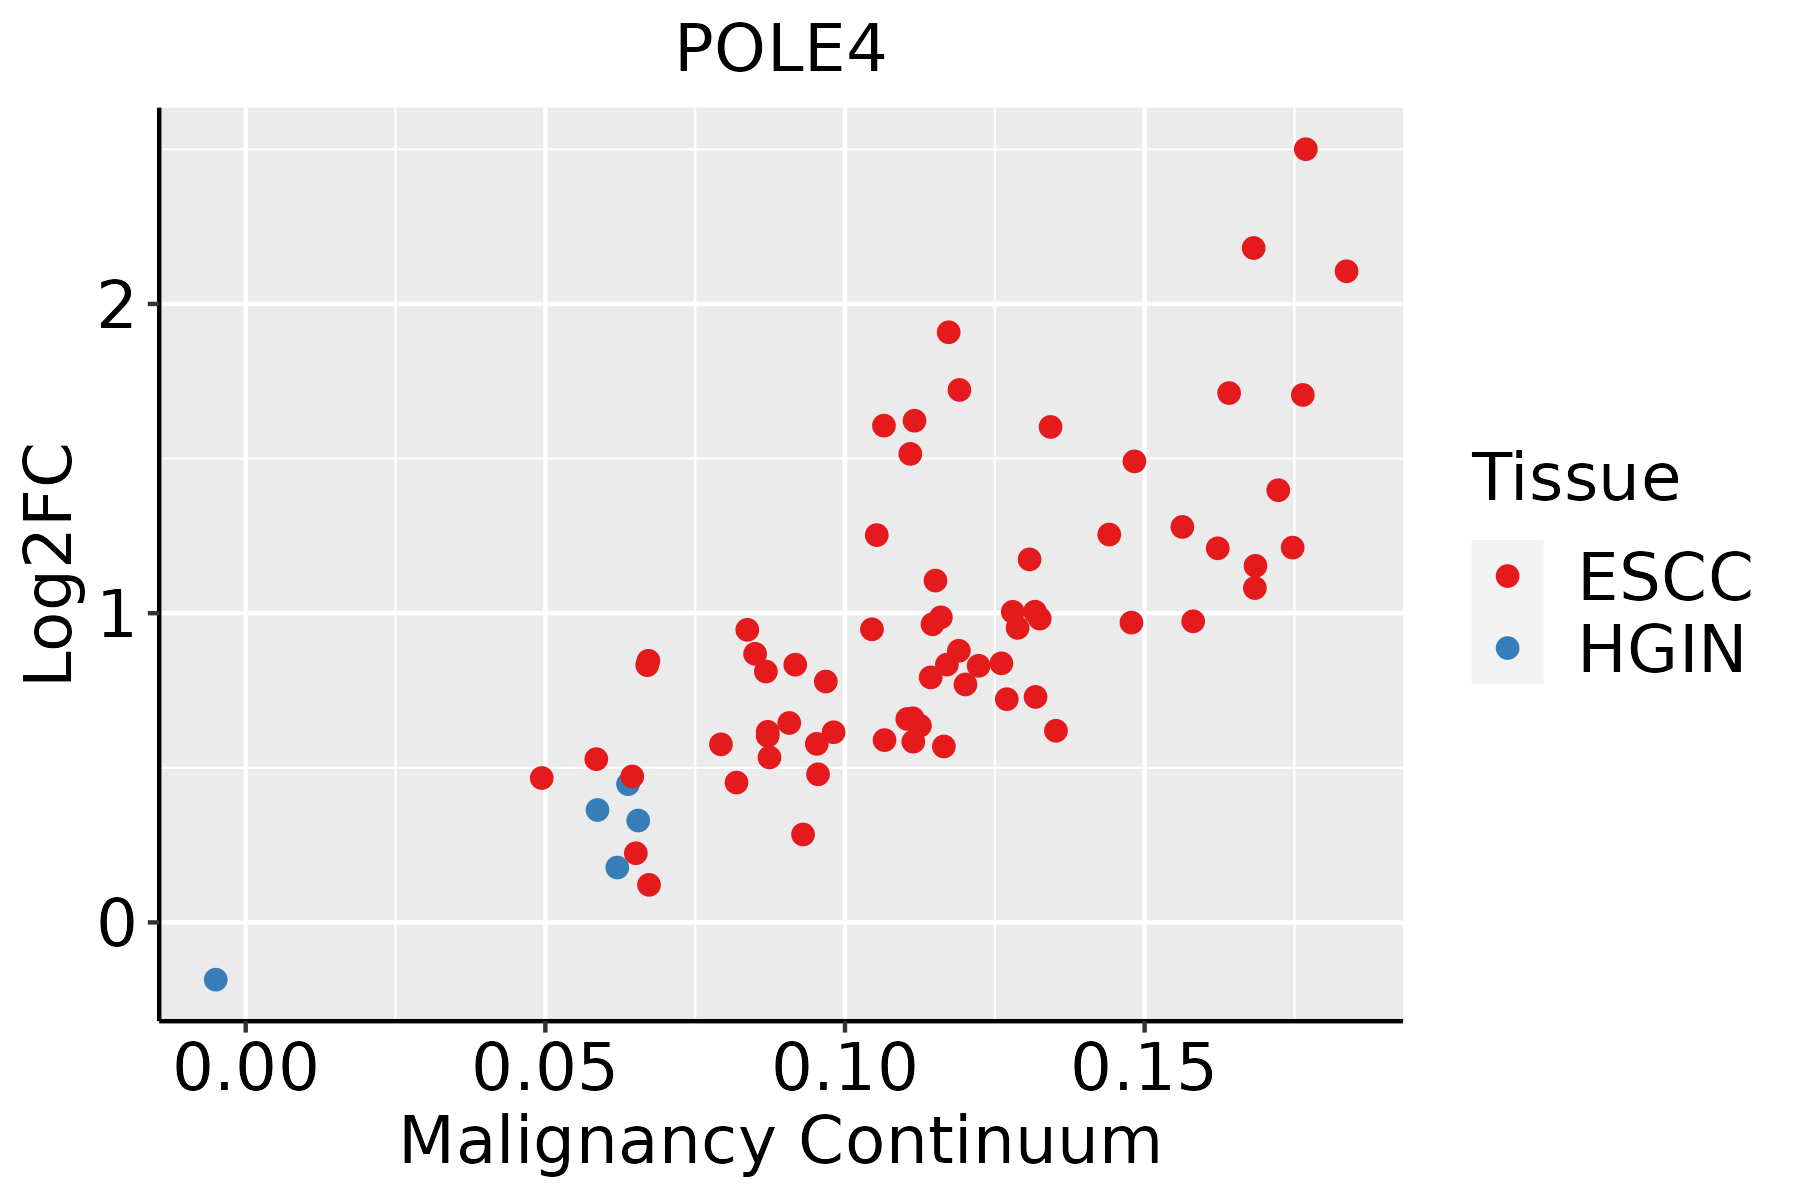 | ESCC: Esophageal squamous cell carcinoma |
| HGIN: High-grade intraepithelial neoplasias | ||
| LGIN: Low-grade intraepithelial neoplasias | ||
| Liver | 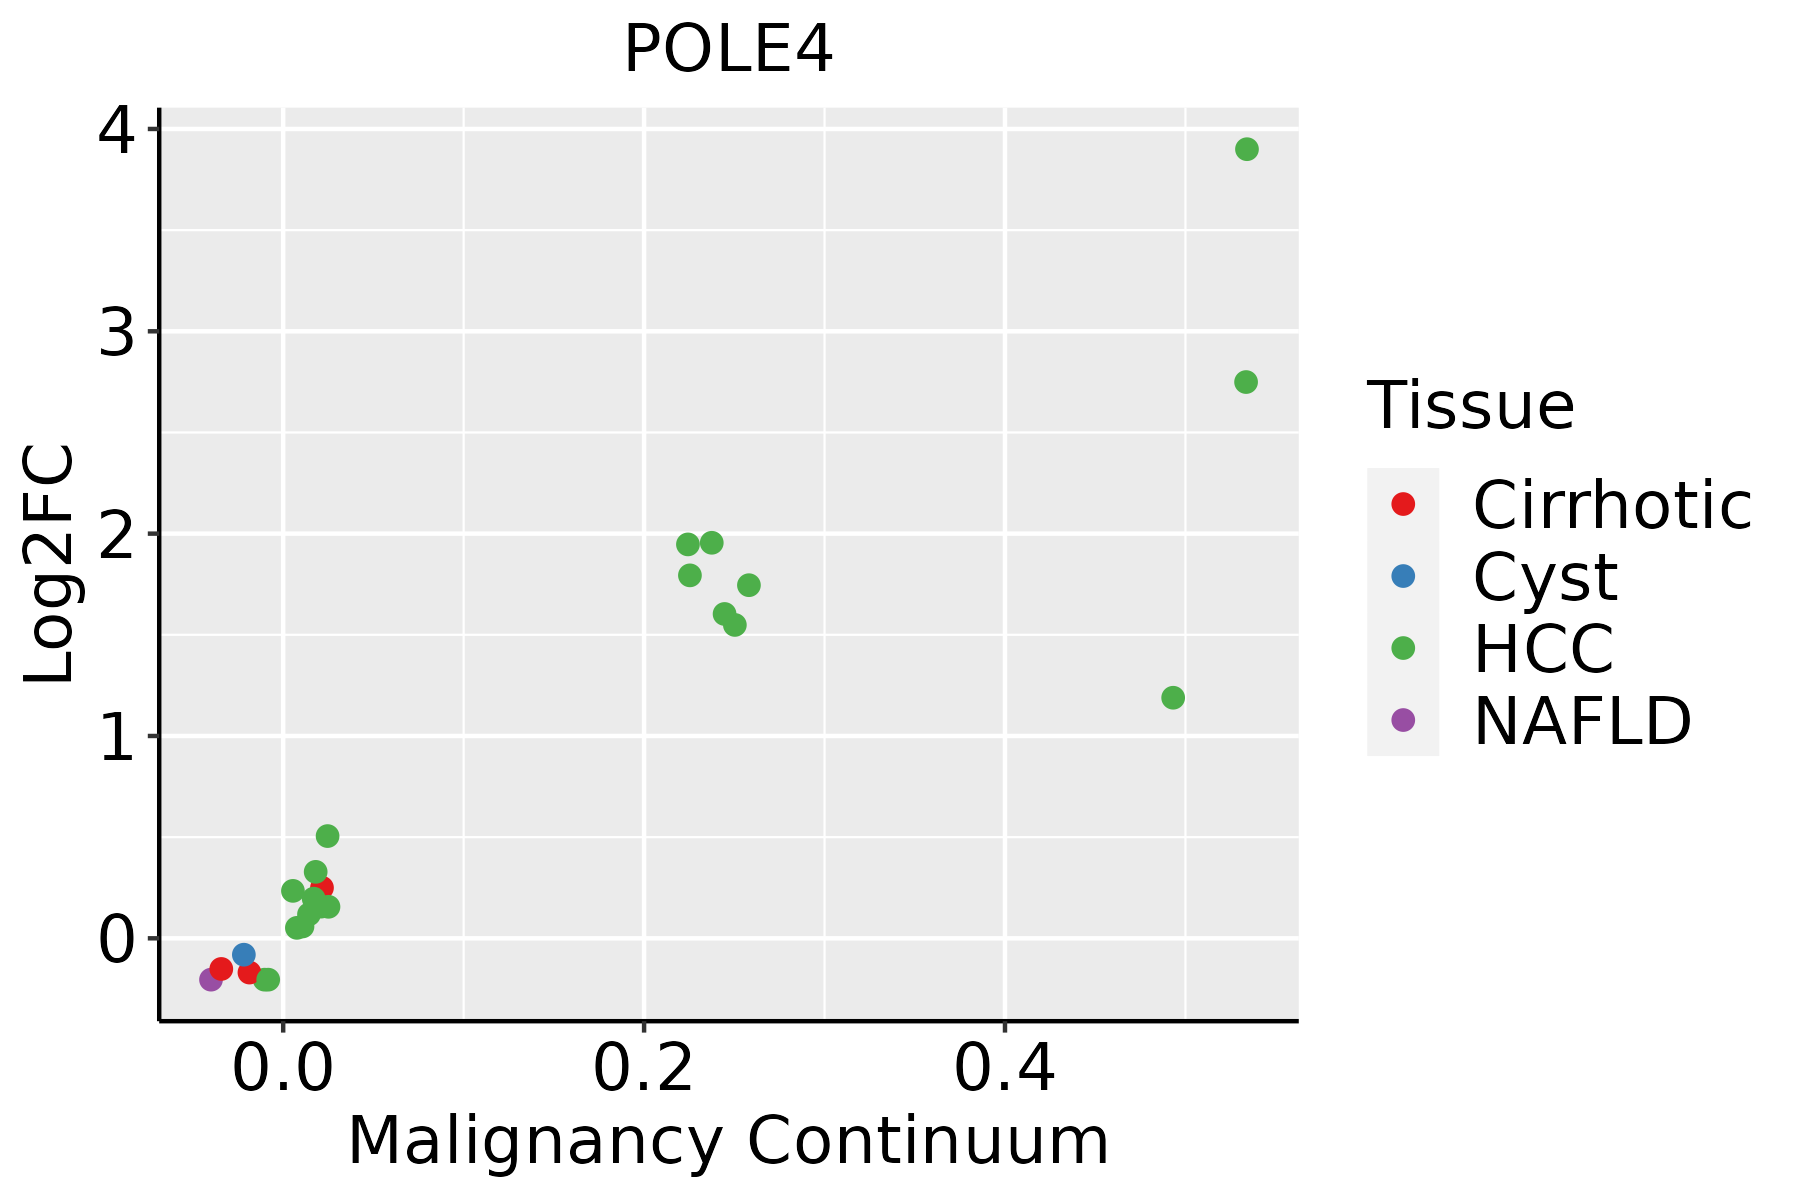 | HCC: Hepatocellular carcinoma |
| NAFLD: Non-alcoholic fatty liver disease | ||
| Oral Cavity |  | EOLP: Erosive Oral lichen planus |
| LP: leukoplakia | ||
| NEOLP: Non-erosive oral lichen planus | ||
| OSCC: Oral squamous cell carcinoma | ||
| Skin |  | AK: Actinic keratosis |
| cSCC: Cutaneous squamous cell carcinoma | ||
| SCCIS:squamous cell carcinoma in situ | ||
| Thyroid |  | ATC: Anaplastic thyroid cancer |
| HT: Hashimoto's thyroiditis | ||
| PTC: Papillary thyroid cancer |
| ∗log2FC in expression of this searched gene in stem-like cells from each diseased tissue sample relative to stem-like cells in normal samples in each tissue plotted against the malignancy continuum. Samples are colored based on if they are from different disease stage. |
Top |
Malignant transformation related pathway analysis |
| Find out the enriched GO biological processes and KEGG pathways involved in transition from healthy to precancer to cancer |
| Tissue | Disease Stage | Enriched GO biological Processes |
| Colorectum | AD |  |
| Colorectum | SER |  |
| Colorectum | MSS |  |
| Colorectum | MSI-H |  |
| Colorectum | FAP |  |
| ∗Top 15 enriched GO BP terms are showed in the bar plot of each disease state in each tissue. Each row represents a significant GO biological process which is colored according to the -log10(p.adjust). |
| Page: 1 2 3 4 5 6 7 8 9 |
| GO ID | Tissue | Disease Stage | Description | Gene Ratio | Bg Ratio | pvalue | p.adjust | Count |
| GO:0071897 | Colorectum | AD | DNA biosynthetic process | 55/3918 | 180/18723 | 1.46e-03 | 1.24e-02 | 55 |
| GO:00718971 | Colorectum | SER | DNA biosynthetic process | 43/2897 | 180/18723 | 1.99e-03 | 1.98e-02 | 43 |
| GO:00718972 | Colorectum | MSS | DNA biosynthetic process | 50/3467 | 180/18723 | 1.45e-03 | 1.35e-02 | 50 |
| GO:007189710 | Esophagus | HGIN | DNA biosynthetic process | 44/2587 | 180/18723 | 8.97e-05 | 1.96e-03 | 44 |
| GO:007189716 | Esophagus | ESCC | DNA biosynthetic process | 127/8552 | 180/18723 | 1.04e-11 | 3.85e-10 | 127 |
| GO:00718975 | Liver | HCC | DNA biosynthetic process | 99/7958 | 180/18723 | 4.66e-04 | 3.08e-03 | 99 |
| GO:00718979 | Oral cavity | OSCC | DNA biosynthetic process | 106/7305 | 180/18723 | 4.86e-08 | 8.95e-07 | 106 |
| GO:007189715 | Oral cavity | LP | DNA biosynthetic process | 71/4623 | 180/18723 | 8.04e-06 | 1.52e-04 | 71 |
| GO:007189718 | Skin | cSCC | DNA biosynthetic process | 74/4864 | 180/18723 | 6.33e-06 | 8.92e-05 | 74 |
| GO:0071897110 | Thyroid | PTC | DNA biosynthetic process | 82/5968 | 180/18723 | 7.98e-05 | 6.81e-04 | 82 |
| GO:007189723 | Thyroid | ATC | DNA biosynthetic process | 91/6293 | 180/18723 | 1.84e-06 | 2.24e-05 | 91 |
| Page: 1 |
| Pathway ID | Tissue | Disease Stage | Description | Gene Ratio | Bg Ratio | pvalue | p.adjust | qvalue | Count |
| hsa034205 | Esophagus | HGIN | Nucleotide excision repair | 29/1383 | 63/8465 | 2.96e-08 | 5.36e-07 | 4.26e-07 | 29 |
| hsa0342012 | Esophagus | HGIN | Nucleotide excision repair | 29/1383 | 63/8465 | 2.96e-08 | 5.36e-07 | 4.26e-07 | 29 |
| hsa0342022 | Esophagus | ESCC | Nucleotide excision repair | 54/4205 | 63/8465 | 2.01e-09 | 2.17e-08 | 1.11e-08 | 54 |
| hsa034104 | Esophagus | ESCC | Base excision repair | 38/4205 | 44/8465 | 3.59e-07 | 2.62e-06 | 1.34e-06 | 38 |
| hsa030304 | Esophagus | ESCC | DNA replication | 32/4205 | 36/8465 | 7.71e-07 | 5.06e-06 | 2.59e-06 | 32 |
| hsa0342032 | Esophagus | ESCC | Nucleotide excision repair | 54/4205 | 63/8465 | 2.01e-09 | 2.17e-08 | 1.11e-08 | 54 |
| hsa0341011 | Esophagus | ESCC | Base excision repair | 38/4205 | 44/8465 | 3.59e-07 | 2.62e-06 | 1.34e-06 | 38 |
| hsa0303011 | Esophagus | ESCC | DNA replication | 32/4205 | 36/8465 | 7.71e-07 | 5.06e-06 | 2.59e-06 | 32 |
| hsa03420 | Liver | Cirrhotic | Nucleotide excision repair | 29/2530 | 63/8465 | 4.81e-03 | 1.74e-02 | 1.07e-02 | 29 |
| hsa034201 | Liver | Cirrhotic | Nucleotide excision repair | 29/2530 | 63/8465 | 4.81e-03 | 1.74e-02 | 1.07e-02 | 29 |
| hsa034202 | Liver | HCC | Nucleotide excision repair | 41/4020 | 63/8465 | 3.59e-03 | 1.12e-02 | 6.22e-03 | 41 |
| hsa034203 | Liver | HCC | Nucleotide excision repair | 41/4020 | 63/8465 | 3.59e-03 | 1.12e-02 | 6.22e-03 | 41 |
| hsa034204 | Oral cavity | OSCC | Nucleotide excision repair | 49/3704 | 63/8465 | 3.48e-08 | 2.91e-07 | 1.48e-07 | 49 |
| hsa03030 | Oral cavity | OSCC | DNA replication | 31/3704 | 36/8465 | 1.70e-07 | 1.19e-06 | 6.03e-07 | 31 |
| hsa03410 | Oral cavity | OSCC | Base excision repair | 32/3704 | 44/8465 | 9.11e-05 | 3.25e-04 | 1.65e-04 | 32 |
| hsa0342011 | Oral cavity | OSCC | Nucleotide excision repair | 49/3704 | 63/8465 | 3.48e-08 | 2.91e-07 | 1.48e-07 | 49 |
| hsa030301 | Oral cavity | OSCC | DNA replication | 31/3704 | 36/8465 | 1.70e-07 | 1.19e-06 | 6.03e-07 | 31 |
| hsa034101 | Oral cavity | OSCC | Base excision repair | 32/3704 | 44/8465 | 9.11e-05 | 3.25e-04 | 1.65e-04 | 32 |
| hsa0342021 | Oral cavity | LP | Nucleotide excision repair | 37/2418 | 63/8465 | 5.14e-07 | 6.33e-06 | 4.08e-06 | 37 |
| hsa030302 | Oral cavity | LP | DNA replication | 23/2418 | 36/8465 | 1.08e-05 | 7.79e-05 | 5.02e-05 | 23 |
| Page: 1 2 |
Top |
Cell-cell communication analysis |
| Identification of potential cell-cell interactions between two cell types and their ligand-receptor pairs for different disease states |
| Ligand | Receptor | LRpair | Pathway | Tissue | Disease Stage |
| Page: 1 |
Top |
Single-cell gene regulatory network inference analysis |
| Find out the significant the regulons (TFs) and the target genes of each regulon across cell types for different disease states |
| TF | Cell Type | Tissue | Disease Stage | Target Gene | RSS | Regulon Activity |
| POLE4 | MLUM | Breast | DCIS | COX6A1,UQCR11,RPS26, etc. | 6.44e-01 |  |
| POLE4 | TAC | Colorectum | Healthy | CXXC1,KRT18,CST3, etc. | 5.94e-02 |  |
| POLE4 | ABS | Colorectum | Healthy | CXXC1,KRT18,CST3, etc. | 3.56e-01 | |
| POLE4 | ASC | Colorectum | Healthy | CXXC1,KRT18,CST3, etc. | 1.15e-01 | |
| POLE4 | STM | Colorectum | Healthy | CXXC1,KRT18,CST3, etc. | 1.41e-01 | |
| POLE4 | MON | Liver | Cirrhotic | S100A9,S100A8,CSTA, etc. | 4.91e-01 |  |
| POLE4 | MON | Liver | HCC | S100A9,S100A8,CSTA, etc. | 2.56e-02 |  |
| POLE4 | PVA | Liver | Cirrhotic | LOX,CCL14,ZNF784, etc. | 4.18e-01 | |
| POLE4 | SEC | Liver | Healthy | LOX,CCL14,ZNF784, etc. | 7.14e-01 |  |
| POLE4 | ALVMAC | Lung | ADJ | S100A8,S100A9,S100A12, etc. | 1.29e-01 |  |
| ∗The dot plots of a searched regulon are shown for all cell subpopulations in each disease state of each tissue based on the regulon specific score inferred using pySCENIC and by calculating the average expression. |
| Page: 1 2 |
Top |
Somatic mutation of malignant transformation related genes |
| Annotation of somatic variants for genes involved in malignant transformation |
| Hugo Symbol | Variant Class | Variant Classification | dbSNP RS | HGVSc | HGVSp | HGVSp Short | SWISSPROT | BIOTYPE | SIFT | PolyPhen | Tumor Sample Barcode | Tissue | Histology | Sex | Age | Stage | Therapy Types | Drugs | Outcome |
| POLE4 | SNV | Missense_Mutation | novel | c.202G>A | p.Ala68Thr | p.A68T | Q9NR33 | protein_coding | tolerated(0.29) | benign(0.078) | TCGA-AX-A2HA-01 | Endometrium | uterine corpus endometrioid carcinoma | Female | <65 | I/II | Unknown | Unknown | SD |
| POLE4 | SNV | Missense_Mutation | novel | c.272N>T | p.Arg91Met | p.R91M | Q9NR33 | protein_coding | deleterious(0) | probably_damaging(1) | TCGA-B5-A3FA-01 | Endometrium | uterine corpus endometrioid carcinoma | Female | >=65 | I/II | Unknown | Unknown | SD |
| POLE4 | SNV | Missense_Mutation | rs199691810 | c.307N>G | p.Ile103Val | p.I103V | Q9NR33 | protein_coding | tolerated(0.1) | benign(0.325) | TCGA-34-5234-01 | Lung | lung squamous cell carcinoma | Female | >=65 | I/II | Unknown | Unknown | SD |
| Page: 1 |
Top |
Related drugs of malignant transformation related genes |
| Identification of chemicals and drugs interact with genes involved in malignant transfromation |
| (DGIdb 4.0) |
| Entrez ID | Symbol | Category | Interaction Types | Drug Claim Name | Drug Name | PMIDs |
| Page: 1 |

Copyright 2023-Present -The University of Texas Health Science Center at Houston |