
|
|||||
|
 | |
| |
| |
| |
| |
| |
|
Gene: POLE3 |
Gene summary for POLE3 |
| Gene information | Species | Human | Gene symbol | POLE3 | Gene ID | 54107 |
| Gene name | DNA polymerase epsilon 3, accessory subunit | |
| Gene Alias | CHARAC17 | |
| Cytomap | 9q32 | |
| Gene Type | protein-coding | GO ID | GO:0006139 | UniProtAcc | A0A024R829 |
Top |
Malignant transformation analysis |
| Identification of the aberrant gene expression in precancerous and cancerous lesions by comparing the gene expression of stem-like cells in diseased tissues with normal stem cells |
| Entrez ID | Symbol | Replicates | Species | Organ | Tissue | Adj P-value | Log2FC | Malignancy |
| 54107 | POLE3 | HTA11_347_2000001011 | Human | Colorectum | AD | 3.82e-03 | 1.64e-01 | -0.1954 |
| 54107 | POLE3 | HTA11_1391_2000001011 | Human | Colorectum | AD | 1.01e-05 | 3.27e-01 | -0.059 |
| 54107 | POLE3 | HTA11_866_3004761011 | Human | Colorectum | AD | 2.92e-02 | 2.00e-01 | 0.096 |
| 54107 | POLE3 | HTA11_7469_2000001011 | Human | Colorectum | AD | 3.65e-06 | 5.58e-01 | -0.0124 |
| 54107 | POLE3 | HTA11_99999970781_79442 | Human | Colorectum | MSS | 3.66e-10 | 3.33e-01 | 0.294 |
| 54107 | POLE3 | HTA11_99999965062_69753 | Human | Colorectum | MSI-H | 5.85e-04 | 5.88e-01 | 0.3487 |
| 54107 | POLE3 | HTA11_99999965104_69814 | Human | Colorectum | MSS | 1.85e-08 | 3.15e-01 | 0.281 |
| 54107 | POLE3 | HTA11_99999971662_82457 | Human | Colorectum | MSS | 1.55e-07 | 2.82e-01 | 0.3859 |
| 54107 | POLE3 | LZE2T | Human | Esophagus | ESCC | 1.71e-05 | 9.21e-01 | 0.082 |
| 54107 | POLE3 | LZE4T | Human | Esophagus | ESCC | 7.85e-18 | 3.60e-01 | 0.0811 |
| 54107 | POLE3 | LZE5T | Human | Esophagus | ESCC | 2.52e-03 | 3.83e-01 | 0.0514 |
| 54107 | POLE3 | LZE7T | Human | Esophagus | ESCC | 3.50e-11 | 6.67e-01 | 0.0667 |
| 54107 | POLE3 | LZE8T | Human | Esophagus | ESCC | 5.04e-06 | 2.27e-01 | 0.067 |
| 54107 | POLE3 | LZE20T | Human | Esophagus | ESCC | 1.24e-17 | 5.56e-01 | 0.0662 |
| 54107 | POLE3 | LZE22D1 | Human | Esophagus | HGIN | 9.07e-04 | 4.08e-02 | 0.0595 |
| 54107 | POLE3 | LZE22T | Human | Esophagus | ESCC | 6.06e-07 | 3.83e-01 | 0.068 |
| 54107 | POLE3 | LZE24T | Human | Esophagus | ESCC | 1.25e-22 | 5.73e-01 | 0.0596 |
| 54107 | POLE3 | LZE21T | Human | Esophagus | ESCC | 4.92e-03 | 4.25e-01 | 0.0655 |
| 54107 | POLE3 | LZE6T | Human | Esophagus | ESCC | 1.68e-08 | 4.12e-01 | 0.0845 |
| 54107 | POLE3 | P1T-E | Human | Esophagus | ESCC | 5.35e-14 | 4.77e-01 | 0.0875 |
| Page: 1 2 3 4 5 6 7 |
| Tissue | Expression Dynamics | Abbreviation |
| Colorectum (GSE201348) | 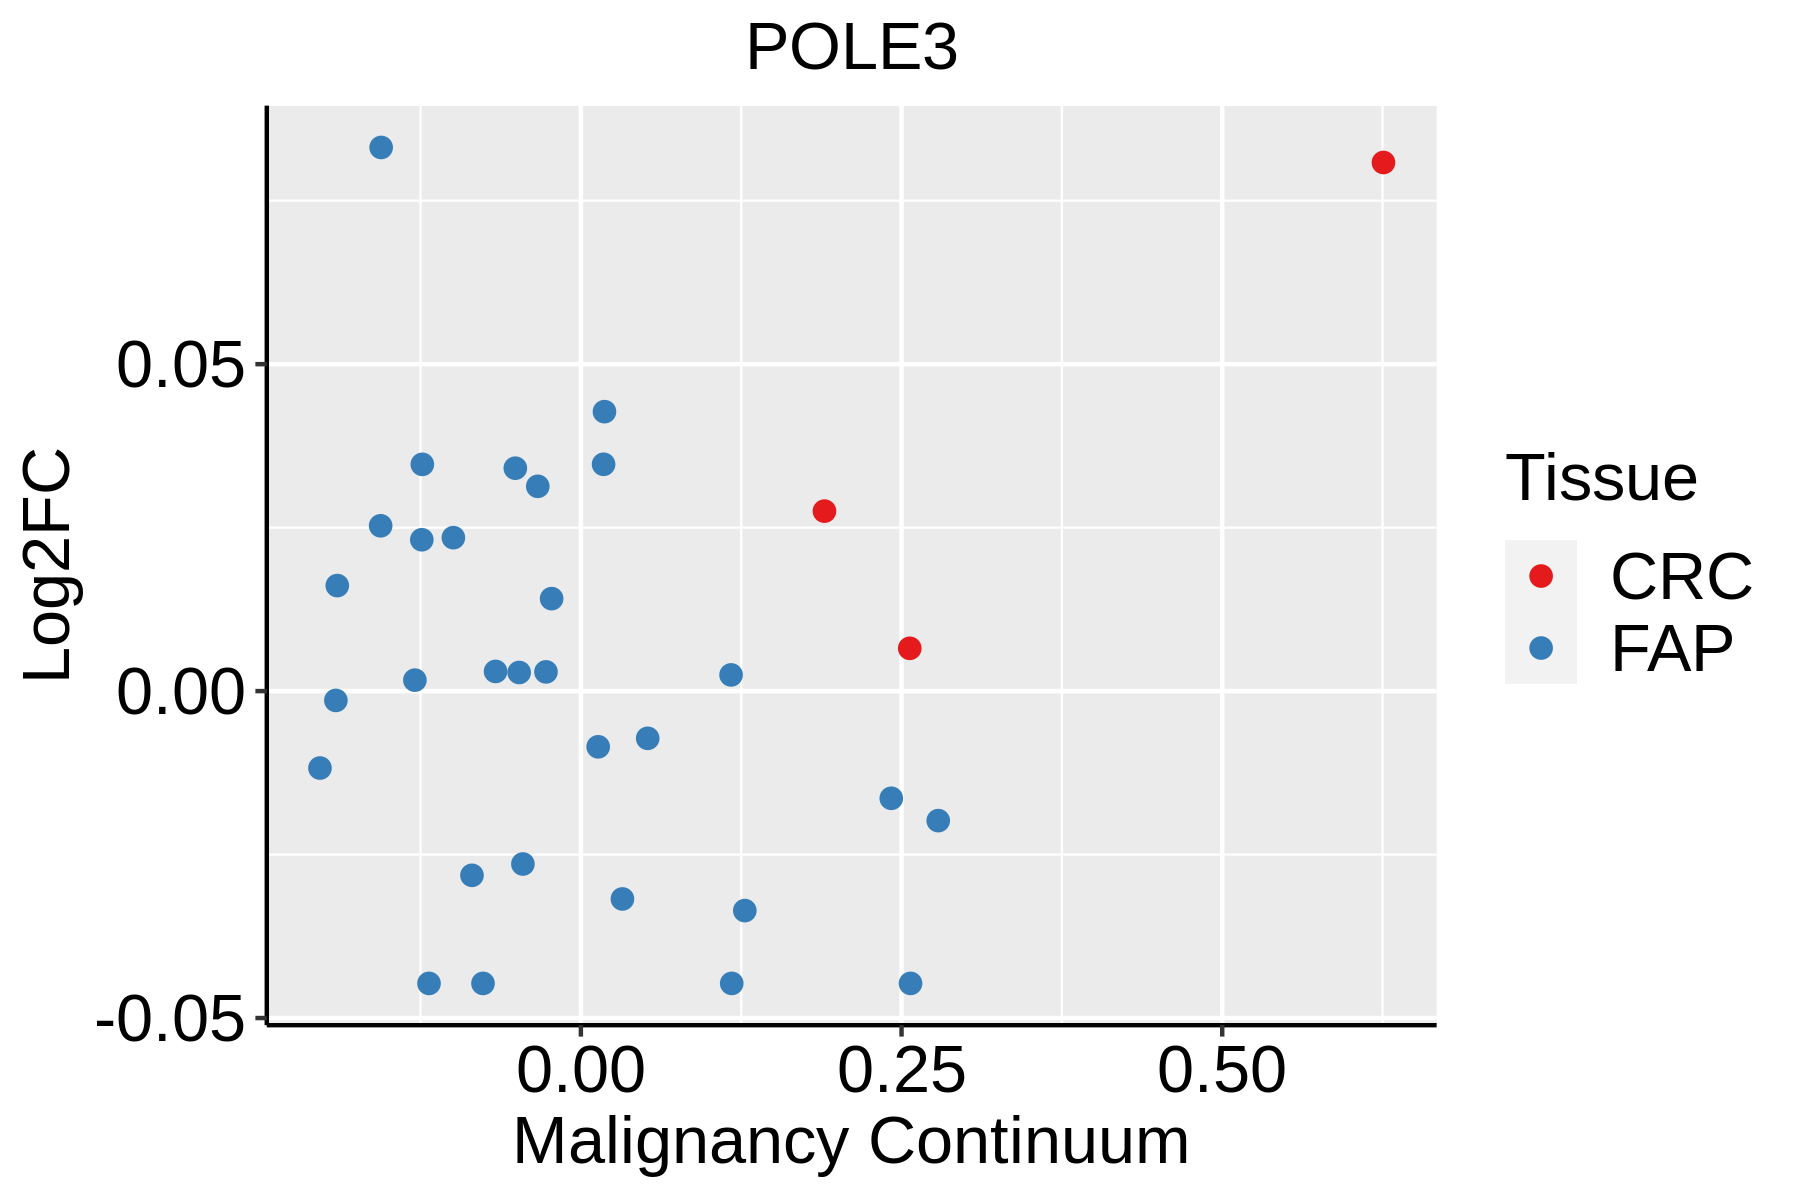 | FAP: Familial adenomatous polyposis |
| CRC: Colorectal cancer | ||
| Colorectum (HTA11) |  | AD: Adenomas |
| SER: Sessile serrated lesions | ||
| MSI-H: Microsatellite-high colorectal cancer | ||
| MSS: Microsatellite stable colorectal cancer | ||
| Esophagus | 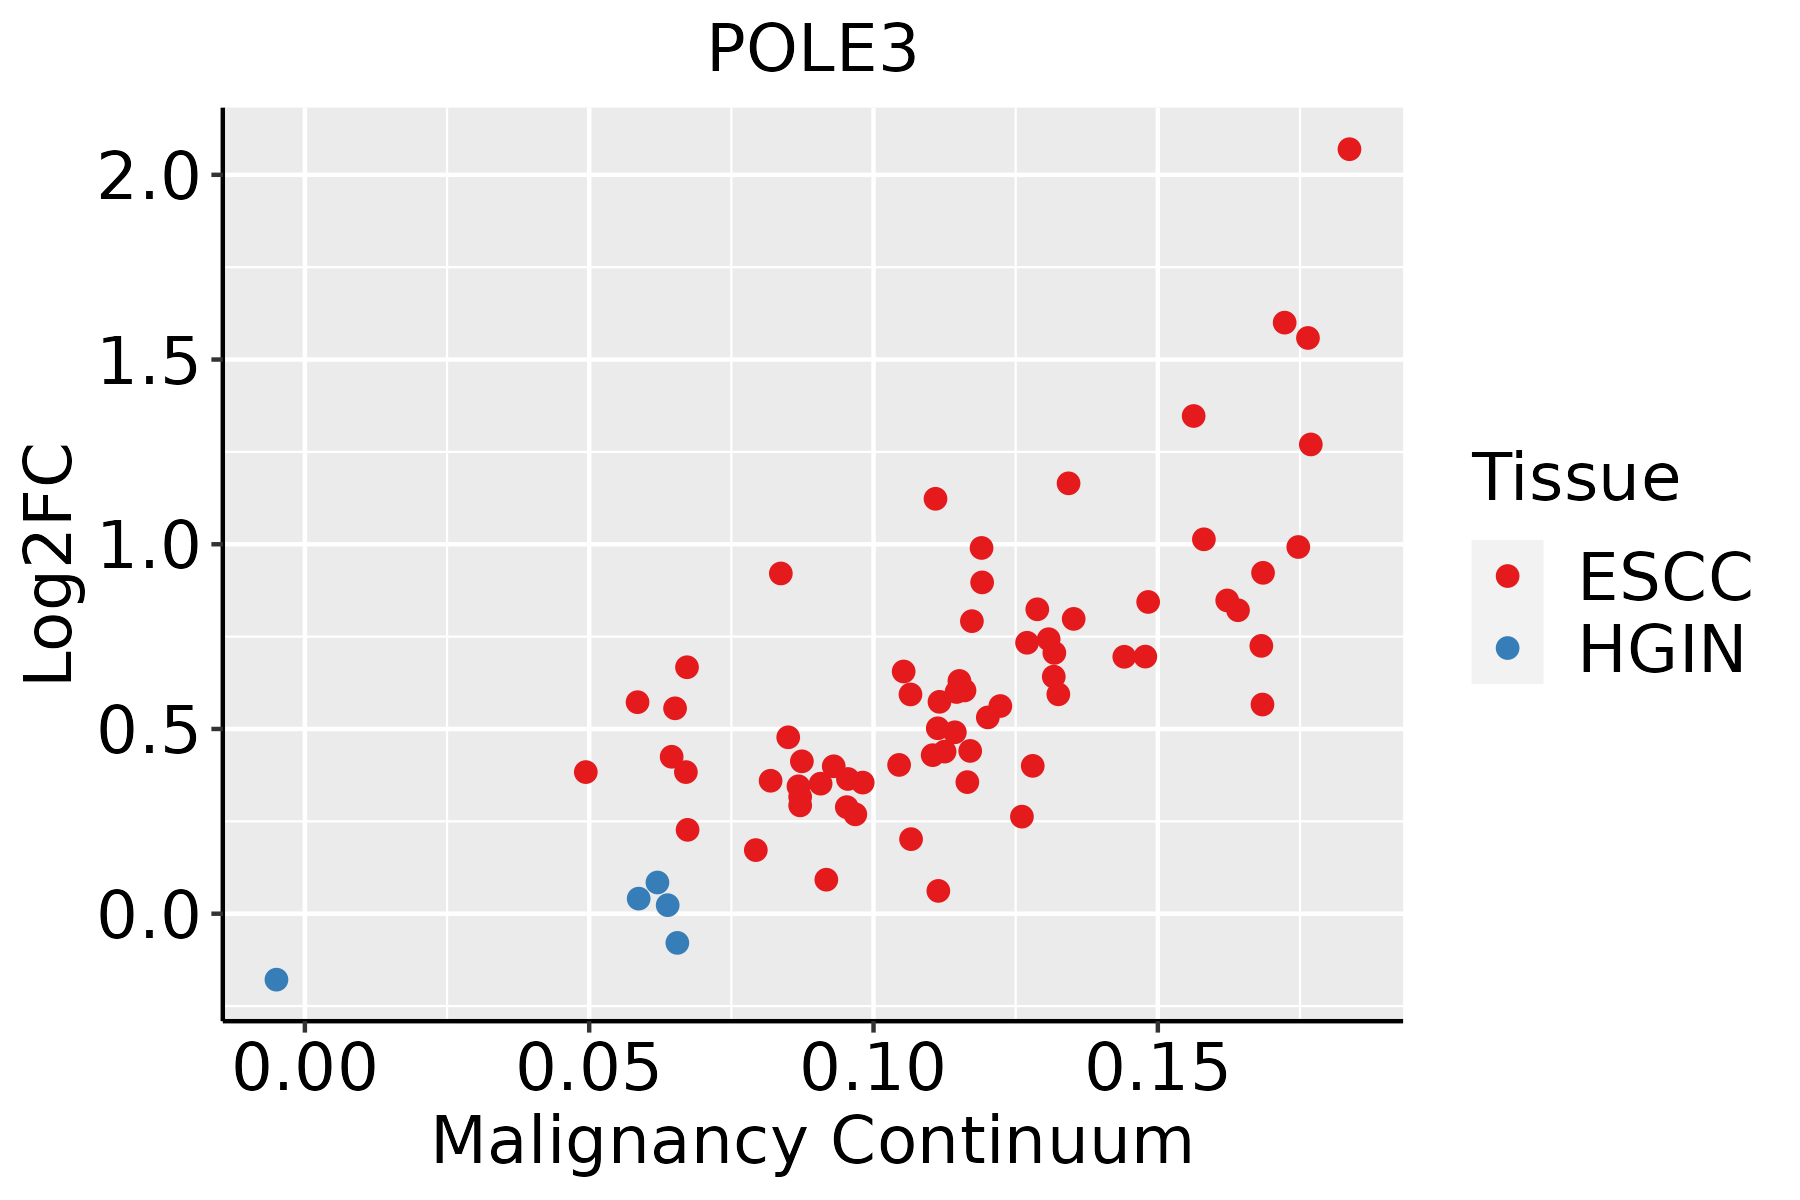 | ESCC: Esophageal squamous cell carcinoma |
| HGIN: High-grade intraepithelial neoplasias | ||
| LGIN: Low-grade intraepithelial neoplasias | ||
| Liver | 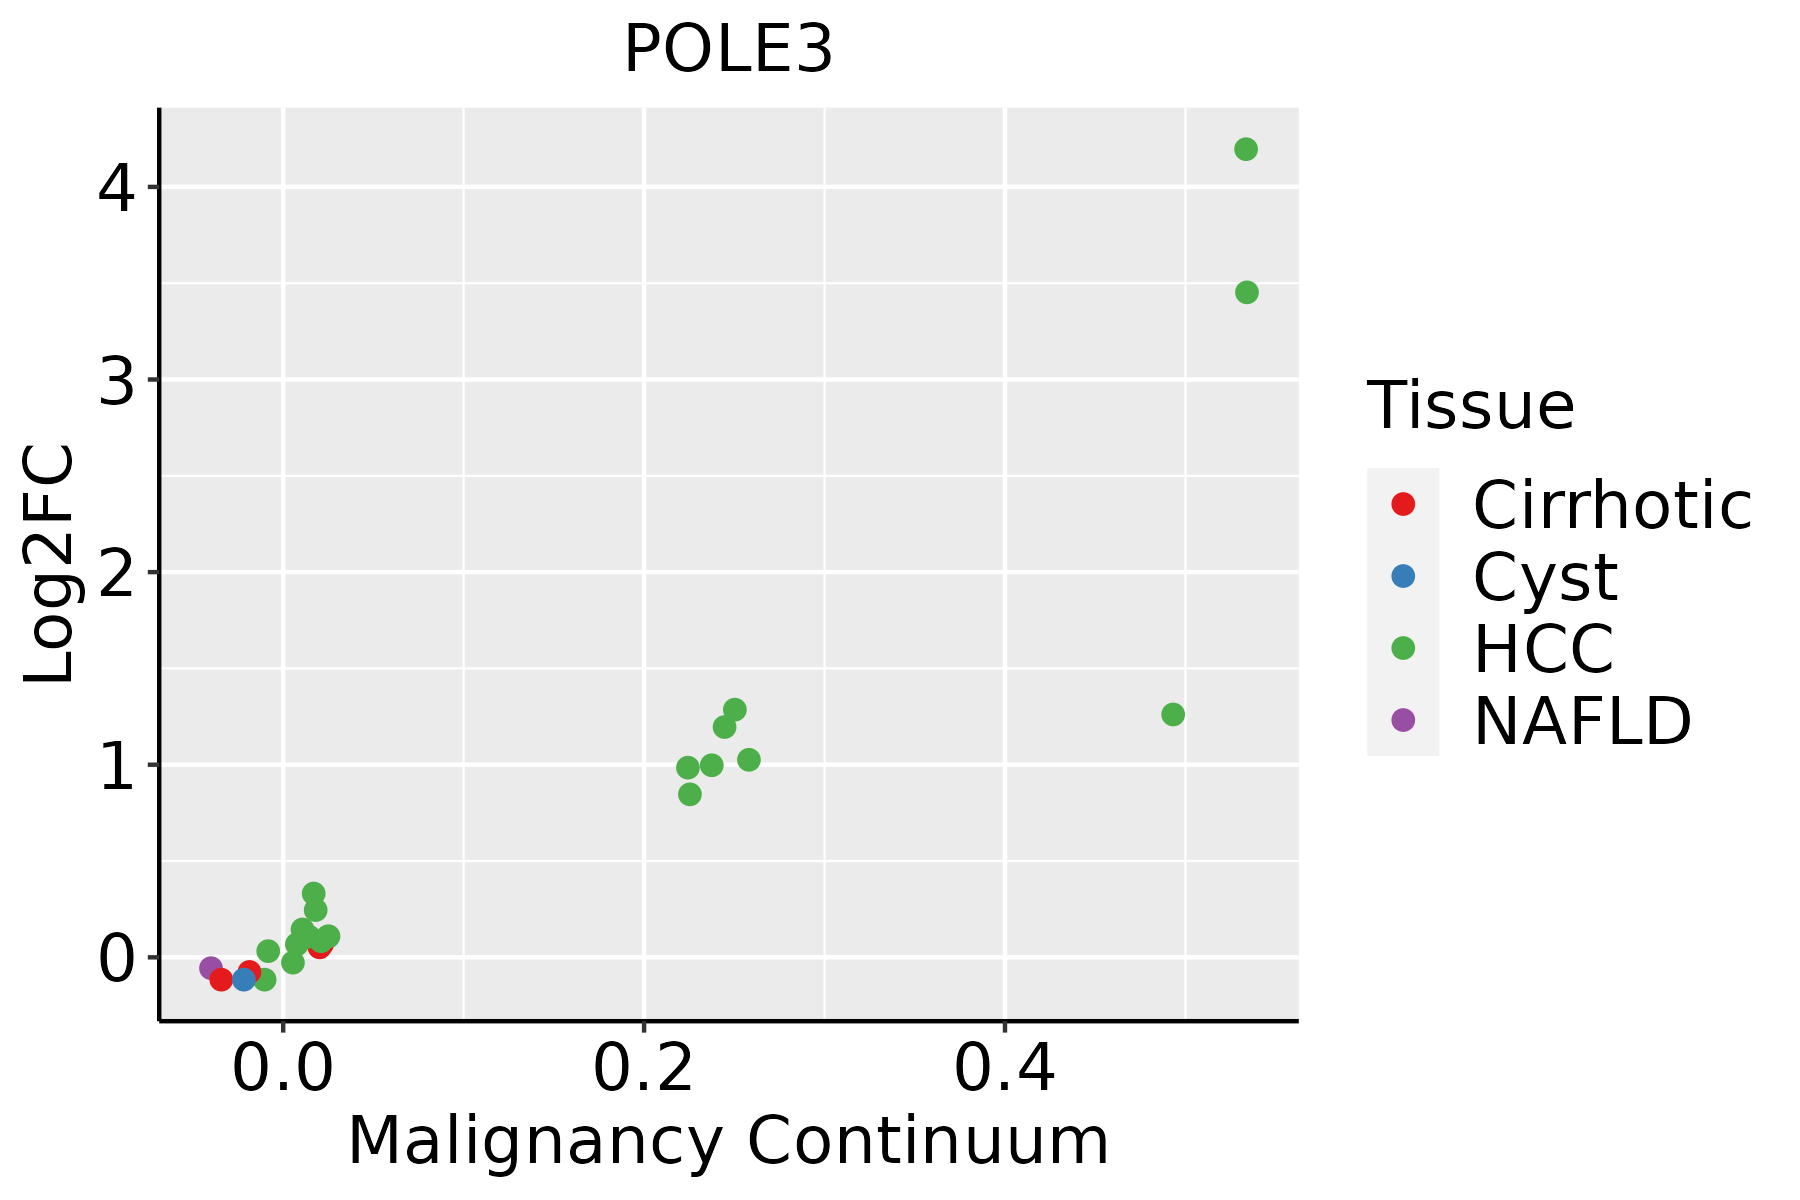 | HCC: Hepatocellular carcinoma |
| NAFLD: Non-alcoholic fatty liver disease | ||
| Oral Cavity |  | EOLP: Erosive Oral lichen planus |
| LP: leukoplakia | ||
| NEOLP: Non-erosive oral lichen planus | ||
| OSCC: Oral squamous cell carcinoma | ||
| Skin |  | AK: Actinic keratosis |
| cSCC: Cutaneous squamous cell carcinoma | ||
| SCCIS:squamous cell carcinoma in situ | ||
| Thyroid | 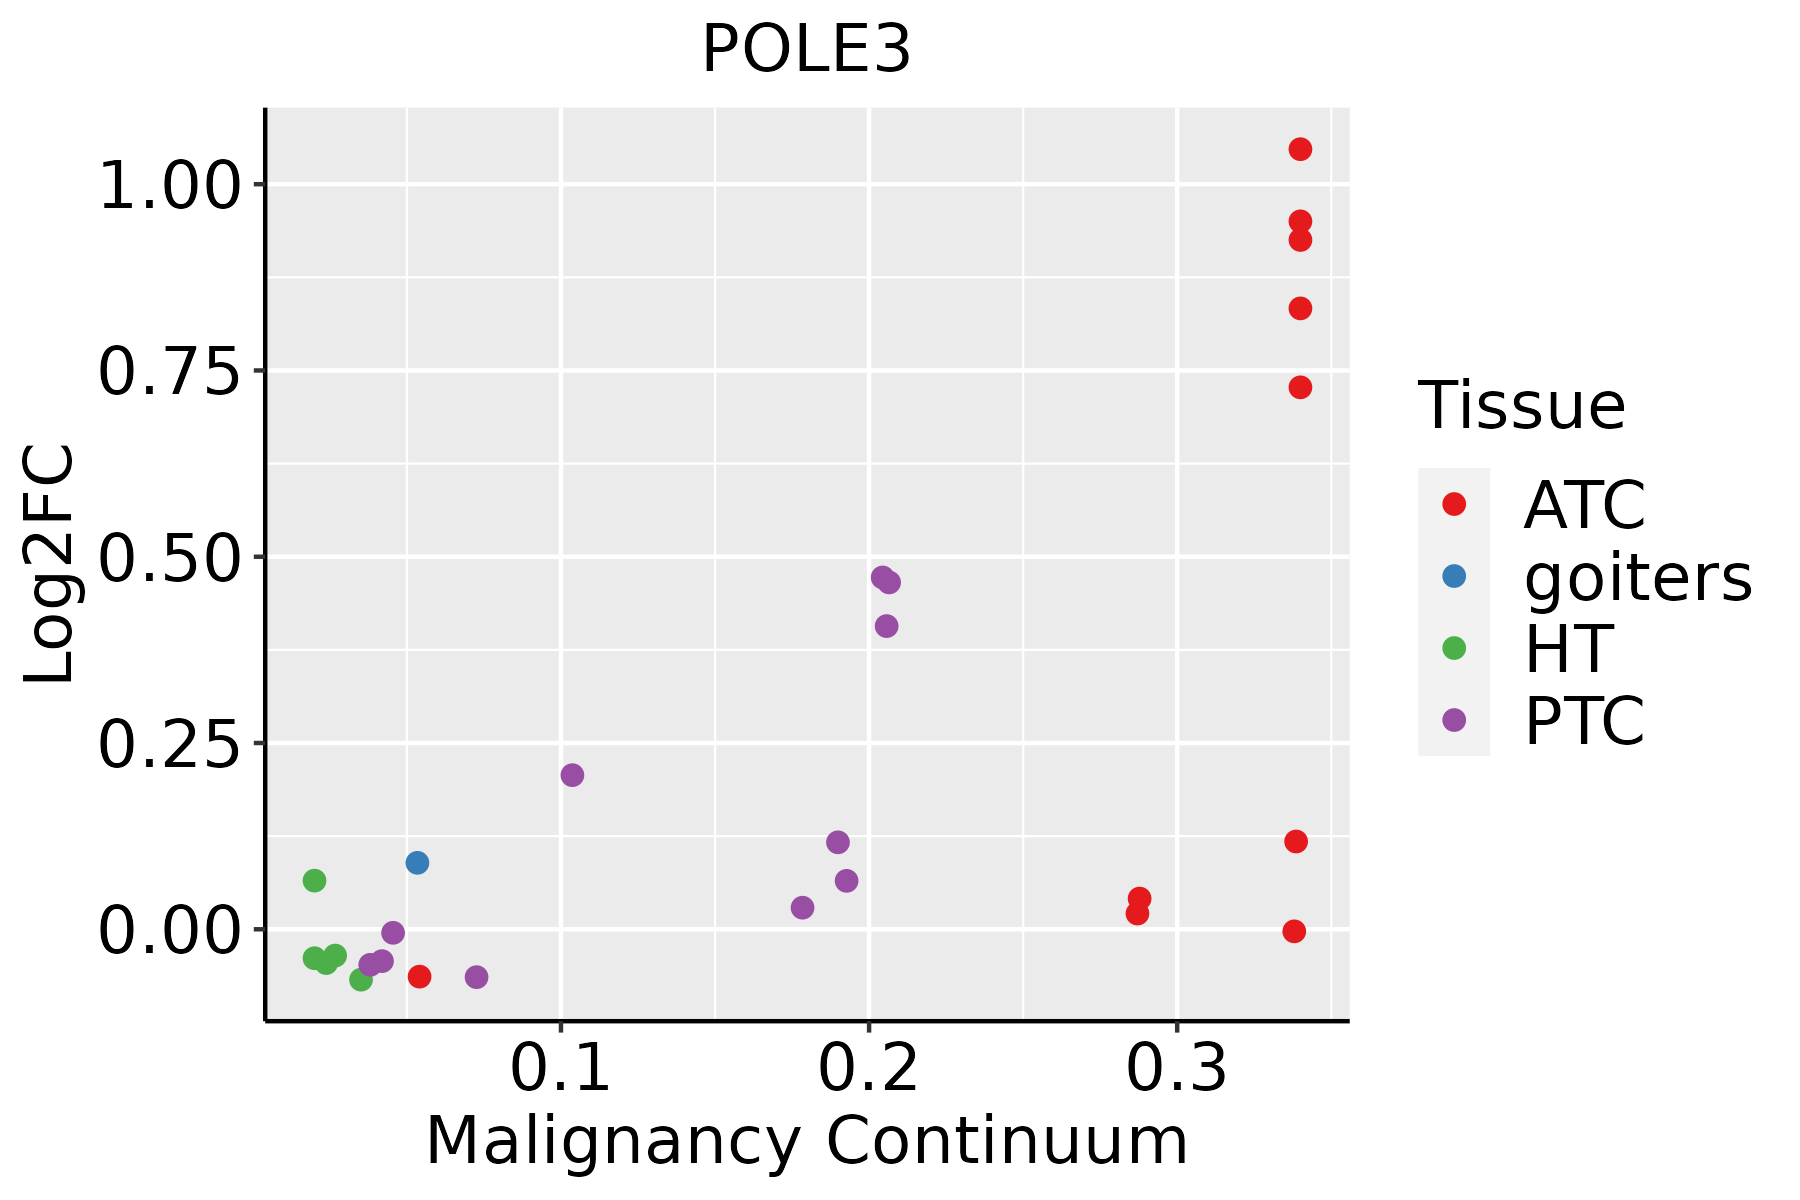 | ATC: Anaplastic thyroid cancer |
| HT: Hashimoto's thyroiditis | ||
| PTC: Papillary thyroid cancer |
| ∗log2FC in expression of this searched gene in stem-like cells from each diseased tissue sample relative to stem-like cells in normal samples in each tissue plotted against the malignancy continuum. Samples are colored based on if they are from different disease stage. |
Top |
Malignant transformation related pathway analysis |
| Find out the enriched GO biological processes and KEGG pathways involved in transition from healthy to precancer to cancer |
| Tissue | Disease Stage | Enriched GO biological Processes |
| Colorectum | AD |  |
| Colorectum | SER |  |
| Colorectum | MSS |  |
| Colorectum | MSI-H |  |
| Colorectum | FAP |  |
| ∗Top 15 enriched GO BP terms are showed in the bar plot of each disease state in each tissue. Each row represents a significant GO biological process which is colored according to the -log10(p.adjust). |
| Page: 1 2 3 4 5 6 7 8 9 |
| GO ID | Tissue | Disease Stage | Description | Gene Ratio | Bg Ratio | pvalue | p.adjust | Count |
| GO:0006325 | Colorectum | AD | chromatin organization | 119/3918 | 409/18723 | 4.85e-05 | 8.33e-04 | 119 |
| GO:0071897 | Colorectum | AD | DNA biosynthetic process | 55/3918 | 180/18723 | 1.46e-03 | 1.24e-02 | 55 |
| GO:0006338 | Colorectum | AD | chromatin remodeling | 70/3918 | 255/18723 | 7.44e-03 | 4.53e-02 | 70 |
| GO:00063252 | Colorectum | MSS | chromatin organization | 107/3467 | 409/18723 | 7.22e-05 | 1.21e-03 | 107 |
| GO:0016570 | Colorectum | MSS | histone modification | 113/3467 | 463/18723 | 8.37e-04 | 8.68e-03 | 113 |
| GO:00718972 | Colorectum | MSS | DNA biosynthetic process | 50/3467 | 180/18723 | 1.45e-03 | 1.35e-02 | 50 |
| GO:00718973 | Colorectum | MSI-H | DNA biosynthetic process | 26/1319 | 180/18723 | 3.73e-04 | 8.56e-03 | 26 |
| GO:0006260 | Colorectum | MSI-H | DNA replication | 31/1319 | 260/18723 | 2.83e-03 | 3.63e-02 | 31 |
| GO:00182057 | Esophagus | HGIN | peptidyl-lysine modification | 88/2587 | 376/18723 | 2.99e-07 | 1.39e-05 | 88 |
| GO:000632516 | Esophagus | HGIN | chromatin organization | 92/2587 | 409/18723 | 1.05e-06 | 4.16e-05 | 92 |
| GO:007189710 | Esophagus | HGIN | DNA biosynthetic process | 44/2587 | 180/18723 | 8.97e-05 | 1.96e-03 | 44 |
| GO:00165708 | Esophagus | HGIN | histone modification | 92/2587 | 463/18723 | 1.70e-04 | 3.30e-03 | 92 |
| GO:00064735 | Esophagus | HGIN | protein acetylation | 45/2587 | 201/18723 | 6.17e-04 | 8.58e-03 | 45 |
| GO:00183945 | Esophagus | HGIN | peptidyl-lysine acetylation | 39/2587 | 169/18723 | 7.46e-04 | 9.90e-03 | 39 |
| GO:00435435 | Esophagus | HGIN | protein acylation | 51/2587 | 243/18723 | 1.33e-03 | 1.57e-02 | 51 |
| GO:00064755 | Esophagus | HGIN | internal protein amino acid acetylation | 36/2587 | 160/18723 | 1.87e-03 | 2.01e-02 | 36 |
| GO:00183935 | Esophagus | HGIN | internal peptidyl-lysine acetylation | 35/2587 | 158/18723 | 2.82e-03 | 2.75e-02 | 35 |
| GO:001657015 | Esophagus | ESCC | histone modification | 323/8552 | 463/18723 | 2.61e-26 | 7.88e-24 | 323 |
| GO:001820514 | Esophagus | ESCC | peptidyl-lysine modification | 259/8552 | 376/18723 | 3.90e-20 | 5.26e-18 | 259 |
| GO:00062604 | Esophagus | ESCC | DNA replication | 181/8552 | 260/18723 | 3.55e-15 | 2.05e-13 | 181 |
| Page: 1 2 3 4 5 6 7 |
| Pathway ID | Tissue | Disease Stage | Description | Gene Ratio | Bg Ratio | pvalue | p.adjust | qvalue | Count |
| hsa034205 | Esophagus | HGIN | Nucleotide excision repair | 29/1383 | 63/8465 | 2.96e-08 | 5.36e-07 | 4.26e-07 | 29 |
| hsa0342012 | Esophagus | HGIN | Nucleotide excision repair | 29/1383 | 63/8465 | 2.96e-08 | 5.36e-07 | 4.26e-07 | 29 |
| hsa0342022 | Esophagus | ESCC | Nucleotide excision repair | 54/4205 | 63/8465 | 2.01e-09 | 2.17e-08 | 1.11e-08 | 54 |
| hsa034104 | Esophagus | ESCC | Base excision repair | 38/4205 | 44/8465 | 3.59e-07 | 2.62e-06 | 1.34e-06 | 38 |
| hsa030304 | Esophagus | ESCC | DNA replication | 32/4205 | 36/8465 | 7.71e-07 | 5.06e-06 | 2.59e-06 | 32 |
| hsa0342032 | Esophagus | ESCC | Nucleotide excision repair | 54/4205 | 63/8465 | 2.01e-09 | 2.17e-08 | 1.11e-08 | 54 |
| hsa0341011 | Esophagus | ESCC | Base excision repair | 38/4205 | 44/8465 | 3.59e-07 | 2.62e-06 | 1.34e-06 | 38 |
| hsa0303011 | Esophagus | ESCC | DNA replication | 32/4205 | 36/8465 | 7.71e-07 | 5.06e-06 | 2.59e-06 | 32 |
| hsa034202 | Liver | HCC | Nucleotide excision repair | 41/4020 | 63/8465 | 3.59e-03 | 1.12e-02 | 6.22e-03 | 41 |
| hsa034203 | Liver | HCC | Nucleotide excision repair | 41/4020 | 63/8465 | 3.59e-03 | 1.12e-02 | 6.22e-03 | 41 |
| hsa034204 | Oral cavity | OSCC | Nucleotide excision repair | 49/3704 | 63/8465 | 3.48e-08 | 2.91e-07 | 1.48e-07 | 49 |
| hsa03030 | Oral cavity | OSCC | DNA replication | 31/3704 | 36/8465 | 1.70e-07 | 1.19e-06 | 6.03e-07 | 31 |
| hsa03410 | Oral cavity | OSCC | Base excision repair | 32/3704 | 44/8465 | 9.11e-05 | 3.25e-04 | 1.65e-04 | 32 |
| hsa0342011 | Oral cavity | OSCC | Nucleotide excision repair | 49/3704 | 63/8465 | 3.48e-08 | 2.91e-07 | 1.48e-07 | 49 |
| hsa030301 | Oral cavity | OSCC | DNA replication | 31/3704 | 36/8465 | 1.70e-07 | 1.19e-06 | 6.03e-07 | 31 |
| hsa034101 | Oral cavity | OSCC | Base excision repair | 32/3704 | 44/8465 | 9.11e-05 | 3.25e-04 | 1.65e-04 | 32 |
| hsa0342021 | Oral cavity | LP | Nucleotide excision repair | 37/2418 | 63/8465 | 5.14e-07 | 6.33e-06 | 4.08e-06 | 37 |
| hsa030302 | Oral cavity | LP | DNA replication | 23/2418 | 36/8465 | 1.08e-05 | 7.79e-05 | 5.02e-05 | 23 |
| hsa034102 | Oral cavity | LP | Base excision repair | 23/2418 | 44/8465 | 7.66e-04 | 3.75e-03 | 2.42e-03 | 23 |
| hsa0342031 | Oral cavity | LP | Nucleotide excision repair | 37/2418 | 63/8465 | 5.14e-07 | 6.33e-06 | 4.08e-06 | 37 |
| Page: 1 2 |
Top |
Cell-cell communication analysis |
| Identification of potential cell-cell interactions between two cell types and their ligand-receptor pairs for different disease states |
| Ligand | Receptor | LRpair | Pathway | Tissue | Disease Stage |
| Page: 1 |
Top |
Single-cell gene regulatory network inference analysis |
| Find out the significant the regulons (TFs) and the target genes of each regulon across cell types for different disease states |
| TF | Cell Type | Tissue | Disease Stage | Target Gene | RSS | Regulon Activity |
| POLE3 | STM | Cervix | CC | CDC25B,MCM7,RBM14, etc. | 1.26e-01 |  |
| POLE3 | STM | Colorectum | ADJ | DDX3Y,NCL,SPR, etc. | 5.37e-02 |  |
| POLE3 | CD8TEREX | Lung | AIS | PEX14,GPR171,LAIR2, etc. | 7.76e-03 |  |
| POLE3 | MDSC | Lung | AIS | PEX14,GPR171,LAIR2, etc. | 4.74e-04 | |
| POLE3 | ICAF | Lung | Healthy | LCN6,GIN1,LYSMD4, etc. | 3.39e-01 |  |
| ∗The dot plots of a searched regulon are shown for all cell subpopulations in each disease state of each tissue based on the regulon specific score inferred using pySCENIC and by calculating the average expression. |
| Page: 1 |
Top |
Somatic mutation of malignant transformation related genes |
| Annotation of somatic variants for genes involved in malignant transformation |
| Hugo Symbol | Variant Class | Variant Classification | dbSNP RS | HGVSc | HGVSp | HGVSp Short | SWISSPROT | BIOTYPE | SIFT | PolyPhen | Tumor Sample Barcode | Tissue | Histology | Sex | Age | Stage | Therapy Types | Drugs | Outcome |
| POLE3 | SNV | Missense_Mutation | rs757755582 | c.284N>G | p.Glu95Gly | p.E95G | Q9NRF9 | protein_coding | tolerated(0.31) | benign(0.003) | TCGA-A2-A0CS-01 | Breast | breast invasive carcinoma | Female | >=65 | III/IV | Hormone Therapy | anastrozole | SD |
| POLE3 | SNV | Missense_Mutation | rs757755582 | c.284N>G | p.Glu95Gly | p.E95G | Q9NRF9 | protein_coding | tolerated(0.31) | benign(0.003) | TCGA-A8-A06R-01 | Breast | breast invasive carcinoma | Female | >=65 | I/II | Chemotherapy | 5-fluorouracil | CR |
| POLE3 | SNV | Missense_Mutation | rs757755582 | c.284A>G | p.Glu95Gly | p.E95G | Q9NRF9 | protein_coding | tolerated(0.31) | benign(0.003) | TCGA-C8-A12X-01 | Breast | breast invasive carcinoma | Female | <65 | I/II | Unknown | Unknown | SD |
| POLE3 | SNV | Missense_Mutation | rs757755582 | c.284N>G | p.Glu95Gly | p.E95G | Q9NRF9 | protein_coding | tolerated(0.31) | benign(0.003) | TCGA-D8-A1XG-01 | Breast | breast invasive carcinoma | Female | >=65 | III/IV | Unknown | Unknown | SD |
| POLE3 | insertion | Frame_Shift_Ins | novel | c.388_389insGAAGGAAGGAAGGA | p.Asp130GlyfsTer21 | p.D130Gfs*21 | Q9NRF9 | protein_coding | TCGA-DS-A1OA-01 | Cervix | cervical & endocervical cancer | Female | >=65 | I/II | Chemotherapy | carboplatin | PD | ||
| POLE3 | SNV | Missense_Mutation | c.188N>T | p.Thr63Met | p.T63M | Q9NRF9 | protein_coding | deleterious(0.02) | probably_damaging(0.997) | TCGA-AA-3811-01 | Colorectum | colon adenocarcinoma | Female | >=65 | III/IV | Unknown | Unknown | PD | |
| POLE3 | SNV | Missense_Mutation | c.181C>T | p.Arg61Trp | p.R61W | Q9NRF9 | protein_coding | deleterious(0) | probably_damaging(0.998) | TCGA-AA-A010-01 | Colorectum | colon adenocarcinoma | Female | <65 | I/II | Chemotherapy | folinic | CR | |
| POLE3 | SNV | Missense_Mutation | novel | c.303N>T | p.Glu101Asp | p.E101D | Q9NRF9 | protein_coding | tolerated(0.4) | benign(0.093) | TCGA-AP-A059-01 | Endometrium | uterine corpus endometrioid carcinoma | Female | >=65 | I/II | Unknown | Unknown | SD |
| POLE3 | SNV | Missense_Mutation | rs748152611 | c.4N>A | p.Ala2Thr | p.A2T | Q9NRF9 | protein_coding | deleterious(0.03) | possibly_damaging(0.614) | TCGA-AP-A1DK-01 | Endometrium | uterine corpus endometrioid carcinoma | Female | <65 | I/II | Unknown | Unknown | SD |
| POLE3 | SNV | Missense_Mutation | novel | c.375N>T | p.Glu125Asp | p.E125D | Q9NRF9 | protein_coding | tolerated(0.25) | benign(0) | TCGA-AX-A06F-01 | Endometrium | uterine corpus endometrioid carcinoma | Female | <65 | III/IV | Chemotherapy | carboplatin | SD |
| Page: 1 2 |
Top |
Related drugs of malignant transformation related genes |
| Identification of chemicals and drugs interact with genes involved in malignant transfromation |
| (DGIdb 4.0) |
| Entrez ID | Symbol | Category | Interaction Types | Drug Claim Name | Drug Name | PMIDs |
| Page: 1 |

Copyright 2023-Present -The University of Texas Health Science Center at Houston |