
|
|||||
|
 | |
| |
| |
| |
| |
| |
|
Gene: POLE2 |
Gene summary for POLE2 |
| Gene information | Species | Human | Gene symbol | POLE2 | Gene ID | 5427 |
| Gene name | DNA polymerase epsilon 2, accessory subunit | |
| Gene Alias | DPE2 | |
| Cytomap | 14q21.3 | |
| Gene Type | protein-coding | GO ID | GO:0000731 | UniProtAcc | P56282 |
Top |
Malignant transformation analysis |
| Identification of the aberrant gene expression in precancerous and cancerous lesions by comparing the gene expression of stem-like cells in diseased tissues with normal stem cells |
| Entrez ID | Symbol | Replicates | Species | Organ | Tissue | Adj P-value | Log2FC | Malignancy |
| 5427 | POLE2 | P2T-E | Human | Esophagus | ESCC | 1.96e-05 | 1.22e-01 | 0.1177 |
| 5427 | POLE2 | P4T-E | Human | Esophagus | ESCC | 3.03e-11 | 2.80e-01 | 0.1323 |
| 5427 | POLE2 | P5T-E | Human | Esophagus | ESCC | 1.77e-22 | 3.90e-01 | 0.1327 |
| 5427 | POLE2 | P8T-E | Human | Esophagus | ESCC | 1.88e-04 | 1.05e-01 | 0.0889 |
| 5427 | POLE2 | P10T-E | Human | Esophagus | ESCC | 7.90e-03 | 1.07e-01 | 0.116 |
| 5427 | POLE2 | P15T-E | Human | Esophagus | ESCC | 3.58e-03 | 1.64e-01 | 0.1149 |
| 5427 | POLE2 | P21T-E | Human | Esophagus | ESCC | 4.17e-05 | 1.18e-01 | 0.1617 |
| 5427 | POLE2 | P23T-E | Human | Esophagus | ESCC | 3.50e-07 | 1.13e-01 | 0.108 |
| 5427 | POLE2 | P24T-E | Human | Esophagus | ESCC | 4.44e-08 | 2.11e-01 | 0.1287 |
| 5427 | POLE2 | P26T-E | Human | Esophagus | ESCC | 1.96e-05 | 1.40e-01 | 0.1276 |
| 5427 | POLE2 | P27T-E | Human | Esophagus | ESCC | 9.53e-09 | 1.69e-01 | 0.1055 |
| 5427 | POLE2 | P31T-E | Human | Esophagus | ESCC | 3.97e-04 | 1.39e-01 | 0.1251 |
| 5427 | POLE2 | P37T-E | Human | Esophagus | ESCC | 8.36e-06 | 1.74e-01 | 0.1371 |
| 5427 | POLE2 | P49T-E | Human | Esophagus | ESCC | 1.11e-07 | 5.40e-01 | 0.1768 |
| 5427 | POLE2 | P52T-E | Human | Esophagus | ESCC | 8.56e-12 | 2.55e-01 | 0.1555 |
| 5427 | POLE2 | P54T-E | Human | Esophagus | ESCC | 5.66e-07 | 1.92e-01 | 0.0975 |
| 5427 | POLE2 | P61T-E | Human | Esophagus | ESCC | 5.29e-04 | 9.22e-02 | 0.099 |
| 5427 | POLE2 | P62T-E | Human | Esophagus | ESCC | 9.93e-03 | 1.14e-01 | 0.1302 |
| 5427 | POLE2 | P65T-E | Human | Esophagus | ESCC | 3.35e-03 | 1.20e-01 | 0.0978 |
| 5427 | POLE2 | P74T-E | Human | Esophagus | ESCC | 4.56e-05 | 2.42e-01 | 0.1479 |
| Page: 1 2 |
| Tissue | Expression Dynamics | Abbreviation |
| Esophagus | 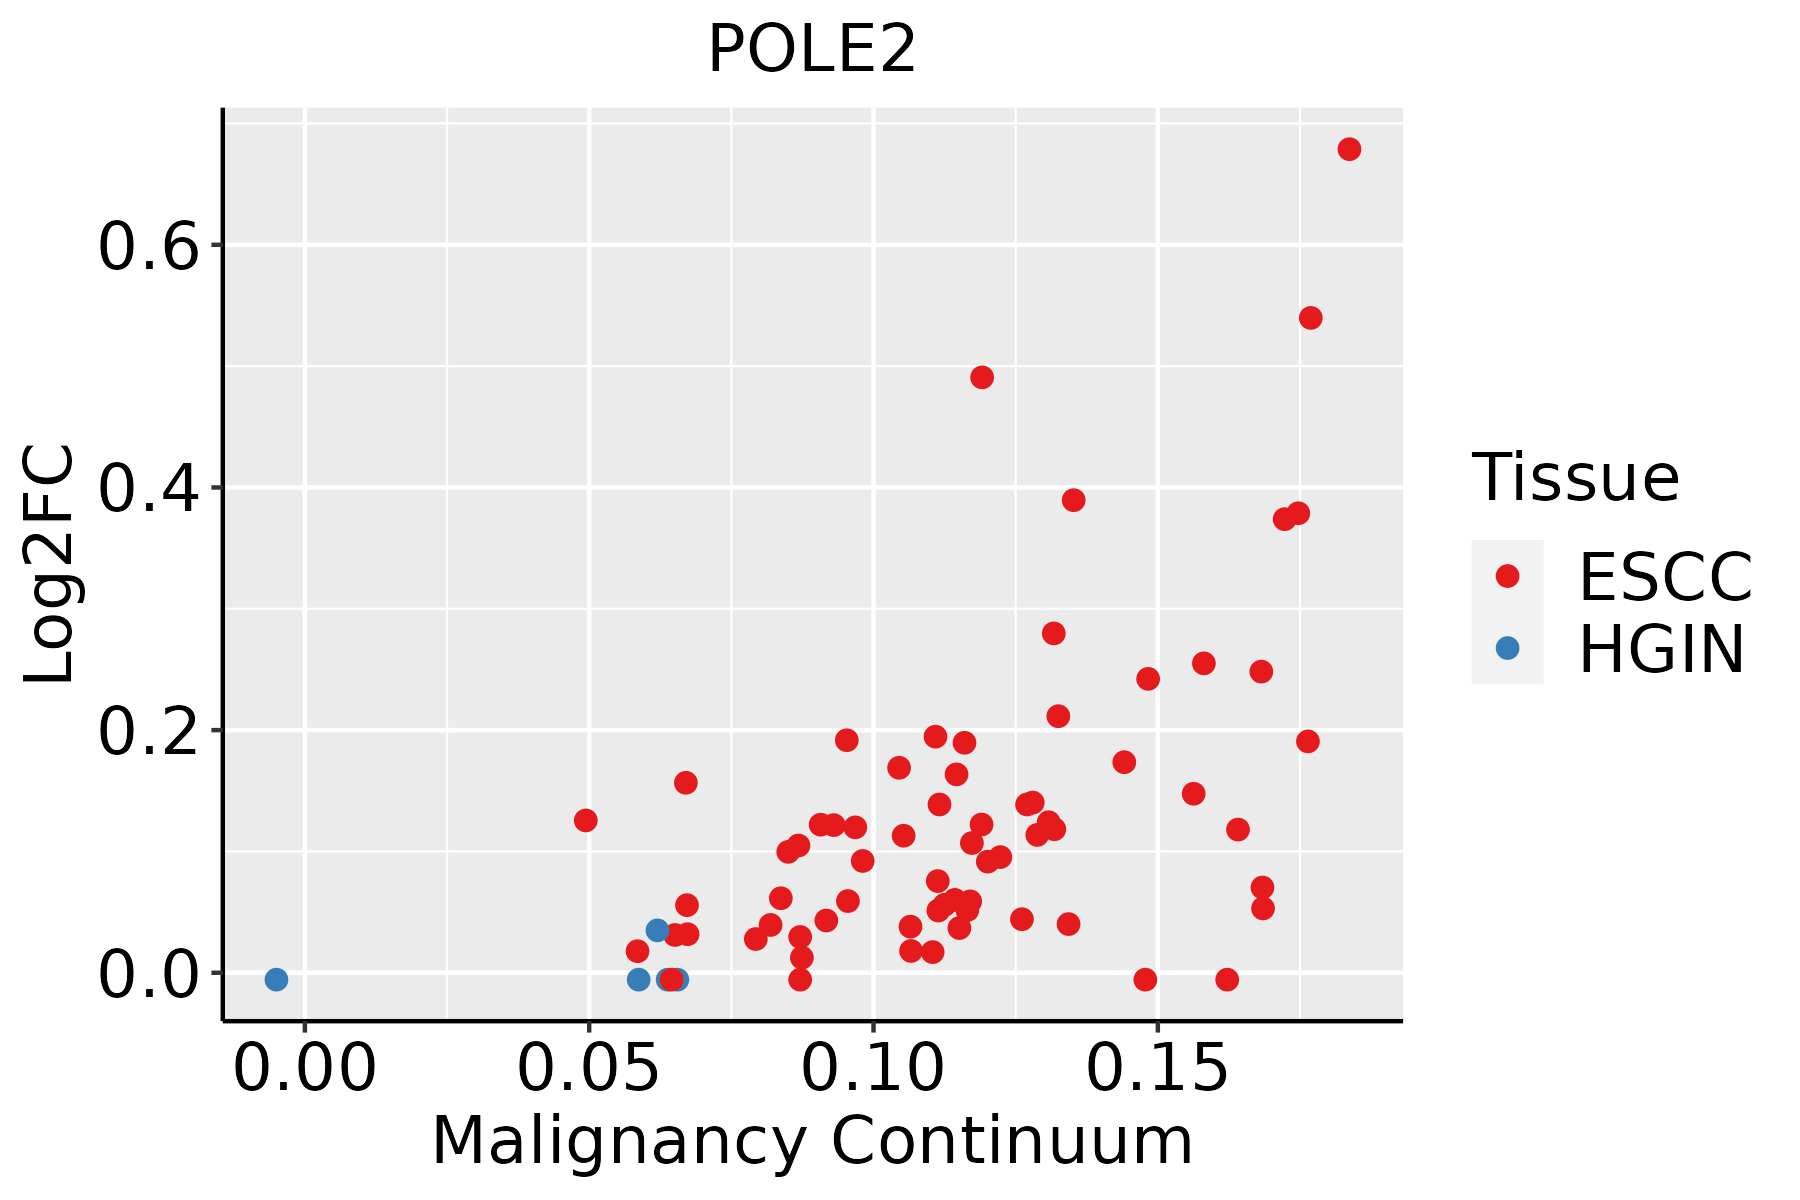 | ESCC: Esophageal squamous cell carcinoma |
| HGIN: High-grade intraepithelial neoplasias | ||
| LGIN: Low-grade intraepithelial neoplasias |
| ∗log2FC in expression of this searched gene in stem-like cells from each diseased tissue sample relative to stem-like cells in normal samples in each tissue plotted against the malignancy continuum. Samples are colored based on if they are from different disease stage. |
Top |
Malignant transformation related pathway analysis |
| Find out the enriched GO biological processes and KEGG pathways involved in transition from healthy to precancer to cancer |
| Tissue | Disease Stage | Enriched GO biological Processes |
| Colorectum | AD |  |
| Colorectum | SER |  |
| Colorectum | MSS |  |
| Colorectum | MSI-H |  |
| Colorectum | FAP |  |
| ∗Top 15 enriched GO BP terms are showed in the bar plot of each disease state in each tissue. Each row represents a significant GO biological process which is colored according to the -log10(p.adjust). |
| Page: 1 2 3 4 5 6 7 8 9 |
| GO ID | Tissue | Disease Stage | Description | Gene Ratio | Bg Ratio | pvalue | p.adjust | Count |
| GO:00062604 | Esophagus | ESCC | DNA replication | 181/8552 | 260/18723 | 3.55e-15 | 2.05e-13 | 181 |
| GO:007189716 | Esophagus | ESCC | DNA biosynthetic process | 127/8552 | 180/18723 | 1.04e-11 | 3.85e-10 | 127 |
| GO:00062612 | Esophagus | ESCC | DNA-dependent DNA replication | 100/8552 | 151/18723 | 2.61e-07 | 3.94e-06 | 100 |
| GO:00063012 | Esophagus | ESCC | postreplication repair | 26/8552 | 31/18723 | 1.32e-05 | 1.21e-04 | 26 |
| GO:0019985 | Esophagus | ESCC | translesion synthesis | 17/8552 | 21/18723 | 1.03e-03 | 5.19e-03 | 17 |
| Page: 1 |
| Pathway ID | Tissue | Disease Stage | Description | Gene Ratio | Bg Ratio | pvalue | p.adjust | qvalue | Count |
| hsa0342022 | Esophagus | ESCC | Nucleotide excision repair | 54/4205 | 63/8465 | 2.01e-09 | 2.17e-08 | 1.11e-08 | 54 |
| hsa034104 | Esophagus | ESCC | Base excision repair | 38/4205 | 44/8465 | 3.59e-07 | 2.62e-06 | 1.34e-06 | 38 |
| hsa030304 | Esophagus | ESCC | DNA replication | 32/4205 | 36/8465 | 7.71e-07 | 5.06e-06 | 2.59e-06 | 32 |
| hsa0342032 | Esophagus | ESCC | Nucleotide excision repair | 54/4205 | 63/8465 | 2.01e-09 | 2.17e-08 | 1.11e-08 | 54 |
| hsa0341011 | Esophagus | ESCC | Base excision repair | 38/4205 | 44/8465 | 3.59e-07 | 2.62e-06 | 1.34e-06 | 38 |
| hsa0303011 | Esophagus | ESCC | DNA replication | 32/4205 | 36/8465 | 7.71e-07 | 5.06e-06 | 2.59e-06 | 32 |
| Page: 1 |
Top |
Cell-cell communication analysis |
| Identification of potential cell-cell interactions between two cell types and their ligand-receptor pairs for different disease states |
| Ligand | Receptor | LRpair | Pathway | Tissue | Disease Stage |
| Page: 1 |
Top |
Single-cell gene regulatory network inference analysis |
| Find out the significant the regulons (TFs) and the target genes of each regulon across cell types for different disease states |
| TF | Cell Type | Tissue | Disease Stage | Target Gene | RSS | Regulon Activity |
| ∗The dot plots of a searched regulon are shown for all cell subpopulations in each disease state of each tissue based on the regulon specific score inferred using pySCENIC and by calculating the average expression. |
| Page: 1 |
Top |
Somatic mutation of malignant transformation related genes |
| Annotation of somatic variants for genes involved in malignant transformation |
| Hugo Symbol | Variant Class | Variant Classification | dbSNP RS | HGVSc | HGVSp | HGVSp Short | SWISSPROT | BIOTYPE | SIFT | PolyPhen | Tumor Sample Barcode | Tissue | Histology | Sex | Age | Stage | Therapy Types | Drugs | Outcome |
| POLE2 | SNV | Missense_Mutation | rs767820176 | c.914N>A | p.Arg305His | p.R305H | P56282 | protein_coding | tolerated(0.6) | benign(0.006) | TCGA-A8-A08X-01 | Breast | breast invasive carcinoma | Female | <65 | III/IV | Chemotherapy | doxorubicin | PD |
| POLE2 | SNV | Missense_Mutation | rs779259575 | c.503T>C | p.Ile168Thr | p.I168T | P56282 | protein_coding | deleterious(0) | benign(0.193) | TCGA-BH-A18G-01 | Breast | breast invasive carcinoma | Female | >=65 | I/II | Unknown | Unknown | SD |
| POLE2 | insertion | Frame_Shift_Ins | novel | c.315_316insA | p.Phe106IlefsTer21 | p.F106Ifs*21 | P56282 | protein_coding | TCGA-2W-A8YY-01 | Cervix | cervical & endocervical cancer | Female | <65 | I/II | Chemotherapy | cisplatin | CR | ||
| POLE2 | SNV | Missense_Mutation | novel | c.1234A>C | p.Ile412Leu | p.I412L | P56282 | protein_coding | deleterious(0.04) | benign(0.011) | TCGA-CA-6717-01 | Colorectum | colon adenocarcinoma | Male | <65 | I/II | Chemotherapy | oxaliplatin | CR |
| POLE2 | SNV | Missense_Mutation | c.635A>G | p.Gln212Arg | p.Q212R | P56282 | protein_coding | tolerated(0.53) | benign(0.035) | TCGA-D5-6540-01 | Colorectum | colon adenocarcinoma | Male | >=65 | I/II | Unknown | Unknown | SD | |
| POLE2 | SNV | Missense_Mutation | c.1268N>C | p.Met423Thr | p.M423T | P56282 | protein_coding | deleterious(0) | benign(0.292) | TCGA-F4-6856-01 | Colorectum | colon adenocarcinoma | Male | <65 | I/II | Ancillary | leucovorin | CR | |
| POLE2 | SNV | Missense_Mutation | c.47N>C | p.Leu16Ser | p.L16S | P56282 | protein_coding | deleterious(0) | possibly_damaging(0.857) | TCGA-G4-6628-01 | Colorectum | colon adenocarcinoma | Male | >=65 | I/II | Unknown | Unknown | SD | |
| POLE2 | SNV | Missense_Mutation | novel | c.1138C>T | p.Pro380Ser | p.P380S | P56282 | protein_coding | deleterious(0.01) | probably_damaging(0.981) | TCGA-AG-3887-01 | Colorectum | rectum adenocarcinoma | Male | >=65 | I/II | Chemotherapy | irinotecan | SD |
| POLE2 | SNV | Missense_Mutation | rs779836154 | c.524C>T | p.Thr175Ile | p.T175I | P56282 | protein_coding | deleterious(0.01) | benign(0.319) | TCGA-A5-A0G2-01 | Endometrium | uterine corpus endometrioid carcinoma | Female | <65 | III/IV | Unknown | Unknown | SD |
| POLE2 | SNV | Missense_Mutation | novel | c.271G>T | p.Ala91Ser | p.A91S | P56282 | protein_coding | deleterious(0.03) | benign(0.163) | TCGA-A5-A0G2-01 | Endometrium | uterine corpus endometrioid carcinoma | Female | <65 | III/IV | Unknown | Unknown | SD |
| Page: 1 2 3 4 |
Top |
Related drugs of malignant transformation related genes |
| Identification of chemicals and drugs interact with genes involved in malignant transfromation |
| (DGIdb 4.0) |
| Entrez ID | Symbol | Category | Interaction Types | Drug Claim Name | Drug Name | PMIDs |
| Page: 1 |

Copyright 2023-Present -The University of Texas Health Science Center at Houston |