
|
|||||
|
 | |
| |
| |
| |
| |
| |
|
Gene: POLDIP3 |
Gene summary for POLDIP3 |
| Gene information | Species | Human | Gene symbol | POLDIP3 | Gene ID | 84271 |
| Gene name | DNA polymerase delta interacting protein 3 | |
| Gene Alias | PDIP3 | |
| Cytomap | 22q13.2 | |
| Gene Type | protein-coding | GO ID | GO:0006403 | UniProtAcc | B4E0L0 |
Top |
Malignant transformation analysis |
| Identification of the aberrant gene expression in precancerous and cancerous lesions by comparing the gene expression of stem-like cells in diseased tissues with normal stem cells |
| Entrez ID | Symbol | Replicates | Species | Organ | Tissue | Adj P-value | Log2FC | Malignancy |
| 84271 | POLDIP3 | LZE4T | Human | Esophagus | ESCC | 3.93e-07 | 2.42e-01 | 0.0811 |
| 84271 | POLDIP3 | LZE7T | Human | Esophagus | ESCC | 5.60e-05 | 4.63e-01 | 0.0667 |
| 84271 | POLDIP3 | LZE8T | Human | Esophagus | ESCC | 9.23e-08 | 2.57e-01 | 0.067 |
| 84271 | POLDIP3 | LZE20T | Human | Esophagus | ESCC | 3.44e-03 | 8.99e-02 | 0.0662 |
| 84271 | POLDIP3 | LZE24T | Human | Esophagus | ESCC | 4.36e-17 | 3.50e-01 | 0.0596 |
| 84271 | POLDIP3 | LZE21T | Human | Esophagus | ESCC | 8.36e-04 | 3.60e-01 | 0.0655 |
| 84271 | POLDIP3 | LZE6T | Human | Esophagus | ESCC | 2.69e-02 | 4.30e-02 | 0.0845 |
| 84271 | POLDIP3 | P1T-E | Human | Esophagus | ESCC | 2.48e-06 | 2.70e-01 | 0.0875 |
| 84271 | POLDIP3 | P2T-E | Human | Esophagus | ESCC | 5.71e-28 | 5.48e-01 | 0.1177 |
| 84271 | POLDIP3 | P4T-E | Human | Esophagus | ESCC | 7.93e-21 | 3.74e-01 | 0.1323 |
| 84271 | POLDIP3 | P5T-E | Human | Esophagus | ESCC | 3.58e-20 | 4.50e-01 | 0.1327 |
| 84271 | POLDIP3 | P8T-E | Human | Esophagus | ESCC | 1.23e-23 | 2.98e-01 | 0.0889 |
| 84271 | POLDIP3 | P9T-E | Human | Esophagus | ESCC | 7.80e-15 | 3.12e-01 | 0.1131 |
| 84271 | POLDIP3 | P10T-E | Human | Esophagus | ESCC | 1.61e-35 | 6.01e-01 | 0.116 |
| 84271 | POLDIP3 | P11T-E | Human | Esophagus | ESCC | 1.93e-18 | 6.78e-01 | 0.1426 |
| 84271 | POLDIP3 | P12T-E | Human | Esophagus | ESCC | 3.27e-34 | 7.01e-01 | 0.1122 |
| 84271 | POLDIP3 | P15T-E | Human | Esophagus | ESCC | 2.63e-34 | 7.95e-01 | 0.1149 |
| 84271 | POLDIP3 | P16T-E | Human | Esophagus | ESCC | 5.17e-45 | 9.73e-01 | 0.1153 |
| 84271 | POLDIP3 | P17T-E | Human | Esophagus | ESCC | 1.18e-11 | 5.74e-01 | 0.1278 |
| 84271 | POLDIP3 | P19T-E | Human | Esophagus | ESCC | 1.59e-03 | 5.68e-01 | 0.1662 |
| Page: 1 2 3 4 5 |
| Tissue | Expression Dynamics | Abbreviation |
| Esophagus | 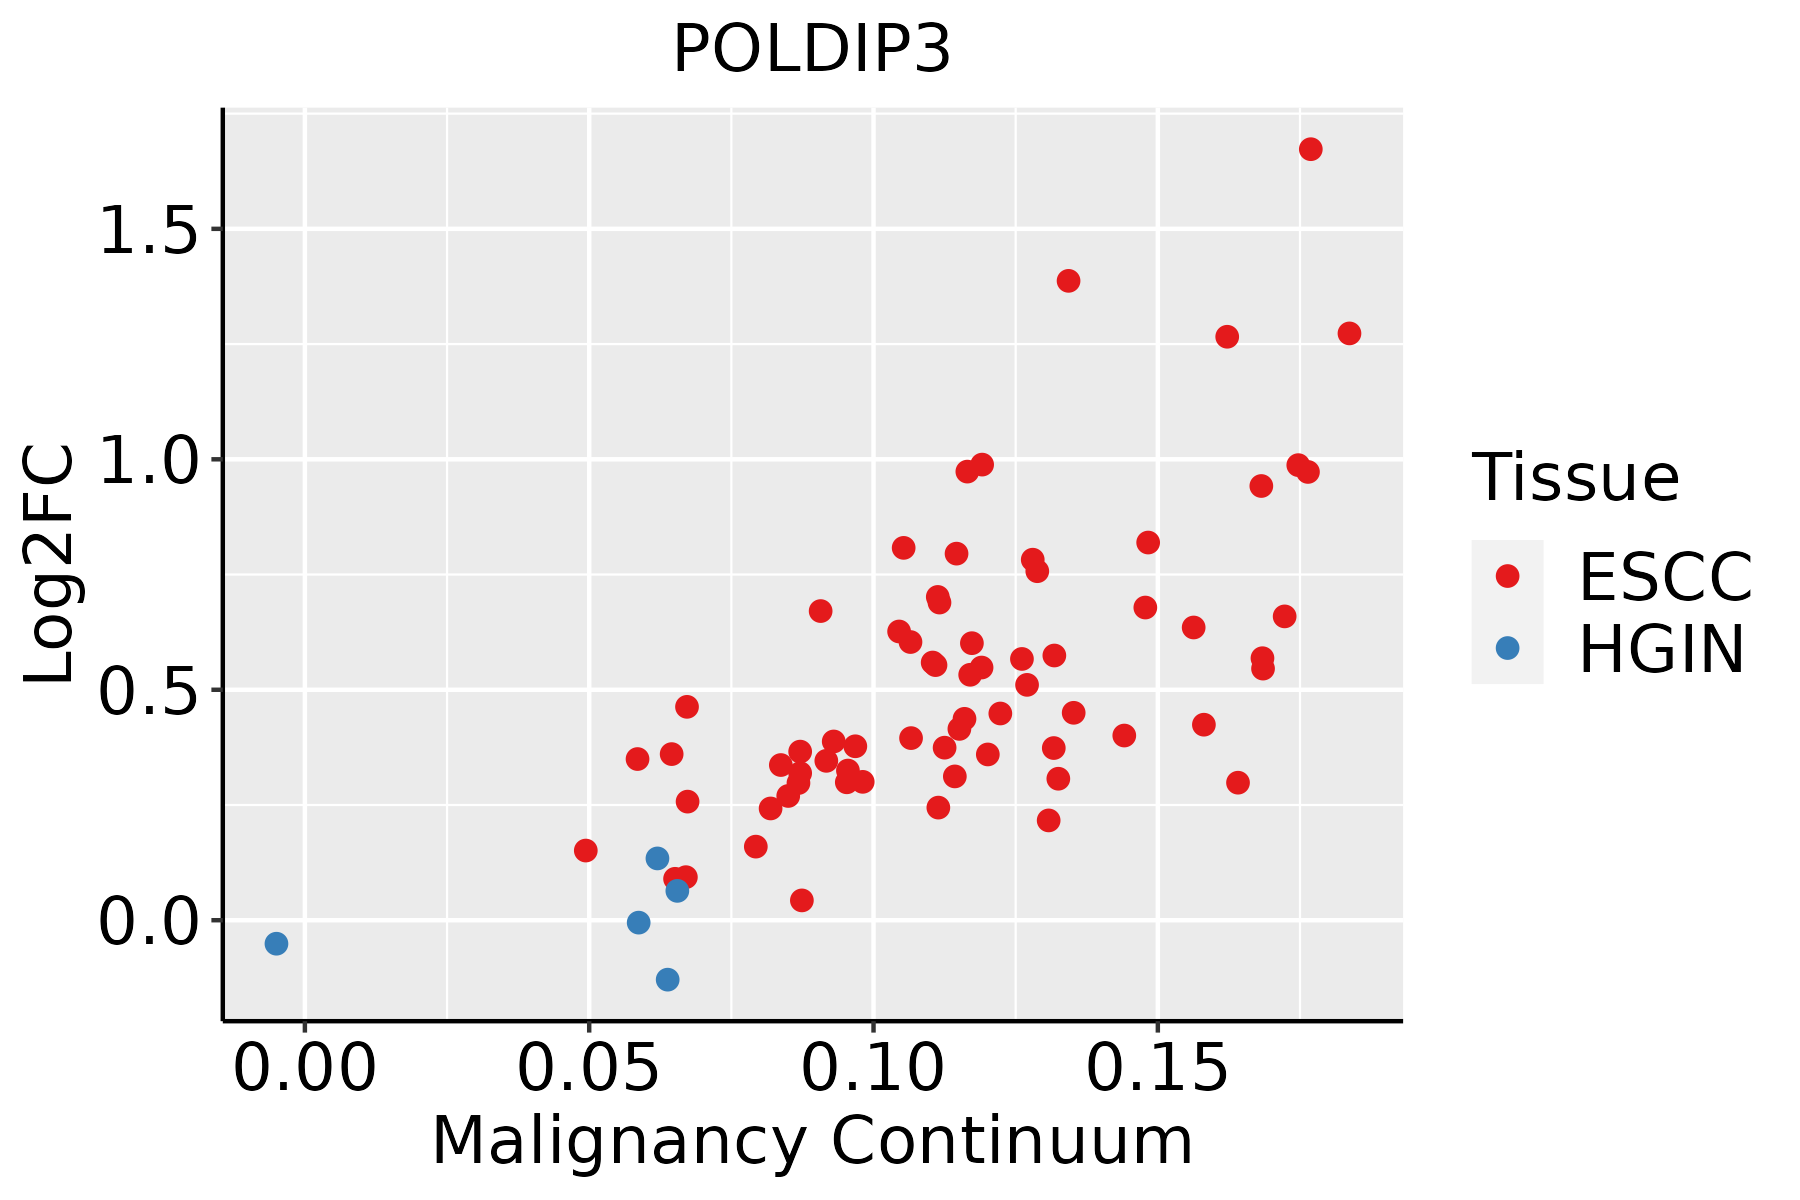 | ESCC: Esophageal squamous cell carcinoma |
| HGIN: High-grade intraepithelial neoplasias | ||
| LGIN: Low-grade intraepithelial neoplasias | ||
| Liver | 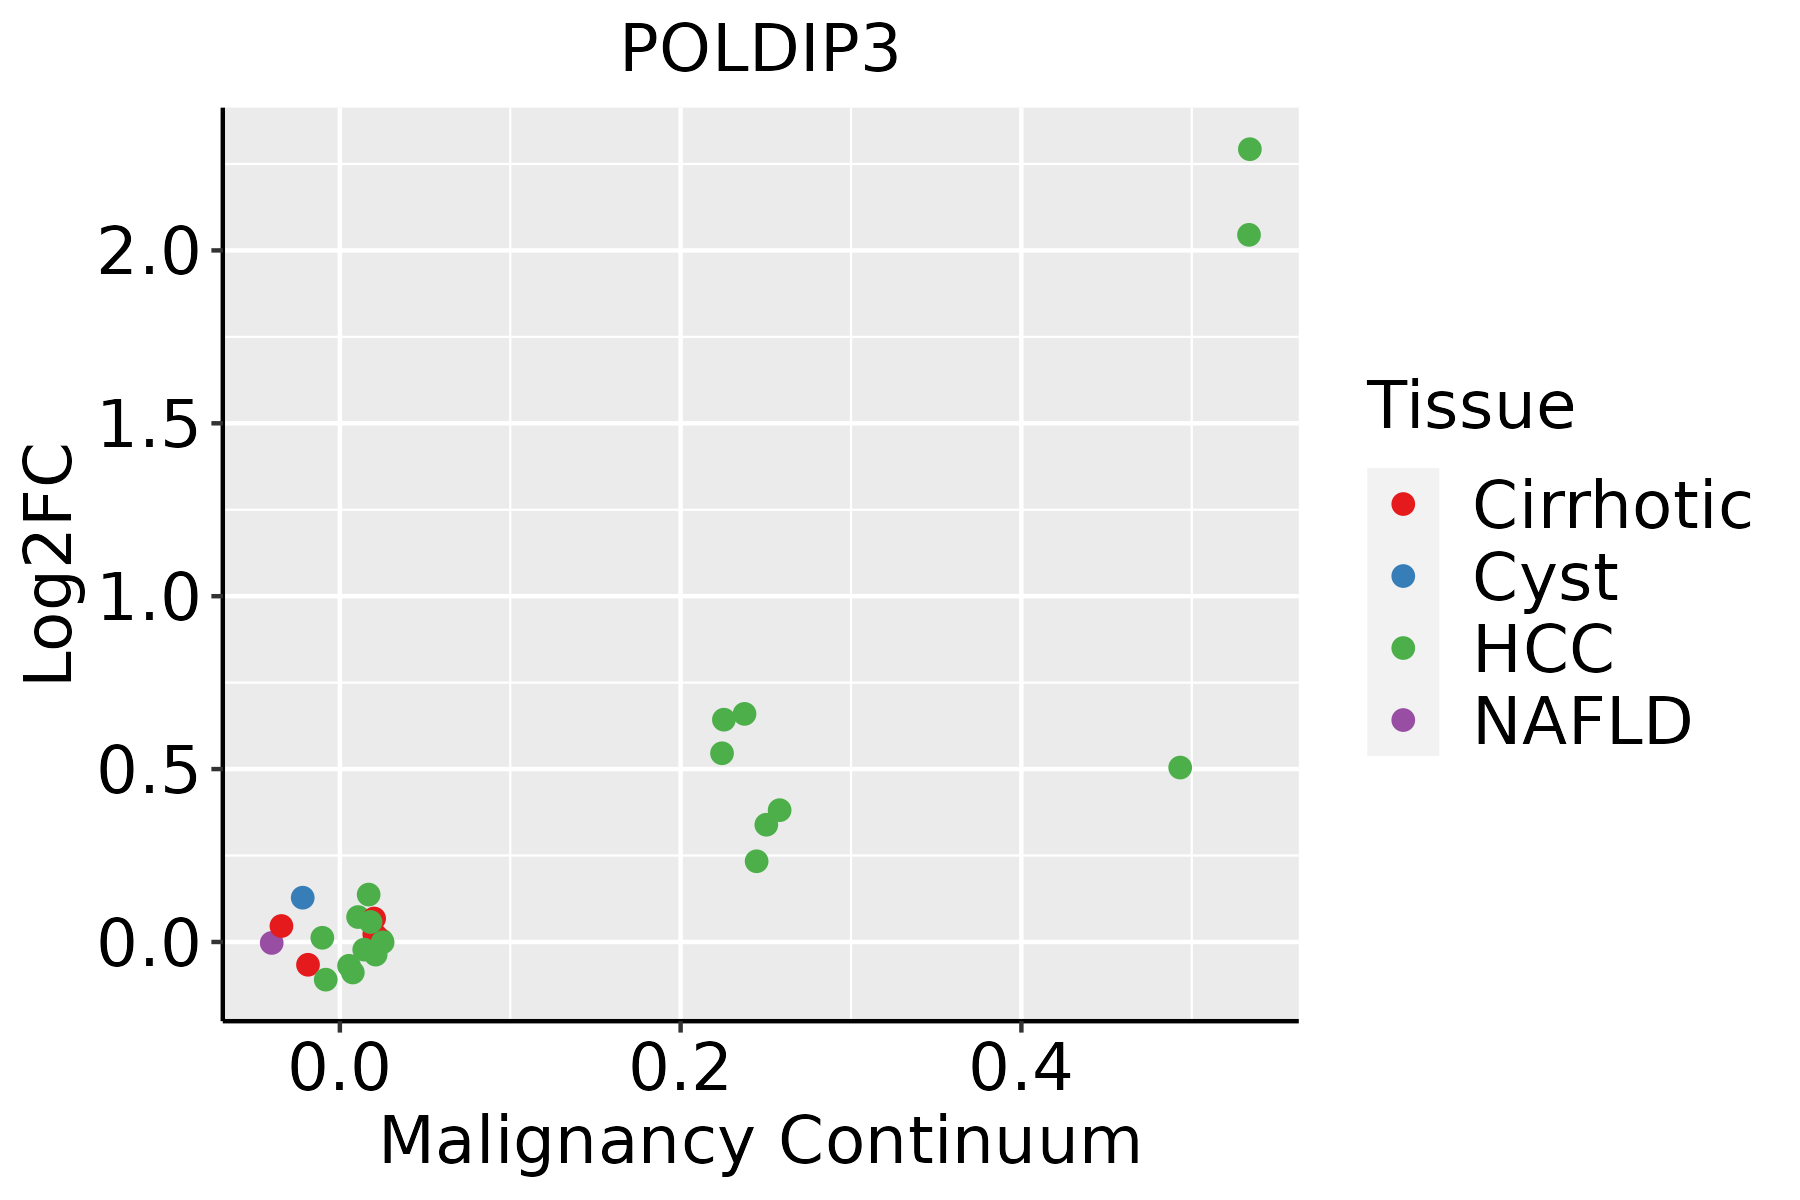 | HCC: Hepatocellular carcinoma |
| NAFLD: Non-alcoholic fatty liver disease | ||
| Oral Cavity | 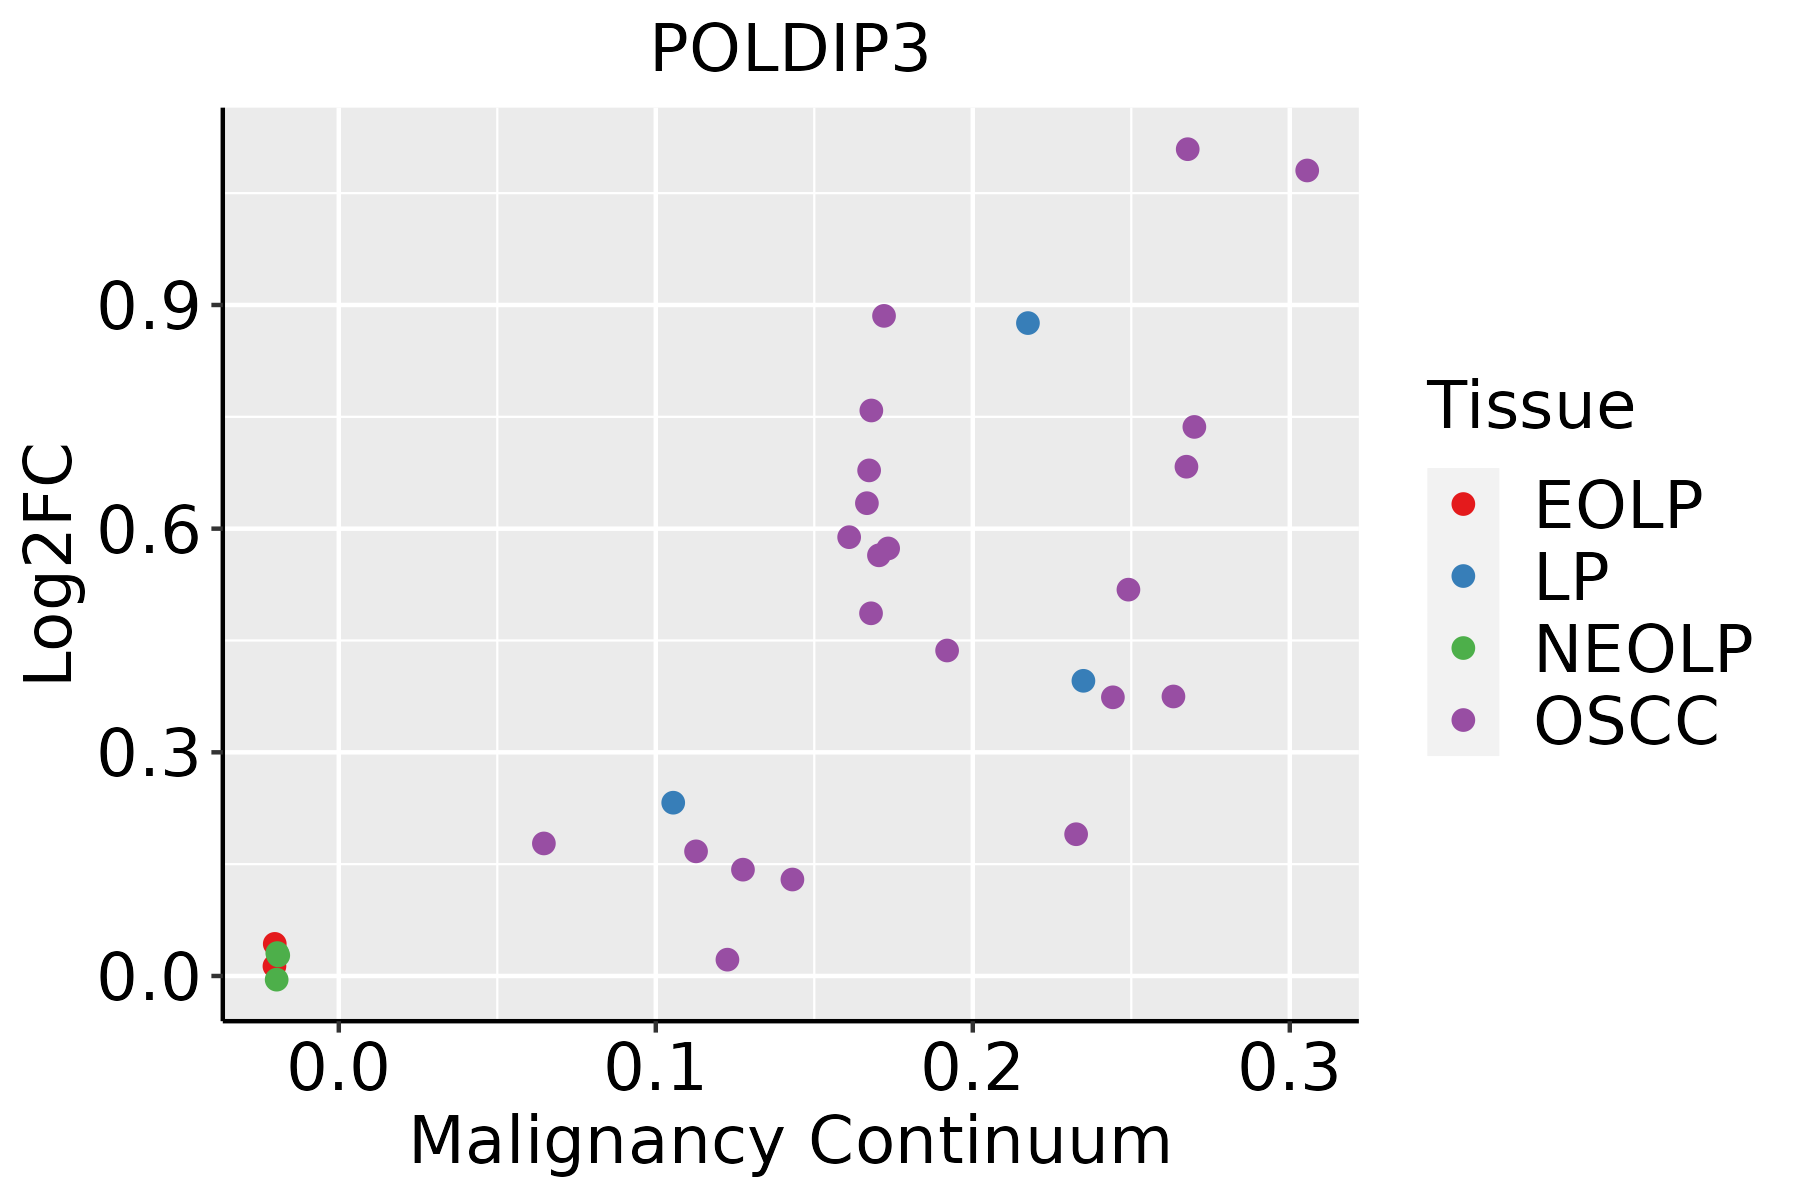 | EOLP: Erosive Oral lichen planus |
| LP: leukoplakia | ||
| NEOLP: Non-erosive oral lichen planus | ||
| OSCC: Oral squamous cell carcinoma | ||
| Skin | 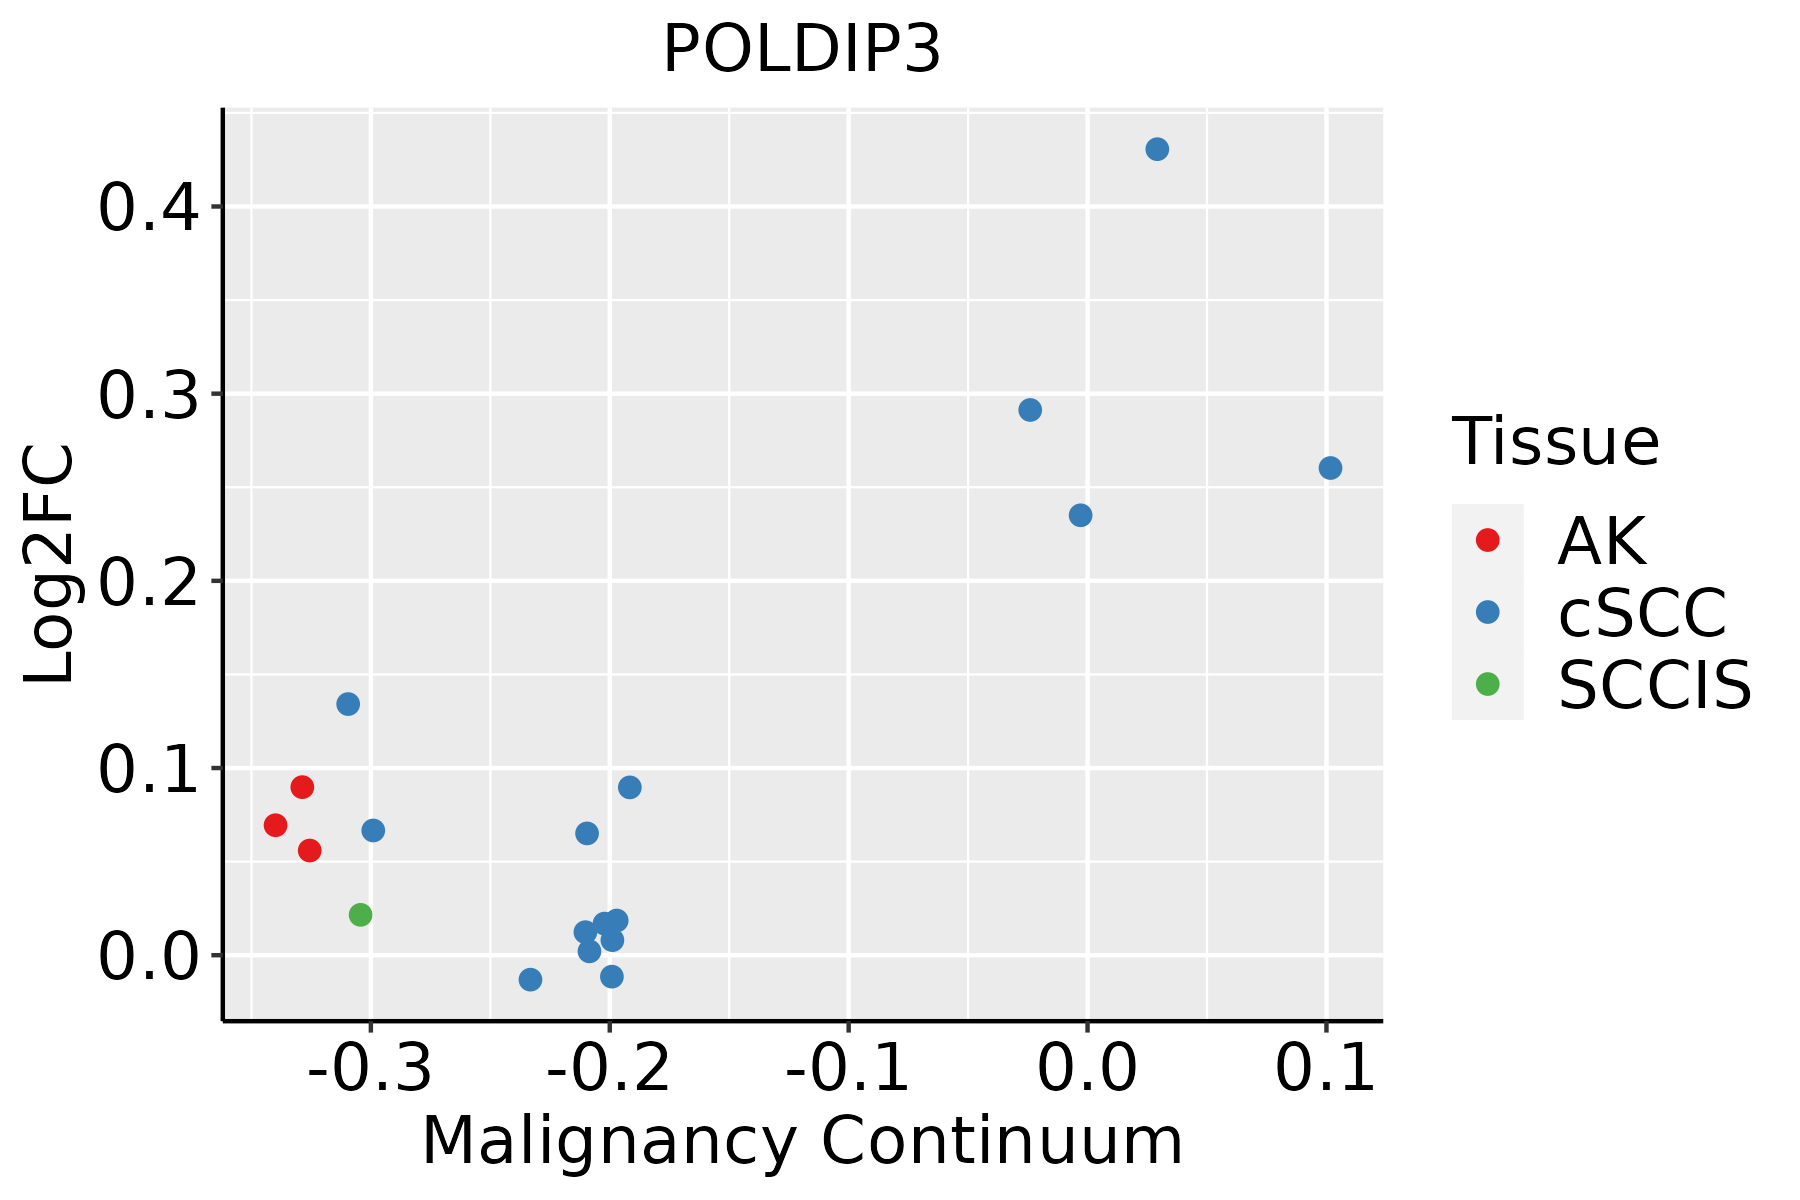 | AK: Actinic keratosis |
| cSCC: Cutaneous squamous cell carcinoma | ||
| SCCIS:squamous cell carcinoma in situ |
| ∗log2FC in expression of this searched gene in stem-like cells from each diseased tissue sample relative to stem-like cells in normal samples in each tissue plotted against the malignancy continuum. Samples are colored based on if they are from different disease stage. |
Top |
Malignant transformation related pathway analysis |
| Find out the enriched GO biological processes and KEGG pathways involved in transition from healthy to precancer to cancer |
| Tissue | Disease Stage | Enriched GO biological Processes |
| Colorectum | AD |  |
| Colorectum | SER |  |
| Colorectum | MSS |  |
| Colorectum | MSI-H |  |
| Colorectum | FAP |  |
| ∗Top 15 enriched GO BP terms are showed in the bar plot of each disease state in each tissue. Each row represents a significant GO biological process which is colored according to the -log10(p.adjust). |
| Page: 1 2 3 4 5 6 7 8 9 |
| GO ID | Tissue | Disease Stage | Description | Gene Ratio | Bg Ratio | pvalue | p.adjust | Count |
| GO:0006913110 | Esophagus | ESCC | nucleocytoplasmic transport | 230/8552 | 301/18723 | 6.04e-28 | 2.02e-25 | 230 |
| GO:0051169110 | Esophagus | ESCC | nuclear transport | 230/8552 | 301/18723 | 6.04e-28 | 2.02e-25 | 230 |
| GO:0006403110 | Esophagus | ESCC | RNA localization | 166/8552 | 201/18723 | 1.95e-27 | 6.18e-25 | 166 |
| GO:005123617 | Esophagus | ESCC | establishment of RNA localization | 134/8552 | 166/18723 | 1.23e-20 | 1.81e-18 | 134 |
| GO:0051168110 | Esophagus | ESCC | nuclear export | 126/8552 | 154/18723 | 1.88e-20 | 2.65e-18 | 126 |
| GO:005102815 | Esophagus | ESCC | mRNA transport | 110/8552 | 130/18723 | 2.76e-20 | 3.80e-18 | 110 |
| GO:005065717 | Esophagus | ESCC | nucleic acid transport | 131/8552 | 163/18723 | 6.94e-20 | 8.46e-18 | 131 |
| GO:005065817 | Esophagus | ESCC | RNA transport | 131/8552 | 163/18723 | 6.94e-20 | 8.46e-18 | 131 |
| GO:0006417111 | Esophagus | ESCC | regulation of translation | 304/8552 | 468/18723 | 1.53e-17 | 1.33e-15 | 304 |
| GO:001593117 | Esophagus | ESCC | nucleobase-containing compound transport | 162/8552 | 222/18723 | 9.87e-17 | 7.93e-15 | 162 |
| GO:0045727111 | Esophagus | ESCC | positive regulation of translation | 107/8552 | 136/18723 | 2.79e-15 | 1.68e-13 | 107 |
| GO:0034250111 | Esophagus | ESCC | positive regulation of cellular amide metabolic process | 123/8552 | 162/18723 | 3.32e-15 | 1.93e-13 | 123 |
| GO:007116612 | Esophagus | ESCC | ribonucleoprotein complex localization | 66/8552 | 77/18723 | 2.94e-13 | 1.38e-11 | 66 |
| GO:007142612 | Esophagus | ESCC | ribonucleoprotein complex export from nucleus | 65/8552 | 76/18723 | 5.56e-13 | 2.50e-11 | 65 |
| GO:000640512 | Esophagus | ESCC | RNA export from nucleus | 68/8552 | 84/18723 | 2.99e-11 | 1.01e-09 | 68 |
| GO:00064064 | Esophagus | ESCC | mRNA export from nucleus | 51/8552 | 59/18723 | 7.98e-11 | 2.47e-09 | 51 |
| GO:00714274 | Esophagus | ESCC | mRNA-containing ribonucleoprotein complex export from nucleus | 51/8552 | 59/18723 | 7.98e-11 | 2.47e-09 | 51 |
| GO:003150314 | Esophagus | ESCC | protein-containing complex localization | 139/8552 | 220/18723 | 1.14e-07 | 1.85e-06 | 139 |
| GO:000640321 | Liver | HCC | RNA localization | 151/7958 | 201/18723 | 3.72e-21 | 5.89e-19 | 151 |
| GO:000691322 | Liver | HCC | nucleocytoplasmic transport | 208/7958 | 301/18723 | 5.51e-21 | 8.12e-19 | 208 |
| Page: 1 2 3 4 |
| Pathway ID | Tissue | Disease Stage | Description | Gene Ratio | Bg Ratio | pvalue | p.adjust | qvalue | Count |
| Page: 1 |
Top |
Cell-cell communication analysis |
| Identification of potential cell-cell interactions between two cell types and their ligand-receptor pairs for different disease states |
| Ligand | Receptor | LRpair | Pathway | Tissue | Disease Stage |
| Page: 1 |
Top |
Single-cell gene regulatory network inference analysis |
| Find out the significant the regulons (TFs) and the target genes of each regulon across cell types for different disease states |
| TF | Cell Type | Tissue | Disease Stage | Target Gene | RSS | Regulon Activity |
| ∗The dot plots of a searched regulon are shown for all cell subpopulations in each disease state of each tissue based on the regulon specific score inferred using pySCENIC and by calculating the average expression. |
| Page: 1 |
Top |
Somatic mutation of malignant transformation related genes |
| Annotation of somatic variants for genes involved in malignant transformation |
| Hugo Symbol | Variant Class | Variant Classification | dbSNP RS | HGVSc | HGVSp | HGVSp Short | SWISSPROT | BIOTYPE | SIFT | PolyPhen | Tumor Sample Barcode | Tissue | Histology | Sex | Age | Stage | Therapy Types | Drugs | Outcome |
| POLDIP3 | SNV | Missense_Mutation | novel | c.32N>C | p.Arg11Thr | p.R11T | protein_coding | deleterious(0) | probably_damaging(0.913) | TCGA-LL-A8F5-01 | Breast | breast invasive carcinoma | Female | <65 | I/II | Chemotherapy | cyclophosphamide | SD | |
| POLDIP3 | insertion | Frame_Shift_Ins | novel | c.8_9insTGCCTCATTTAATCTTTTACAGT | p.Ile4AlafsTer103 | p.I4Afs*103 | protein_coding | TCGA-AO-A03T-01 | Breast | breast invasive carcinoma | Female | <65 | I/II | Chemotherapy | cyclophosphamide | SD | |||
| POLDIP3 | insertion | Frame_Shift_Ins | novel | c.696_697insCTTCCAGGTAGAG | p.Ser233LeufsTer23 | p.S233Lfs*23 | protein_coding | TCGA-BH-A0DZ-01 | Breast | breast invasive carcinoma | Female | <65 | I/II | Chemotherapy | docetaxel | SD | |||
| POLDIP3 | SNV | Missense_Mutation | c.959N>A | p.Cys320Tyr | p.C320Y | protein_coding | tolerated(0.09) | probably_damaging(0.999) | TCGA-AA-3811-01 | Colorectum | colon adenocarcinoma | Female | >=65 | III/IV | Unknown | Unknown | PD | ||
| POLDIP3 | SNV | Missense_Mutation | novel | c.960N>G | p.Cys320Trp | p.C320W | protein_coding | deleterious(0) | probably_damaging(0.999) | TCGA-AA-3949-01 | Colorectum | colon adenocarcinoma | Female | >=65 | III/IV | Unknown | Unknown | SD | |
| POLDIP3 | SNV | Missense_Mutation | novel | c.960N>G | p.Cys320Trp | p.C320W | protein_coding | deleterious(0) | probably_damaging(0.999) | TCGA-AD-6889-01 | Colorectum | colon adenocarcinoma | Male | >=65 | I/II | Chemotherapy | xeloda | PD | |
| POLDIP3 | SNV | Missense_Mutation | rs762274348 | c.1141N>T | p.Arg381Trp | p.R381W | protein_coding | deleterious(0.01) | probably_damaging(1) | TCGA-NH-A5IV-01 | Colorectum | colon adenocarcinoma | Female | >=65 | I/II | Unknown | Unknown | SD | |
| POLDIP3 | SNV | Missense_Mutation | c.86G>A | p.Gly29Asp | p.G29D | protein_coding | deleterious(0.04) | benign(0.104) | TCGA-NH-A6GB-01 | Colorectum | colon adenocarcinoma | Female | >=65 | III/IV | Chemotherapy | oxaliplatin | SD | ||
| POLDIP3 | SNV | Missense_Mutation | c.251G>A | p.Arg84Gln | p.R84Q | protein_coding | deleterious(0) | probably_damaging(0.995) | TCGA-AG-A002-01 | Colorectum | rectum adenocarcinoma | Male | <65 | I/II | Unknown | Unknown | SD | ||
| POLDIP3 | SNV | Missense_Mutation | novel | c.481C>A | p.Leu161Met | p.L161M | protein_coding | tolerated(0.06) | benign(0.001) | TCGA-A5-A0G2-01 | Endometrium | uterine corpus endometrioid carcinoma | Female | <65 | III/IV | Unknown | Unknown | SD |
| Page: 1 2 3 |
Top |
Related drugs of malignant transformation related genes |
| Identification of chemicals and drugs interact with genes involved in malignant transfromation |
| (DGIdb 4.0) |
| Entrez ID | Symbol | Category | Interaction Types | Drug Claim Name | Drug Name | PMIDs |
| Page: 1 |

Copyright 2023-Present -The University of Texas Health Science Center at Houston |