
|
|||||
|
 | |
| |
| |
| |
| |
| |
|
Gene: POLD2 |
Gene summary for POLD2 |
| Gene information | Species | Human | Gene symbol | POLD2 | Gene ID | 5425 |
| Gene name | DNA polymerase delta 2, accessory subunit | |
| Gene Alias | POLD2 | |
| Cytomap | 7p13 | |
| Gene Type | protein-coding | GO ID | GO:0006139 | UniProtAcc | P49005 |
Top |
Malignant transformation analysis |
| Identification of the aberrant gene expression in precancerous and cancerous lesions by comparing the gene expression of stem-like cells in diseased tissues with normal stem cells |
| Entrez ID | Symbol | Replicates | Species | Organ | Tissue | Adj P-value | Log2FC | Malignancy |
| 5425 | POLD2 | HTA11_696_2000001011 | Human | Colorectum | AD | 2.33e-06 | 3.23e-01 | -0.1464 |
| 5425 | POLD2 | HTA11_1391_2000001011 | Human | Colorectum | AD | 3.93e-11 | 5.54e-01 | -0.059 |
| 5425 | POLD2 | HTA11_866_3004761011 | Human | Colorectum | AD | 1.99e-03 | 2.67e-01 | 0.096 |
| 5425 | POLD2 | HTA11_4255_2000001011 | Human | Colorectum | SER | 1.74e-02 | 4.63e-01 | 0.0446 |
| 5425 | POLD2 | HTA11_6801_2000001011 | Human | Colorectum | SER | 6.07e-04 | 4.99e-01 | 0.0171 |
| 5425 | POLD2 | HTA11_7696_3000711011 | Human | Colorectum | AD | 5.96e-05 | 2.81e-01 | 0.0674 |
| 5425 | POLD2 | HTA11_99999970781_79442 | Human | Colorectum | MSS | 1.32e-03 | 1.81e-01 | 0.294 |
| 5425 | POLD2 | HTA11_99999965062_69753 | Human | Colorectum | MSI-H | 1.71e-02 | 5.80e-01 | 0.3487 |
| 5425 | POLD2 | HTA11_99999965104_69814 | Human | Colorectum | MSS | 1.41e-06 | 4.74e-01 | 0.281 |
| 5425 | POLD2 | HTA11_99999971662_82457 | Human | Colorectum | MSS | 5.33e-08 | 3.99e-01 | 0.3859 |
| 5425 | POLD2 | HTA11_99999973899_84307 | Human | Colorectum | MSS | 1.54e-02 | 3.00e-01 | 0.2585 |
| 5425 | POLD2 | HTA11_99999974143_84620 | Human | Colorectum | MSS | 5.60e-14 | 4.12e-01 | 0.3005 |
| 5425 | POLD2 | LZE2T | Human | Esophagus | ESCC | 5.16e-04 | 6.97e-01 | 0.082 |
| 5425 | POLD2 | LZE4T | Human | Esophagus | ESCC | 2.66e-25 | 6.24e-01 | 0.0811 |
| 5425 | POLD2 | LZE5T | Human | Esophagus | ESCC | 1.44e-02 | 2.69e-01 | 0.0514 |
| 5425 | POLD2 | LZE7T | Human | Esophagus | ESCC | 3.21e-16 | 1.00e+00 | 0.0667 |
| 5425 | POLD2 | LZE8T | Human | Esophagus | ESCC | 2.39e-11 | 5.07e-01 | 0.067 |
| 5425 | POLD2 | LZE20T | Human | Esophagus | ESCC | 4.37e-04 | 2.12e-01 | 0.0662 |
| 5425 | POLD2 | LZE22T | Human | Esophagus | ESCC | 1.70e-11 | 8.63e-01 | 0.068 |
| 5425 | POLD2 | LZE24T | Human | Esophagus | ESCC | 6.05e-24 | 7.04e-01 | 0.0596 |
| Page: 1 2 3 4 5 6 7 8 |
| Tissue | Expression Dynamics | Abbreviation |
| Colorectum (GSE201348) |  | FAP: Familial adenomatous polyposis |
| CRC: Colorectal cancer | ||
| Colorectum (HTA11) |  | AD: Adenomas |
| SER: Sessile serrated lesions | ||
| MSI-H: Microsatellite-high colorectal cancer | ||
| MSS: Microsatellite stable colorectal cancer | ||
| Esophagus | 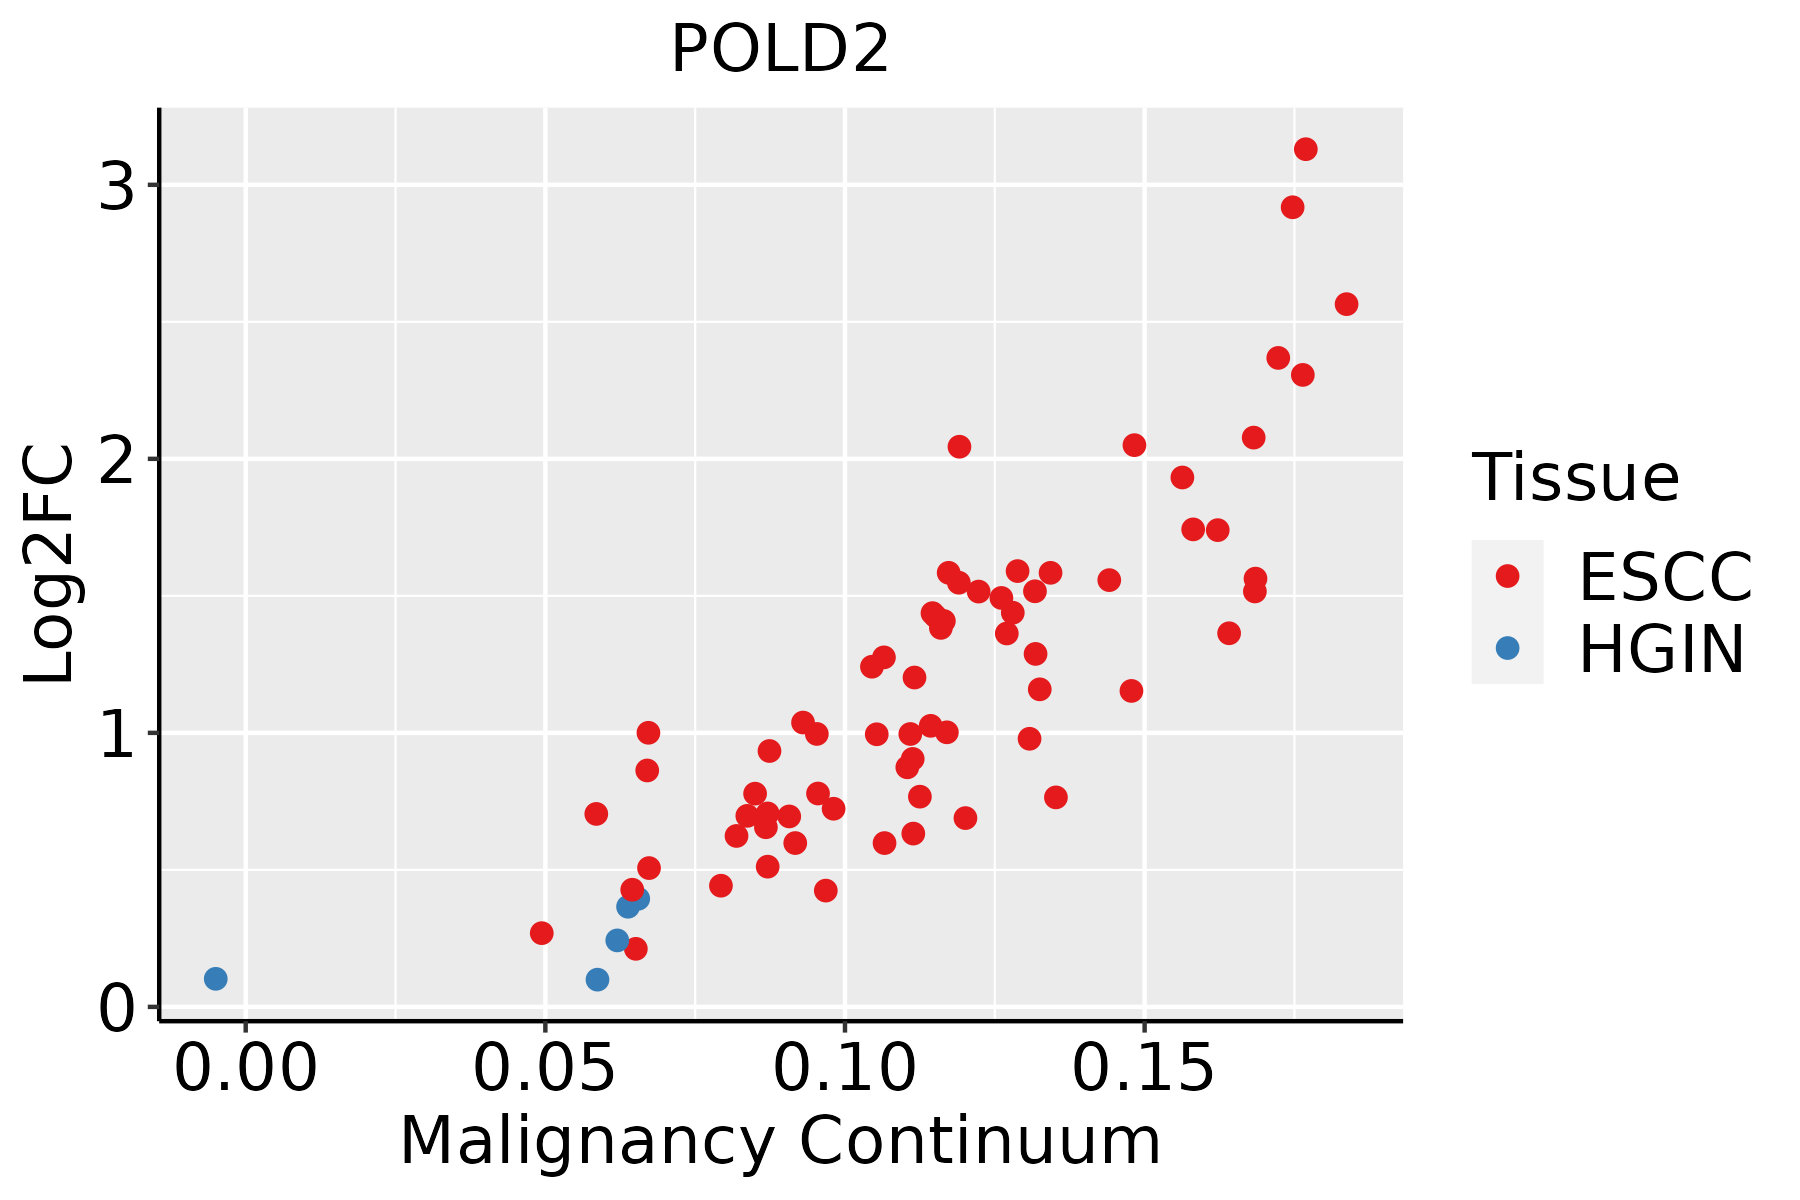 | ESCC: Esophageal squamous cell carcinoma |
| HGIN: High-grade intraepithelial neoplasias | ||
| LGIN: Low-grade intraepithelial neoplasias | ||
| Liver |  | HCC: Hepatocellular carcinoma |
| NAFLD: Non-alcoholic fatty liver disease | ||
| Oral Cavity | 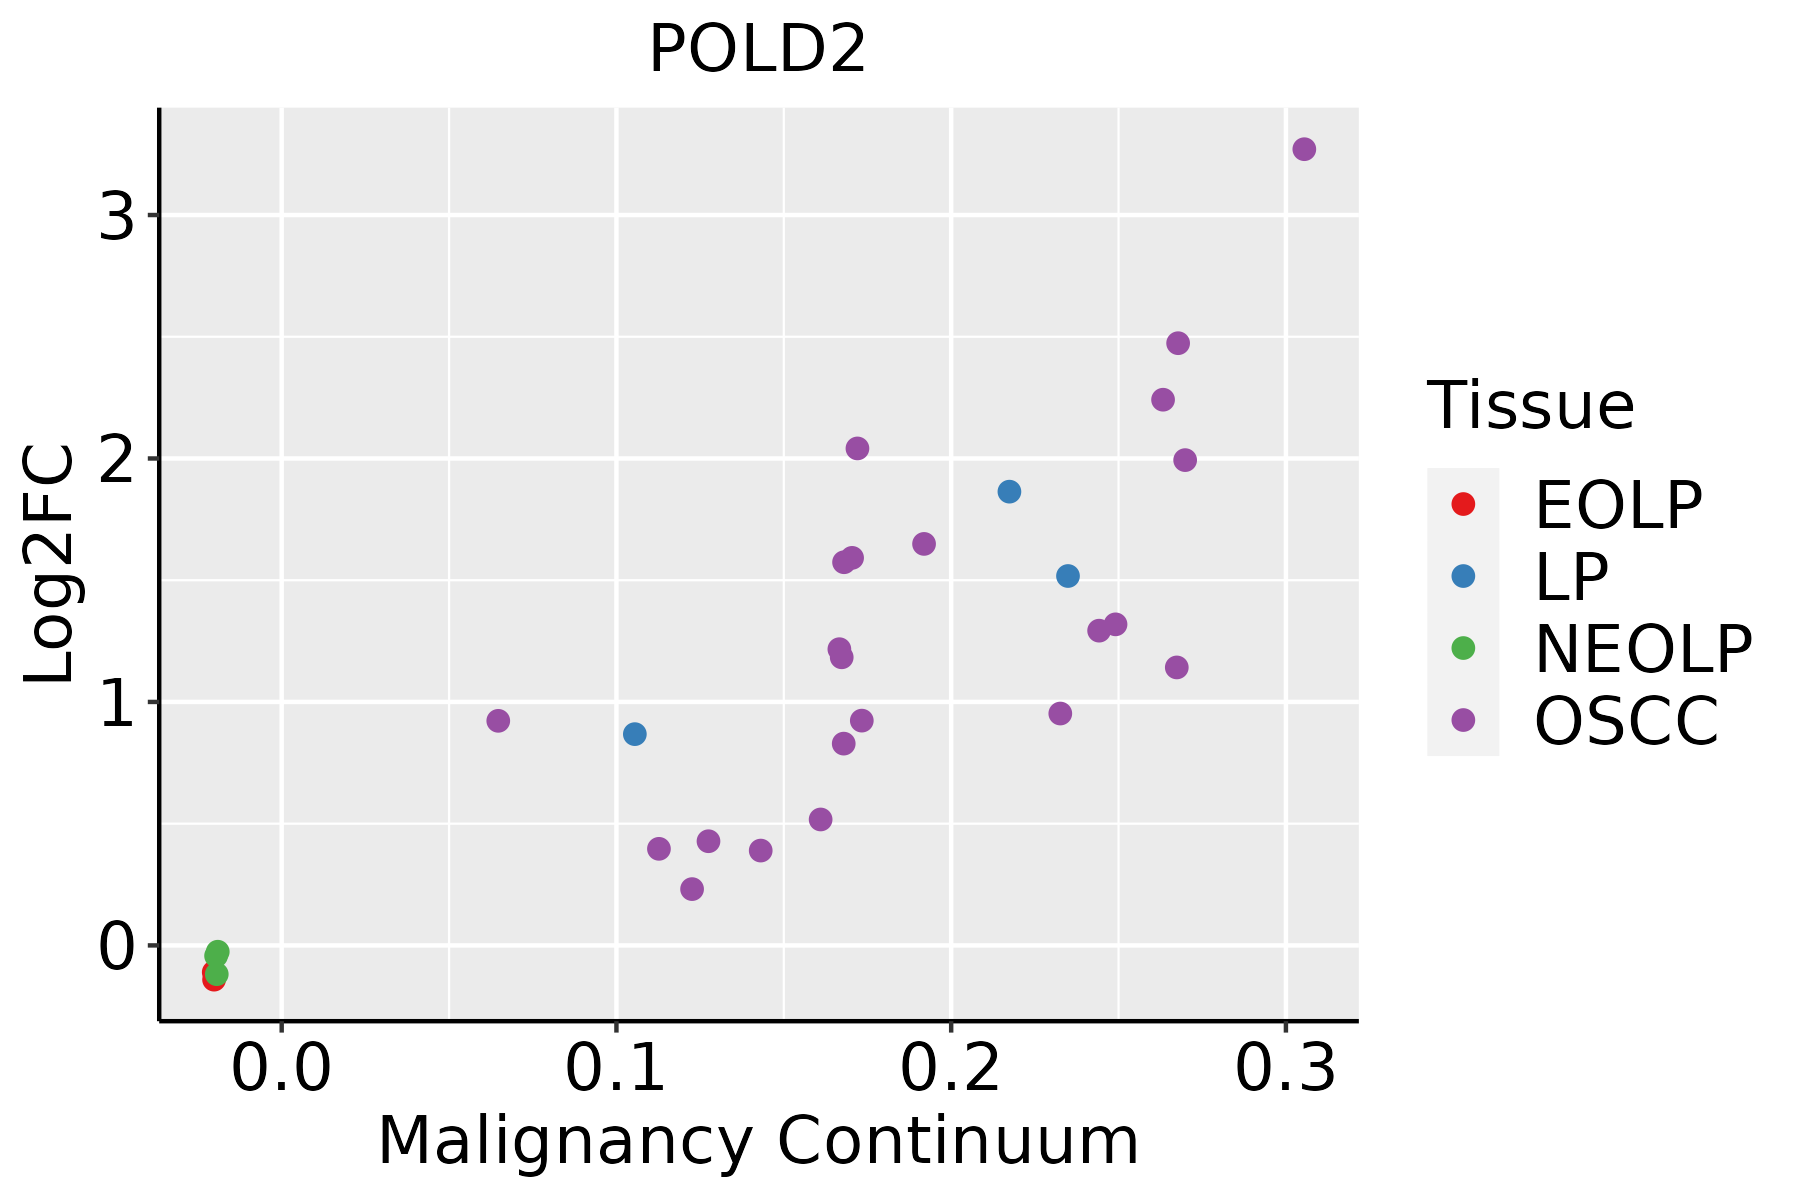 | EOLP: Erosive Oral lichen planus |
| LP: leukoplakia | ||
| NEOLP: Non-erosive oral lichen planus | ||
| OSCC: Oral squamous cell carcinoma | ||
| Skin |  | AK: Actinic keratosis |
| cSCC: Cutaneous squamous cell carcinoma | ||
| SCCIS:squamous cell carcinoma in situ | ||
| Thyroid | 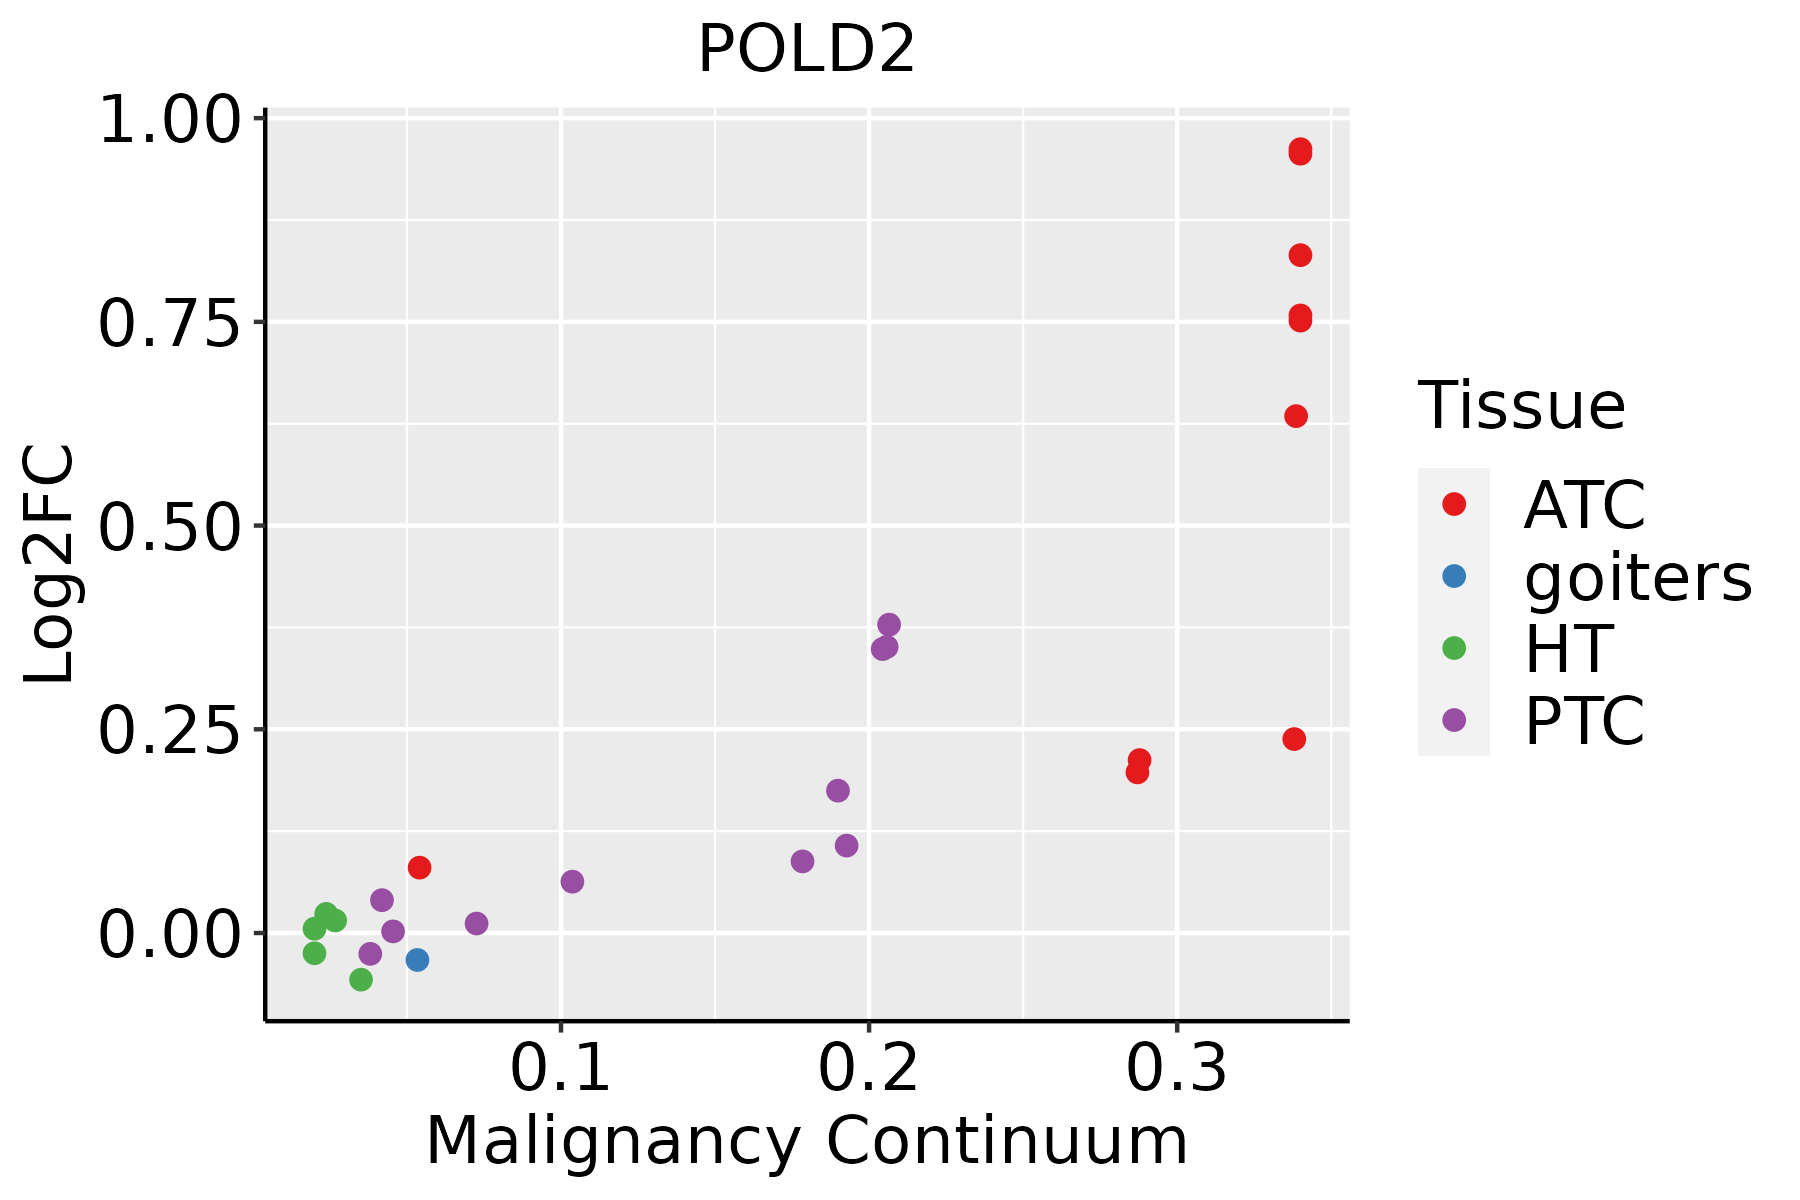 | ATC: Anaplastic thyroid cancer |
| HT: Hashimoto's thyroiditis | ||
| PTC: Papillary thyroid cancer |
| ∗log2FC in expression of this searched gene in stem-like cells from each diseased tissue sample relative to stem-like cells in normal samples in each tissue plotted against the malignancy continuum. Samples are colored based on if they are from different disease stage. |
Top |
Malignant transformation related pathway analysis |
| Find out the enriched GO biological processes and KEGG pathways involved in transition from healthy to precancer to cancer |
| Tissue | Disease Stage | Enriched GO biological Processes |
| Colorectum | AD |  |
| Colorectum | SER |  |
| Colorectum | MSS |  |
| Colorectum | MSI-H |  |
| Colorectum | FAP |  |
| ∗Top 15 enriched GO BP terms are showed in the bar plot of each disease state in each tissue. Each row represents a significant GO biological process which is colored according to the -log10(p.adjust). |
| Page: 1 2 3 4 5 6 7 8 9 |
| GO ID | Tissue | Disease Stage | Description | Gene Ratio | Bg Ratio | pvalue | p.adjust | Count |
| GO:0071897 | Colorectum | AD | DNA biosynthetic process | 55/3918 | 180/18723 | 1.46e-03 | 1.24e-02 | 55 |
| GO:00718971 | Colorectum | SER | DNA biosynthetic process | 43/2897 | 180/18723 | 1.99e-03 | 1.98e-02 | 43 |
| GO:00718972 | Colorectum | MSS | DNA biosynthetic process | 50/3467 | 180/18723 | 1.45e-03 | 1.35e-02 | 50 |
| GO:00718973 | Colorectum | MSI-H | DNA biosynthetic process | 26/1319 | 180/18723 | 3.73e-04 | 8.56e-03 | 26 |
| GO:0006260 | Colorectum | MSI-H | DNA replication | 31/1319 | 260/18723 | 2.83e-03 | 3.63e-02 | 31 |
| GO:007189710 | Esophagus | HGIN | DNA biosynthetic process | 44/2587 | 180/18723 | 8.97e-05 | 1.96e-03 | 44 |
| GO:00062604 | Esophagus | ESCC | DNA replication | 181/8552 | 260/18723 | 3.55e-15 | 2.05e-13 | 181 |
| GO:007189716 | Esophagus | ESCC | DNA biosynthetic process | 127/8552 | 180/18723 | 1.04e-11 | 3.85e-10 | 127 |
| GO:00062612 | Esophagus | ESCC | DNA-dependent DNA replication | 100/8552 | 151/18723 | 2.61e-07 | 3.94e-06 | 100 |
| GO:00062601 | Liver | HCC | DNA replication | 146/7958 | 260/18723 | 5.68e-06 | 7.02e-05 | 146 |
| GO:00718975 | Liver | HCC | DNA biosynthetic process | 99/7958 | 180/18723 | 4.66e-04 | 3.08e-03 | 99 |
| GO:0006261 | Liver | HCC | DNA-dependent DNA replication | 80/7958 | 151/18723 | 5.91e-03 | 2.44e-02 | 80 |
| GO:00062603 | Oral cavity | OSCC | DNA replication | 159/7305 | 260/18723 | 3.25e-13 | 1.59e-11 | 159 |
| GO:00718979 | Oral cavity | OSCC | DNA biosynthetic process | 106/7305 | 180/18723 | 4.86e-08 | 8.95e-07 | 106 |
| GO:00062611 | Oral cavity | OSCC | DNA-dependent DNA replication | 84/7305 | 151/18723 | 2.46e-05 | 2.30e-04 | 84 |
| GO:000626011 | Oral cavity | LP | DNA replication | 97/4623 | 260/18723 | 3.67e-06 | 7.75e-05 | 97 |
| GO:007189715 | Oral cavity | LP | DNA biosynthetic process | 71/4623 | 180/18723 | 8.04e-06 | 1.52e-04 | 71 |
| GO:000626012 | Skin | cSCC | DNA replication | 106/4864 | 260/18723 | 1.18e-07 | 2.77e-06 | 106 |
| GO:007189718 | Skin | cSCC | DNA biosynthetic process | 74/4864 | 180/18723 | 6.33e-06 | 8.92e-05 | 74 |
| GO:00062606 | Thyroid | PTC | DNA replication | 114/5968 | 260/18723 | 3.09e-05 | 2.95e-04 | 114 |
| Page: 1 2 |
| Pathway ID | Tissue | Disease Stage | Description | Gene Ratio | Bg Ratio | pvalue | p.adjust | qvalue | Count |
| hsa034205 | Esophagus | HGIN | Nucleotide excision repair | 29/1383 | 63/8465 | 2.96e-08 | 5.36e-07 | 4.26e-07 | 29 |
| hsa0342012 | Esophagus | HGIN | Nucleotide excision repair | 29/1383 | 63/8465 | 2.96e-08 | 5.36e-07 | 4.26e-07 | 29 |
| hsa0342022 | Esophagus | ESCC | Nucleotide excision repair | 54/4205 | 63/8465 | 2.01e-09 | 2.17e-08 | 1.11e-08 | 54 |
| hsa034104 | Esophagus | ESCC | Base excision repair | 38/4205 | 44/8465 | 3.59e-07 | 2.62e-06 | 1.34e-06 | 38 |
| hsa030304 | Esophagus | ESCC | DNA replication | 32/4205 | 36/8465 | 7.71e-07 | 5.06e-06 | 2.59e-06 | 32 |
| hsa034304 | Esophagus | ESCC | Mismatch repair | 21/4205 | 23/8465 | 2.85e-05 | 1.35e-04 | 6.90e-05 | 21 |
| hsa0342032 | Esophagus | ESCC | Nucleotide excision repair | 54/4205 | 63/8465 | 2.01e-09 | 2.17e-08 | 1.11e-08 | 54 |
| hsa0341011 | Esophagus | ESCC | Base excision repair | 38/4205 | 44/8465 | 3.59e-07 | 2.62e-06 | 1.34e-06 | 38 |
| hsa0303011 | Esophagus | ESCC | DNA replication | 32/4205 | 36/8465 | 7.71e-07 | 5.06e-06 | 2.59e-06 | 32 |
| hsa0343011 | Esophagus | ESCC | Mismatch repair | 21/4205 | 23/8465 | 2.85e-05 | 1.35e-04 | 6.90e-05 | 21 |
| hsa03420 | Liver | Cirrhotic | Nucleotide excision repair | 29/2530 | 63/8465 | 4.81e-03 | 1.74e-02 | 1.07e-02 | 29 |
| hsa034201 | Liver | Cirrhotic | Nucleotide excision repair | 29/2530 | 63/8465 | 4.81e-03 | 1.74e-02 | 1.07e-02 | 29 |
| hsa034202 | Liver | HCC | Nucleotide excision repair | 41/4020 | 63/8465 | 3.59e-03 | 1.12e-02 | 6.22e-03 | 41 |
| hsa034203 | Liver | HCC | Nucleotide excision repair | 41/4020 | 63/8465 | 3.59e-03 | 1.12e-02 | 6.22e-03 | 41 |
| hsa034204 | Oral cavity | OSCC | Nucleotide excision repair | 49/3704 | 63/8465 | 3.48e-08 | 2.91e-07 | 1.48e-07 | 49 |
| hsa03030 | Oral cavity | OSCC | DNA replication | 31/3704 | 36/8465 | 1.70e-07 | 1.19e-06 | 6.03e-07 | 31 |
| hsa03410 | Oral cavity | OSCC | Base excision repair | 32/3704 | 44/8465 | 9.11e-05 | 3.25e-04 | 1.65e-04 | 32 |
| hsa03430 | Oral cavity | OSCC | Mismatch repair | 19/3704 | 23/8465 | 1.55e-04 | 5.34e-04 | 2.72e-04 | 19 |
| hsa0342011 | Oral cavity | OSCC | Nucleotide excision repair | 49/3704 | 63/8465 | 3.48e-08 | 2.91e-07 | 1.48e-07 | 49 |
| hsa030301 | Oral cavity | OSCC | DNA replication | 31/3704 | 36/8465 | 1.70e-07 | 1.19e-06 | 6.03e-07 | 31 |
| Page: 1 2 |
Top |
Cell-cell communication analysis |
| Identification of potential cell-cell interactions between two cell types and their ligand-receptor pairs for different disease states |
| Ligand | Receptor | LRpair | Pathway | Tissue | Disease Stage |
| Page: 1 |
Top |
Single-cell gene regulatory network inference analysis |
| Find out the significant the regulons (TFs) and the target genes of each regulon across cell types for different disease states |
| TF | Cell Type | Tissue | Disease Stage | Target Gene | RSS | Regulon Activity |
| POLD2 | ICAF | Colorectum | Healthy | RPS21,CROCC,CDCA7, etc. | 1.88e-02 |  |
| POLD2 | LYMEND | Colorectum | MSS | RPS21,CROCC,CDCA7, etc. | 0.00e+00 |  |
| POLD2 | VFIB | Colorectum | MSS | RPS21,CROCC,CDCA7, etc. | 0.00e+00 | |
| POLD2 | MYOFIB | Colorectum | SER | RPS21,CROCC,CDCA7, etc. | 2.12e-01 |  |
| POLD2 | SURF | Endometrium | ADJ | CENPX,HTATIP2,ZWINT, etc. | 0.00e+00 |  |
| POLD2 | BAS | Endometrium | ADJ | CENPX,HTATIP2,ZWINT, etc. | 0.00e+00 | |
| POLD2 | MEGA | Pancreas | ADJ | RPS17,AC092069.1,C19orf33, etc. | 5.12e-02 |  |
| POLD2 | PVA | Pancreas | PanIN | RPS17,AC092069.1,C19orf33, etc. | 1.15e-01 |  |
| POLD2 | MVA | Pancreas | PDAC | RPS17,AC092069.1,C19orf33, etc. | 1.58e-01 |  |
| POLD2 | MESC | Stomach | Healthy | DNAJB11,LFNG,TRAM1, etc. | 1.39e-02 |  |
| ∗The dot plots of a searched regulon are shown for all cell subpopulations in each disease state of each tissue based on the regulon specific score inferred using pySCENIC and by calculating the average expression. |
| Page: 1 |
Top |
Somatic mutation of malignant transformation related genes |
| Annotation of somatic variants for genes involved in malignant transformation |
| Hugo Symbol | Variant Class | Variant Classification | dbSNP RS | HGVSc | HGVSp | HGVSp Short | SWISSPROT | BIOTYPE | SIFT | PolyPhen | Tumor Sample Barcode | Tissue | Histology | Sex | Age | Stage | Therapy Types | Drugs | Outcome |
| POLD2 | SNV | Missense_Mutation | novel | c.584N>T | p.Ala195Val | p.A195V | protein_coding | deleterious(0) | probably_damaging(0.988) | TCGA-EA-A410-01 | Cervix | cervical & endocervical cancer | Female | <65 | I/II | Unknown | Unknown | SD | |
| POLD2 | SNV | Missense_Mutation | c.704N>T | p.Ser235Phe | p.S235F | protein_coding | deleterious(0) | probably_damaging(0.999) | TCGA-FU-A770-01 | Cervix | cervical & endocervical cancer | Female | <65 | III/IV | Unknown | Unknown | SD | ||
| POLD2 | SNV | Missense_Mutation | c.994N>T | p.Gly332Cys | p.G332C | protein_coding | deleterious(0) | probably_damaging(0.999) | TCGA-A6-2686-01 | Colorectum | colon adenocarcinoma | Female | >=65 | I/II | Unknown | Unknown | SD | ||
| POLD2 | SNV | Missense_Mutation | rs768064825 | c.664G>A | p.Ala222Thr | p.A222T | protein_coding | tolerated(0.39) | benign(0.003) | TCGA-AA-3713-01 | Colorectum | colon adenocarcinoma | Male | >=65 | III/IV | Chemotherapy | 5-fluorouracil | PR | |
| POLD2 | SNV | Missense_Mutation | c.389N>C | p.Gly130Ala | p.G130A | protein_coding | deleterious(0) | probably_damaging(0.987) | TCGA-CK-4951-01 | Colorectum | colon adenocarcinoma | Female | >=65 | I/II | Unknown | Unknown | PD | ||
| POLD2 | SNV | Missense_Mutation | rs752936314 | c.1483N>A | p.Asp495Asn | p.D495N | protein_coding | deleterious_low_confidence(0.03) | benign(0.119) | TCGA-CM-5341-01 | Colorectum | colon adenocarcinoma | Female | >=65 | III/IV | Chemotherapy | fluorouracil | SD | |
| POLD2 | deletion | Frame_Shift_Del | c.296_299delNNNN | p.Phe99TrpfsTer15 | p.F99Wfs*15 | protein_coding | TCGA-QG-A5Z2-01 | Colorectum | colon adenocarcinoma | Male | <65 | I/II | Unknown | Unknown | SD | ||||
| POLD2 | SNV | Missense_Mutation | rs753677894 | c.248N>A | p.Arg83Gln | p.R83Q | protein_coding | deleterious(0.03) | benign(0.105) | TCGA-A5-A2K3-01 | Endometrium | uterine corpus endometrioid carcinoma | Female | >=65 | I/II | Chemotherapy | carboplatin | SD | |
| POLD2 | SNV | Missense_Mutation | c.389G>A | p.Gly130Asp | p.G130D | protein_coding | deleterious(0) | probably_damaging(0.997) | TCGA-AJ-A3BH-01 | Endometrium | uterine corpus endometrioid carcinoma | Female | Unknown | I/II | Unknown | Unknown | SD | ||
| POLD2 | SNV | Missense_Mutation | c.404C>A | p.Ala135Asp | p.A135D | protein_coding | tolerated(0.46) | benign(0.003) | TCGA-AP-A051-01 | Endometrium | uterine corpus endometrioid carcinoma | Female | >=65 | I/II | Unknown | Unknown | SD |
| Page: 1 2 3 4 |
Top |
Related drugs of malignant transformation related genes |
| Identification of chemicals and drugs interact with genes involved in malignant transfromation |
| (DGIdb 4.0) |
| Entrez ID | Symbol | Category | Interaction Types | Drug Claim Name | Drug Name | PMIDs |
| Page: 1 |

Copyright 2023-Present -The University of Texas Health Science Center at Houston |