
|
|||||
|
 | |
| |
| |
| |
| |
| |
|
Gene: POLA2 |
Gene summary for POLA2 |
| Gene information | Species | Human | Gene symbol | POLA2 | Gene ID | 23649 |
| Gene name | DNA polymerase alpha 2, accessory subunit | |
| Gene Alias | POLA2 | |
| Cytomap | 11q13.1 | |
| Gene Type | protein-coding | GO ID | GO:0006139 | UniProtAcc | Q14181 |
Top |
Malignant transformation analysis |
| Identification of the aberrant gene expression in precancerous and cancerous lesions by comparing the gene expression of stem-like cells in diseased tissues with normal stem cells |
| Entrez ID | Symbol | Replicates | Species | Organ | Tissue | Adj P-value | Log2FC | Malignancy |
| 23649 | POLA2 | LZE7T | Human | Esophagus | ESCC | 2.56e-05 | 2.27e-01 | 0.0667 |
| 23649 | POLA2 | LZE22T | Human | Esophagus | ESCC | 1.54e-04 | 2.48e-01 | 0.068 |
| 23649 | POLA2 | LZE6T | Human | Esophagus | ESCC | 1.62e-02 | 1.35e-01 | 0.0845 |
| 23649 | POLA2 | P2T-E | Human | Esophagus | ESCC | 1.30e-15 | 3.04e-01 | 0.1177 |
| 23649 | POLA2 | P4T-E | Human | Esophagus | ESCC | 1.78e-10 | 2.63e-01 | 0.1323 |
| 23649 | POLA2 | P5T-E | Human | Esophagus | ESCC | 9.32e-03 | 1.42e-01 | 0.1327 |
| 23649 | POLA2 | P8T-E | Human | Esophagus | ESCC | 4.44e-08 | 1.49e-01 | 0.0889 |
| 23649 | POLA2 | P10T-E | Human | Esophagus | ESCC | 6.56e-15 | 3.13e-01 | 0.116 |
| 23649 | POLA2 | P15T-E | Human | Esophagus | ESCC | 5.37e-05 | 1.71e-01 | 0.1149 |
| 23649 | POLA2 | P16T-E | Human | Esophagus | ESCC | 9.35e-10 | 2.18e-01 | 0.1153 |
| 23649 | POLA2 | P17T-E | Human | Esophagus | ESCC | 2.68e-03 | 2.18e-01 | 0.1278 |
| 23649 | POLA2 | P19T-E | Human | Esophagus | ESCC | 2.95e-08 | 3.71e-01 | 0.1662 |
| 23649 | POLA2 | P21T-E | Human | Esophagus | ESCC | 5.84e-08 | 2.17e-01 | 0.1617 |
| 23649 | POLA2 | P23T-E | Human | Esophagus | ESCC | 3.36e-03 | 1.22e-01 | 0.108 |
| 23649 | POLA2 | P27T-E | Human | Esophagus | ESCC | 1.84e-03 | 1.31e-01 | 0.1055 |
| 23649 | POLA2 | P28T-E | Human | Esophagus | ESCC | 2.06e-08 | 1.93e-01 | 0.1149 |
| 23649 | POLA2 | P30T-E | Human | Esophagus | ESCC | 4.44e-04 | 2.25e-01 | 0.137 |
| 23649 | POLA2 | P31T-E | Human | Esophagus | ESCC | 4.41e-07 | 2.16e-01 | 0.1251 |
| 23649 | POLA2 | P32T-E | Human | Esophagus | ESCC | 1.62e-13 | 2.89e-01 | 0.1666 |
| 23649 | POLA2 | P36T-E | Human | Esophagus | ESCC | 2.09e-07 | 2.42e-01 | 0.1187 |
| Page: 1 2 3 |
| Tissue | Expression Dynamics | Abbreviation |
| Esophagus | 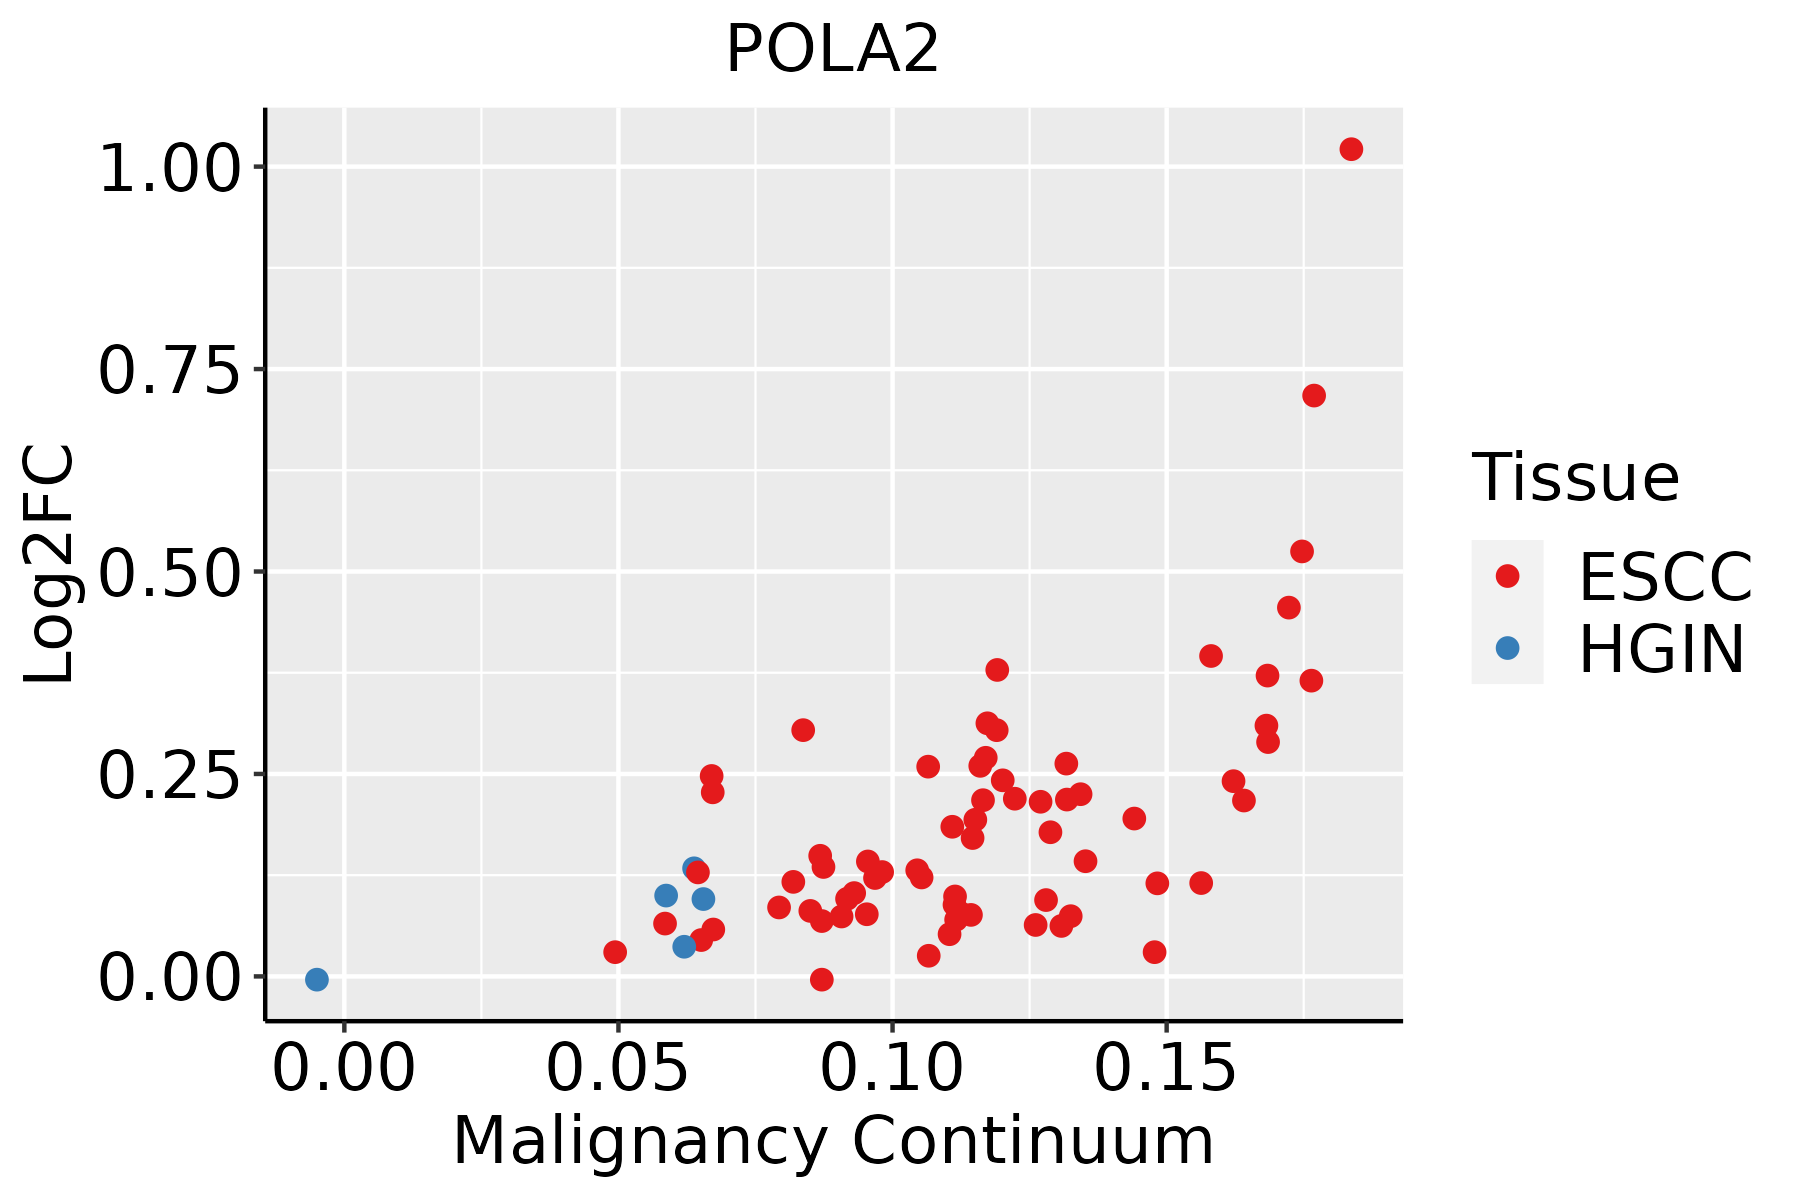 | ESCC: Esophageal squamous cell carcinoma |
| HGIN: High-grade intraepithelial neoplasias | ||
| LGIN: Low-grade intraepithelial neoplasias | ||
| Oral Cavity | 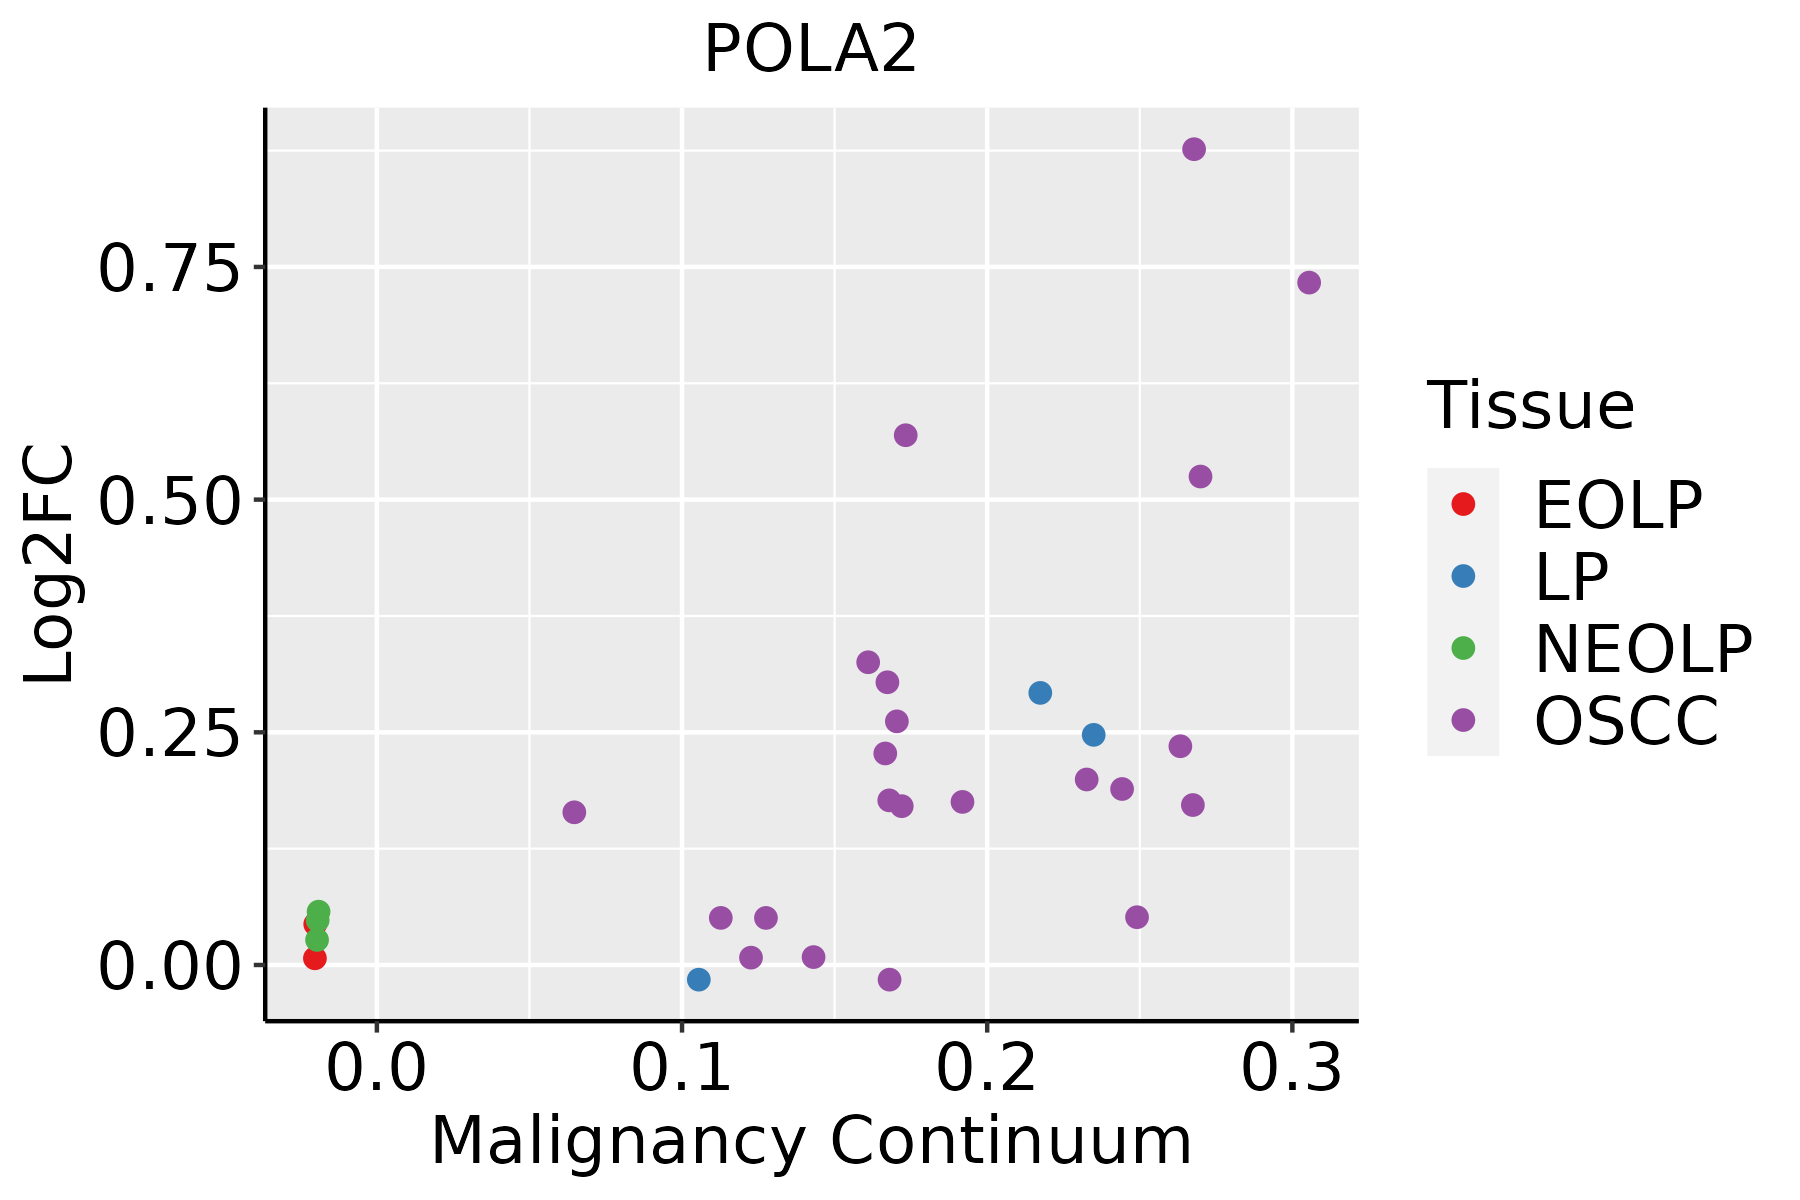 | EOLP: Erosive Oral lichen planus |
| LP: leukoplakia | ||
| NEOLP: Non-erosive oral lichen planus | ||
| OSCC: Oral squamous cell carcinoma |
| ∗log2FC in expression of this searched gene in stem-like cells from each diseased tissue sample relative to stem-like cells in normal samples in each tissue plotted against the malignancy continuum. Samples are colored based on if they are from different disease stage. |
Top |
Malignant transformation related pathway analysis |
| Find out the enriched GO biological processes and KEGG pathways involved in transition from healthy to precancer to cancer |
| Tissue | Disease Stage | Enriched GO biological Processes |
| Colorectum | AD |  |
| Colorectum | SER |  |
| Colorectum | MSS |  |
| Colorectum | MSI-H |  |
| Colorectum | FAP |  |
| ∗Top 15 enriched GO BP terms are showed in the bar plot of each disease state in each tissue. Each row represents a significant GO biological process which is colored according to the -log10(p.adjust). |
| Page: 1 2 3 4 5 6 7 8 9 |
| GO ID | Tissue | Disease Stage | Description | Gene Ratio | Bg Ratio | pvalue | p.adjust | Count |
| GO:00062604 | Esophagus | ESCC | DNA replication | 181/8552 | 260/18723 | 3.55e-15 | 2.05e-13 | 181 |
| GO:00062612 | Esophagus | ESCC | DNA-dependent DNA replication | 100/8552 | 151/18723 | 2.61e-07 | 3.94e-06 | 100 |
| GO:00062701 | Esophagus | ESCC | DNA replication initiation | 27/8552 | 34/18723 | 6.01e-05 | 4.62e-04 | 27 |
| GO:00062603 | Oral cavity | OSCC | DNA replication | 159/7305 | 260/18723 | 3.25e-13 | 1.59e-11 | 159 |
| GO:00062611 | Oral cavity | OSCC | DNA-dependent DNA replication | 84/7305 | 151/18723 | 2.46e-05 | 2.30e-04 | 84 |
| GO:0006270 | Oral cavity | OSCC | DNA replication initiation | 25/7305 | 34/18723 | 4.63e-05 | 3.90e-04 | 25 |
| GO:000626011 | Oral cavity | LP | DNA replication | 97/4623 | 260/18723 | 3.67e-06 | 7.75e-05 | 97 |
| Page: 1 |
| Pathway ID | Tissue | Disease Stage | Description | Gene Ratio | Bg Ratio | pvalue | p.adjust | qvalue | Count |
| hsa030304 | Esophagus | ESCC | DNA replication | 32/4205 | 36/8465 | 7.71e-07 | 5.06e-06 | 2.59e-06 | 32 |
| hsa0303011 | Esophagus | ESCC | DNA replication | 32/4205 | 36/8465 | 7.71e-07 | 5.06e-06 | 2.59e-06 | 32 |
| hsa03030 | Oral cavity | OSCC | DNA replication | 31/3704 | 36/8465 | 1.70e-07 | 1.19e-06 | 6.03e-07 | 31 |
| hsa030301 | Oral cavity | OSCC | DNA replication | 31/3704 | 36/8465 | 1.70e-07 | 1.19e-06 | 6.03e-07 | 31 |
| hsa030302 | Oral cavity | LP | DNA replication | 23/2418 | 36/8465 | 1.08e-05 | 7.79e-05 | 5.02e-05 | 23 |
| hsa030303 | Oral cavity | LP | DNA replication | 23/2418 | 36/8465 | 1.08e-05 | 7.79e-05 | 5.02e-05 | 23 |
| Page: 1 |
Top |
Cell-cell communication analysis |
| Identification of potential cell-cell interactions between two cell types and their ligand-receptor pairs for different disease states |
| Ligand | Receptor | LRpair | Pathway | Tissue | Disease Stage |
| Page: 1 |
Top |
Single-cell gene regulatory network inference analysis |
| Find out the significant the regulons (TFs) and the target genes of each regulon across cell types for different disease states |
| TF | Cell Type | Tissue | Disease Stage | Target Gene | RSS | Regulon Activity |
| ∗The dot plots of a searched regulon are shown for all cell subpopulations in each disease state of each tissue based on the regulon specific score inferred using pySCENIC and by calculating the average expression. |
| Page: 1 |
Top |
Somatic mutation of malignant transformation related genes |
| Annotation of somatic variants for genes involved in malignant transformation |
| Hugo Symbol | Variant Class | Variant Classification | dbSNP RS | HGVSc | HGVSp | HGVSp Short | SWISSPROT | BIOTYPE | SIFT | PolyPhen | Tumor Sample Barcode | Tissue | Histology | Sex | Age | Stage | Therapy Types | Drugs | Outcome |
| POLA2 | SNV | Missense_Mutation | c.191C>G | p.Ser64Cys | p.S64C | Q14181 | protein_coding | deleterious(0.05) | possibly_damaging(0.8) | TCGA-AC-A23H-01 | Breast | breast invasive carcinoma | Female | >=65 | I/II | Unknown | Unknown | PD | |
| POLA2 | SNV | Missense_Mutation | c.669G>C | p.Lys223Asn | p.K223N | Q14181 | protein_coding | tolerated(0.07) | possibly_damaging(0.614) | TCGA-AC-A23H-01 | Breast | breast invasive carcinoma | Female | >=65 | I/II | Unknown | Unknown | PD | |
| POLA2 | SNV | Missense_Mutation | c.191N>A | p.Ser64Tyr | p.S64Y | Q14181 | protein_coding | tolerated(0.05) | possibly_damaging(0.748) | TCGA-AN-A046-01 | Breast | breast invasive carcinoma | Female | >=65 | I/II | Unknown | Unknown | SD | |
| POLA2 | SNV | Missense_Mutation | c.1072N>A | p.Asp358Asn | p.D358N | Q14181 | protein_coding | tolerated(0.1) | possibly_damaging(0.87) | TCGA-BH-A0HF-01 | Breast | breast invasive carcinoma | Female | >=65 | I/II | Hormone Therapy | arimidex | SD | |
| POLA2 | SNV | Missense_Mutation | novel | c.1304N>C | p.Tyr435Ser | p.Y435S | Q14181 | protein_coding | deleterious(0) | probably_damaging(0.998) | TCGA-E9-A22A-01 | Breast | breast invasive carcinoma | Female | >=65 | I/II | Hormone Therapy | tamoxiphen | SD |
| POLA2 | insertion | Frame_Shift_Ins | novel | c.1737_1738insAGGCAGGAAGATCACTTGAGGTTAGGAGTTTT | p.Ala580ArgfsTer47 | p.A580Rfs*47 | Q14181 | protein_coding | TCGA-A7-A0CE-01 | Breast | breast invasive carcinoma | Female | <65 | I/II | Chemotherapy | adriamycin | SD | ||
| POLA2 | insertion | In_Frame_Ins | novel | c.917_918insCCTGCTCCAAAGACTGTCATTCTTATGCTGTGACCTTCCTTTGGT | p.Gly306_Ile307insLeuLeuGlnArgLeuSerPheLeuCysCysAspLeuProLeuVal | p.G306_I307insLLQRLSFLCCDLPLV | Q14181 | protein_coding | TCGA-AN-A04A-01 | Breast | breast invasive carcinoma | Female | <65 | III/IV | Unknown | Unknown | SD | ||
| POLA2 | SNV | Missense_Mutation | rs200610658 | c.1447N>A | p.Glu483Lys | p.E483K | Q14181 | protein_coding | deleterious(0) | probably_damaging(0.998) | TCGA-C5-A2LZ-01 | Cervix | cervical & endocervical cancer | Female | >=65 | III/IV | Unknown | Unknown | PD |
| POLA2 | SNV | Missense_Mutation | c.1228N>T | p.Ile410Phe | p.I410F | Q14181 | protein_coding | deleterious(0.03) | benign(0.023) | TCGA-A6-4105-01 | Colorectum | colon adenocarcinoma | Male | >=65 | I/II | Unknown | Unknown | PD | |
| POLA2 | SNV | Missense_Mutation | c.363G>T | p.Gln121His | p.Q121H | Q14181 | protein_coding | deleterious(0.02) | benign(0.038) | TCGA-CA-6718-01 | Colorectum | colon adenocarcinoma | Male | <65 | I/II | Unknown | Unknown | PD |
| Page: 1 2 3 4 |
Top |
Related drugs of malignant transformation related genes |
| Identification of chemicals and drugs interact with genes involved in malignant transfromation |
| (DGIdb 4.0) |
| Entrez ID | Symbol | Category | Interaction Types | Drug Claim Name | Drug Name | PMIDs |
| 23649 | POLA2 | NA | DACARBAZINE | DACARBAZINE | ||
| 23649 | POLA2 | NA | DACARBAZINE | DACARBAZINE |
| Page: 1 |

Copyright 2023-Present -The University of Texas Health Science Center at Houston |