
|
|||||
|
 | |
| |
| |
| |
| |
| |
|
Gene: POLA1 |
Gene summary for POLA1 |
| Gene information | Species | Human | Gene symbol | POLA1 | Gene ID | 5422 |
| Gene name | DNA polymerase alpha 1, catalytic subunit | |
| Gene Alias | NSX | |
| Cytomap | Xp22.11-p21.3 | |
| Gene Type | protein-coding | GO ID | GO:0000278 | UniProtAcc | A6NMQ1 |
Top |
Malignant transformation analysis |
| Identification of the aberrant gene expression in precancerous and cancerous lesions by comparing the gene expression of stem-like cells in diseased tissues with normal stem cells |
| Entrez ID | Symbol | Replicates | Species | Organ | Tissue | Adj P-value | Log2FC | Malignancy |
| 5422 | POLA1 | CCI_1 | Human | Cervix | CC | 6.23e-09 | 7.91e-01 | 0.528 |
| 5422 | POLA1 | CCI_2 | Human | Cervix | CC | 8.48e-09 | 9.55e-01 | 0.5249 |
| 5422 | POLA1 | CCI_3 | Human | Cervix | CC | 2.72e-13 | 7.89e-01 | 0.516 |
| 5422 | POLA1 | AEH-subject5 | Human | Endometrium | AEH | 7.32e-03 | 2.10e-01 | -0.2953 |
| Page: 1 |
| Tissue | Expression Dynamics | Abbreviation |
| Cervix | 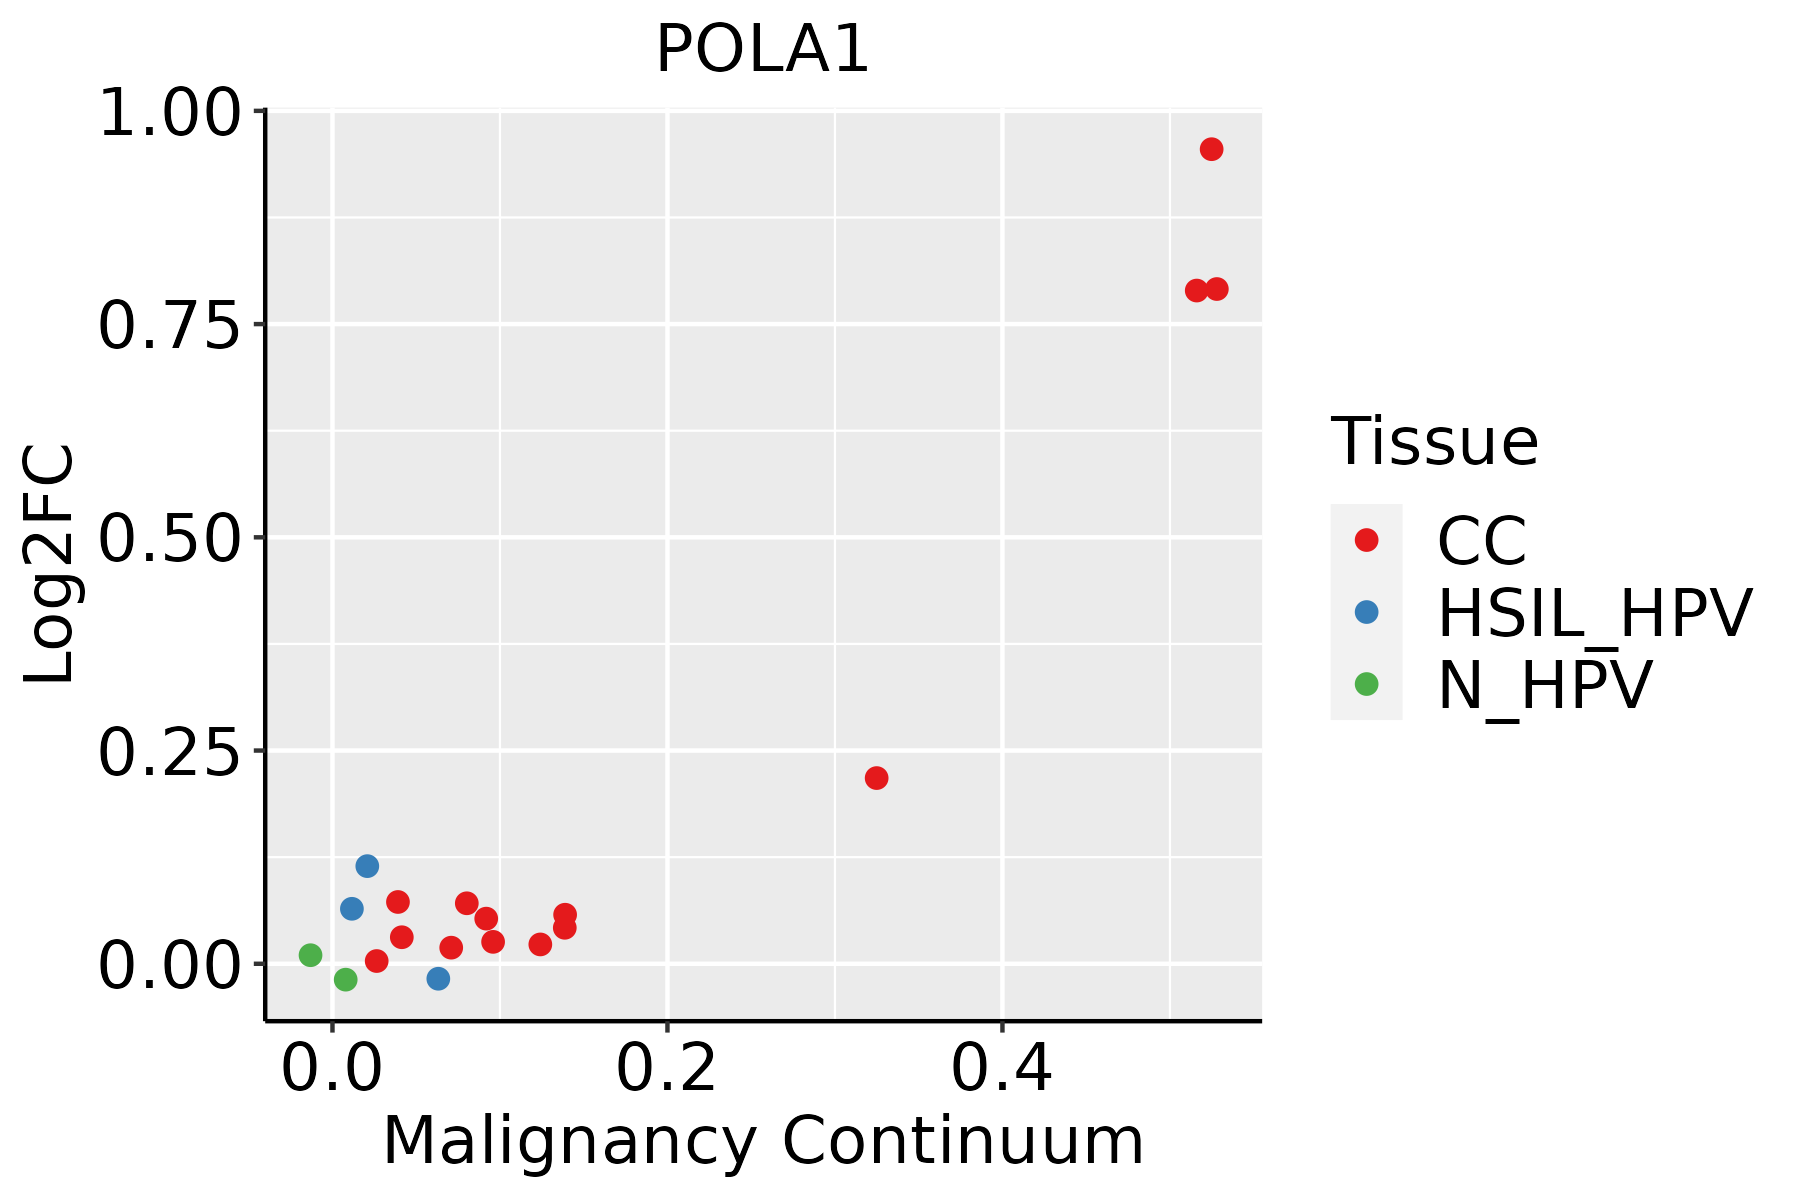 | CC: Cervix cancer |
| HSIL_HPV: HPV-infected high-grade squamous intraepithelial lesions | ||
| N_HPV: HPV-infected normal cervix | ||
| Endometrium | 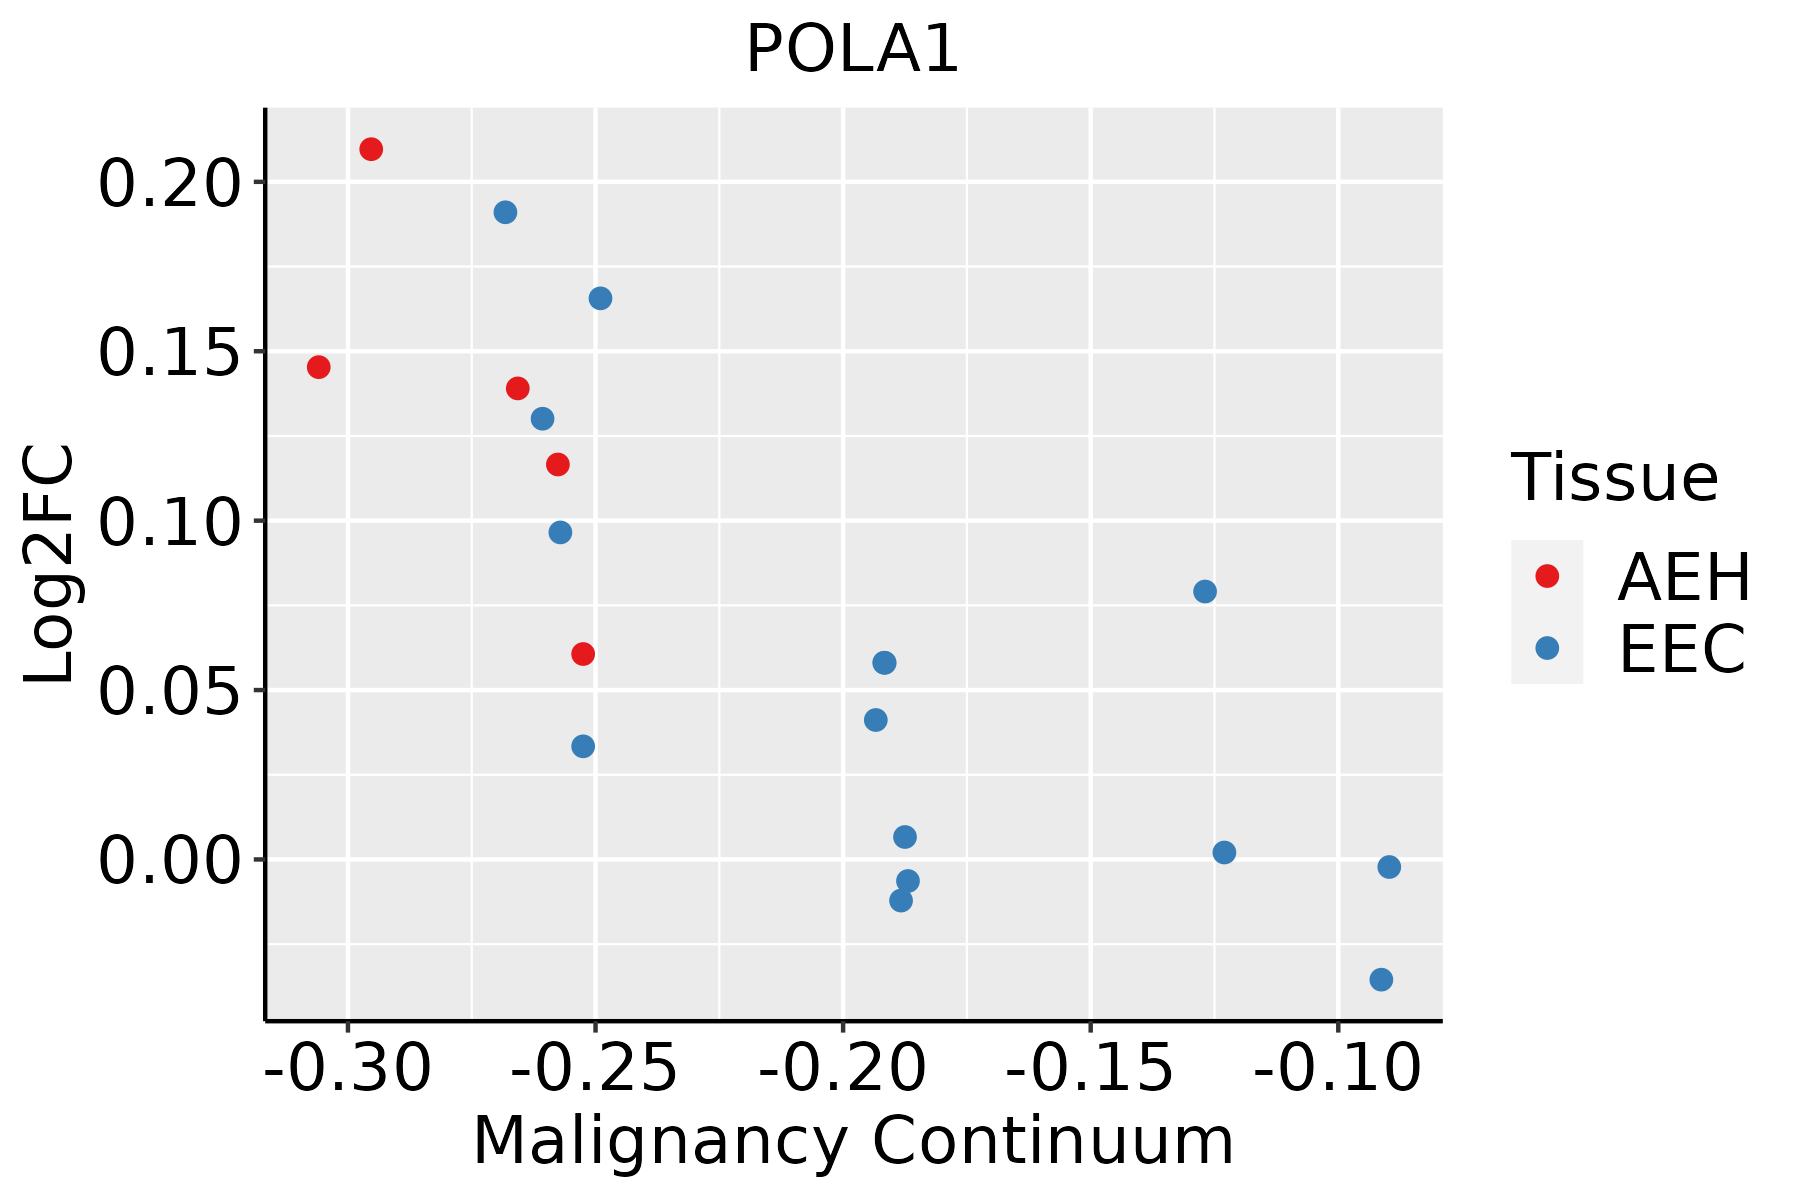 | AEH: Atypical endometrial hyperplasia |
| EEC: Endometrioid Cancer |
| ∗log2FC in expression of this searched gene in stem-like cells from each diseased tissue sample relative to stem-like cells in normal samples in each tissue plotted against the malignancy continuum. Samples are colored based on if they are from different disease stage. |
Top |
Malignant transformation related pathway analysis |
| Find out the enriched GO biological processes and KEGG pathways involved in transition from healthy to precancer to cancer |
| Tissue | Disease Stage | Enriched GO biological Processes |
| Colorectum | AD |  |
| Colorectum | SER |  |
| Colorectum | MSS |  |
| Colorectum | MSI-H |  |
| Colorectum | FAP |  |
| ∗Top 15 enriched GO BP terms are showed in the bar plot of each disease state in each tissue. Each row represents a significant GO biological process which is colored according to the -log10(p.adjust). |
| Page: 1 2 3 4 5 6 7 8 9 |
| GO ID | Tissue | Disease Stage | Description | Gene Ratio | Bg Ratio | pvalue | p.adjust | Count |
| GO:00062602 | Cervix | CC | DNA replication | 48/2311 | 260/18723 | 2.70e-03 | 1.85e-02 | 48 |
| GO:00324791 | Cervix | CC | regulation of type I interferon production | 21/2311 | 95/18723 | 5.32e-03 | 3.10e-02 | 21 |
| GO:00326061 | Cervix | CC | type I interferon production | 21/2311 | 95/18723 | 5.32e-03 | 3.10e-02 | 21 |
| GO:00718977 | Endometrium | AEH | DNA biosynthetic process | 37/2100 | 180/18723 | 1.87e-04 | 2.39e-03 | 37 |
| Page: 1 |
| Pathway ID | Tissue | Disease Stage | Description | Gene Ratio | Bg Ratio | pvalue | p.adjust | qvalue | Count |
| Page: 1 |
Top |
Cell-cell communication analysis |
| Identification of potential cell-cell interactions between two cell types and their ligand-receptor pairs for different disease states |
| Ligand | Receptor | LRpair | Pathway | Tissue | Disease Stage |
| Page: 1 |
Top |
Single-cell gene regulatory network inference analysis |
| Find out the significant the regulons (TFs) and the target genes of each regulon across cell types for different disease states |
| TF | Cell Type | Tissue | Disease Stage | Target Gene | RSS | Regulon Activity |
| ∗The dot plots of a searched regulon are shown for all cell subpopulations in each disease state of each tissue based on the regulon specific score inferred using pySCENIC and by calculating the average expression. |
| Page: 1 |
Top |
Somatic mutation of malignant transformation related genes |
| Annotation of somatic variants for genes involved in malignant transformation |
| Hugo Symbol | Variant Class | Variant Classification | dbSNP RS | HGVSc | HGVSp | HGVSp Short | SWISSPROT | BIOTYPE | SIFT | PolyPhen | Tumor Sample Barcode | Tissue | Histology | Sex | Age | Stage | Therapy Types | Drugs | Outcome |
| POLA1 | SNV | Missense_Mutation | c.3777N>T | p.Lys1259Asn | p.K1259N | protein_coding | tolerated(0.08) | benign(0.269) | TCGA-A7-A0CD-01 | Breast | breast invasive carcinoma | Female | >=65 | I/II | Hormone Therapy | arimidex | SD | ||
| POLA1 | SNV | Missense_Mutation | novel | c.169N>C | p.Val57Leu | p.V57L | protein_coding | tolerated(0.08) | possibly_damaging(0.547) | TCGA-A7-A4SE-01 | Breast | breast invasive carcinoma | Female | <65 | I/II | Chemotherapy | adriamycin | CR | |
| POLA1 | SNV | Missense_Mutation | novel | c.1681A>C | p.Asn561His | p.N561H | protein_coding | tolerated(0.08) | benign(0.247) | TCGA-AN-A046-01 | Breast | breast invasive carcinoma | Female | >=65 | I/II | Unknown | Unknown | SD | |
| POLA1 | SNV | Missense_Mutation | novel | c.2260G>T | p.Asp754Tyr | p.D754Y | protein_coding | deleterious(0) | probably_damaging(0.996) | TCGA-AN-A046-01 | Breast | breast invasive carcinoma | Female | >=65 | I/II | Unknown | Unknown | SD | |
| POLA1 | SNV | Missense_Mutation | c.2482G>A | p.Glu828Lys | p.E828K | protein_coding | deleterious(0.04) | benign(0.026) | TCGA-AN-A046-01 | Breast | breast invasive carcinoma | Female | >=65 | I/II | Unknown | Unknown | SD | ||
| POLA1 | SNV | Missense_Mutation | novel | c.4338C>A | p.Phe1446Leu | p.F1446L | protein_coding | tolerated(0.64) | benign(0.038) | TCGA-AN-A046-01 | Breast | breast invasive carcinoma | Female | >=65 | I/II | Unknown | Unknown | SD | |
| POLA1 | SNV | Missense_Mutation | novel | c.1988N>G | p.Pro663Arg | p.P663R | protein_coding | deleterious(0) | probably_damaging(0.985) | TCGA-B6-A3ZX-01 | Breast | breast invasive carcinoma | Female | <65 | III/IV | Chemotherapy | cyclophosphamide | PD | |
| POLA1 | SNV | Missense_Mutation | c.76N>G | p.Arg26Gly | p.R26G | protein_coding | deleterious(0) | probably_damaging(0.987) | TCGA-BH-A0B6-01 | Breast | breast invasive carcinoma | Female | <65 | I/II | Unknown | Unknown | SD | ||
| POLA1 | SNV | Missense_Mutation | novel | c.3683N>C | p.Arg1228Pro | p.R1228P | protein_coding | deleterious(0) | probably_damaging(0.999) | TCGA-BH-A1F5-01 | Breast | breast invasive carcinoma | Female | <65 | I/II | Unknown | Unknown | SD | |
| POLA1 | SNV | Missense_Mutation | c.2402N>T | p.Ala801Val | p.A801V | protein_coding | deleterious(0) | probably_damaging(1) | TCGA-C8-A12K-01 | Breast | breast invasive carcinoma | Female | >=65 | I/II | Unknown | Unknown | SD |
| Page: 1 2 3 4 5 6 7 8 9 10 11 12 13 14 15 16 17 18 19 |
Top |
Related drugs of malignant transformation related genes |
| Identification of chemicals and drugs interact with genes involved in malignant transfromation |
| (DGIdb 4.0) |
| Entrez ID | Symbol | Category | Interaction Types | Drug Claim Name | Drug Name | PMIDs |
| 5422 | POLA1 | DNA DIRECTED RNA POLYMERASE, DRUGGABLE GENOME, DNA REPAIR | BROMOVINYL DEOXYURIDINE | |||
| 5422 | POLA1 | DNA DIRECTED RNA POLYMERASE, DRUGGABLE GENOME, DNA REPAIR | FLUDARABINE | FLUDARABINE | ||
| 5422 | POLA1 | DNA DIRECTED RNA POLYMERASE, DRUGGABLE GENOME, DNA REPAIR | CLOFARABINE | CLOFARABINE | ||
| 5422 | POLA1 | DNA DIRECTED RNA POLYMERASE, DRUGGABLE GENOME, DNA REPAIR | CLOFARABINE | CLOFARABINE | ||
| 5422 | POLA1 | DNA DIRECTED RNA POLYMERASE, DRUGGABLE GENOME, DNA REPAIR | DIGALLIC ACID | DIGALLIC ACID | 1705574 | |
| 5422 | POLA1 | DNA DIRECTED RNA POLYMERASE, DRUGGABLE GENOME, DNA REPAIR | NELARABINE | NELARABINE | ||
| 5422 | POLA1 | DNA DIRECTED RNA POLYMERASE, DRUGGABLE GENOME, DNA REPAIR | FLUDARABINE | FLUDARABINE | ||
| 5422 | POLA1 | DNA DIRECTED RNA POLYMERASE, DRUGGABLE GENOME, DNA REPAIR | inhibitor | CHEMBL803 | CYTARABINE | |
| 5422 | POLA1 | DNA DIRECTED RNA POLYMERASE, DRUGGABLE GENOME, DNA REPAIR | inhibitor | CHEMBL1750 | CLOFARABINE | |
| 5422 | POLA1 | DNA DIRECTED RNA POLYMERASE, DRUGGABLE GENOME, DNA REPAIR | inhibitor | CHEMBL1096882 | FLUDARABINE PHOSPHATE |
| Page: 1 2 |

Copyright 2023-Present -The University of Texas Health Science Center at Houston |