
|
|||||
|
 | |
| |
| |
| |
| |
| |
|
Gene: POGLUT1 |
Gene summary for POGLUT1 |
| Gene information | Species | Human | Gene symbol | POGLUT1 | Gene ID | 56983 |
| Gene name | protein O-glucosyltransferase 1 | |
| Gene Alias | C3orf9 | |
| Cytomap | 3q13.33 | |
| Gene Type | protein-coding | GO ID | GO:0001756 | UniProtAcc | Q8NBL1 |
Top |
Malignant transformation analysis |
| Identification of the aberrant gene expression in precancerous and cancerous lesions by comparing the gene expression of stem-like cells in diseased tissues with normal stem cells |
| Entrez ID | Symbol | Replicates | Species | Organ | Tissue | Adj P-value | Log2FC | Malignancy |
| 56983 | POGLUT1 | LZE2T | Human | Esophagus | ESCC | 1.30e-05 | 5.96e-01 | 0.082 |
| 56983 | POGLUT1 | LZE4T | Human | Esophagus | ESCC | 3.42e-09 | 2.34e-01 | 0.0811 |
| 56983 | POGLUT1 | LZE8T | Human | Esophagus | ESCC | 4.64e-02 | 8.86e-02 | 0.067 |
| 56983 | POGLUT1 | LZE22T | Human | Esophagus | ESCC | 2.33e-02 | 2.52e-01 | 0.068 |
| 56983 | POGLUT1 | LZE24T | Human | Esophagus | ESCC | 3.39e-07 | 1.08e-01 | 0.0596 |
| 56983 | POGLUT1 | P1T-E | Human | Esophagus | ESCC | 1.77e-05 | 2.40e-01 | 0.0875 |
| 56983 | POGLUT1 | P2T-E | Human | Esophagus | ESCC | 1.08e-13 | 2.95e-01 | 0.1177 |
| 56983 | POGLUT1 | P4T-E | Human | Esophagus | ESCC | 2.01e-06 | 1.79e-01 | 0.1323 |
| 56983 | POGLUT1 | P5T-E | Human | Esophagus | ESCC | 2.84e-11 | 1.00e-01 | 0.1327 |
| 56983 | POGLUT1 | P8T-E | Human | Esophagus | ESCC | 4.10e-15 | 2.39e-01 | 0.0889 |
| 56983 | POGLUT1 | P9T-E | Human | Esophagus | ESCC | 1.78e-10 | 1.97e-01 | 0.1131 |
| 56983 | POGLUT1 | P10T-E | Human | Esophagus | ESCC | 1.28e-47 | 7.64e-01 | 0.116 |
| 56983 | POGLUT1 | P11T-E | Human | Esophagus | ESCC | 2.46e-07 | 2.93e-01 | 0.1426 |
| 56983 | POGLUT1 | P12T-E | Human | Esophagus | ESCC | 5.57e-12 | 2.10e-01 | 0.1122 |
| 56983 | POGLUT1 | P15T-E | Human | Esophagus | ESCC | 1.18e-20 | 3.83e-01 | 0.1149 |
| 56983 | POGLUT1 | P16T-E | Human | Esophagus | ESCC | 1.08e-36 | 5.99e-01 | 0.1153 |
| 56983 | POGLUT1 | P17T-E | Human | Esophagus | ESCC | 3.21e-02 | 1.51e-01 | 0.1278 |
| 56983 | POGLUT1 | P20T-E | Human | Esophagus | ESCC | 2.16e-09 | 2.06e-01 | 0.1124 |
| 56983 | POGLUT1 | P21T-E | Human | Esophagus | ESCC | 2.50e-20 | 2.55e-01 | 0.1617 |
| 56983 | POGLUT1 | P22T-E | Human | Esophagus | ESCC | 2.92e-19 | 3.30e-01 | 0.1236 |
| Page: 1 2 3 4 |
| Tissue | Expression Dynamics | Abbreviation |
| Esophagus |  | ESCC: Esophageal squamous cell carcinoma |
| HGIN: High-grade intraepithelial neoplasias | ||
| LGIN: Low-grade intraepithelial neoplasias | ||
| Oral Cavity | 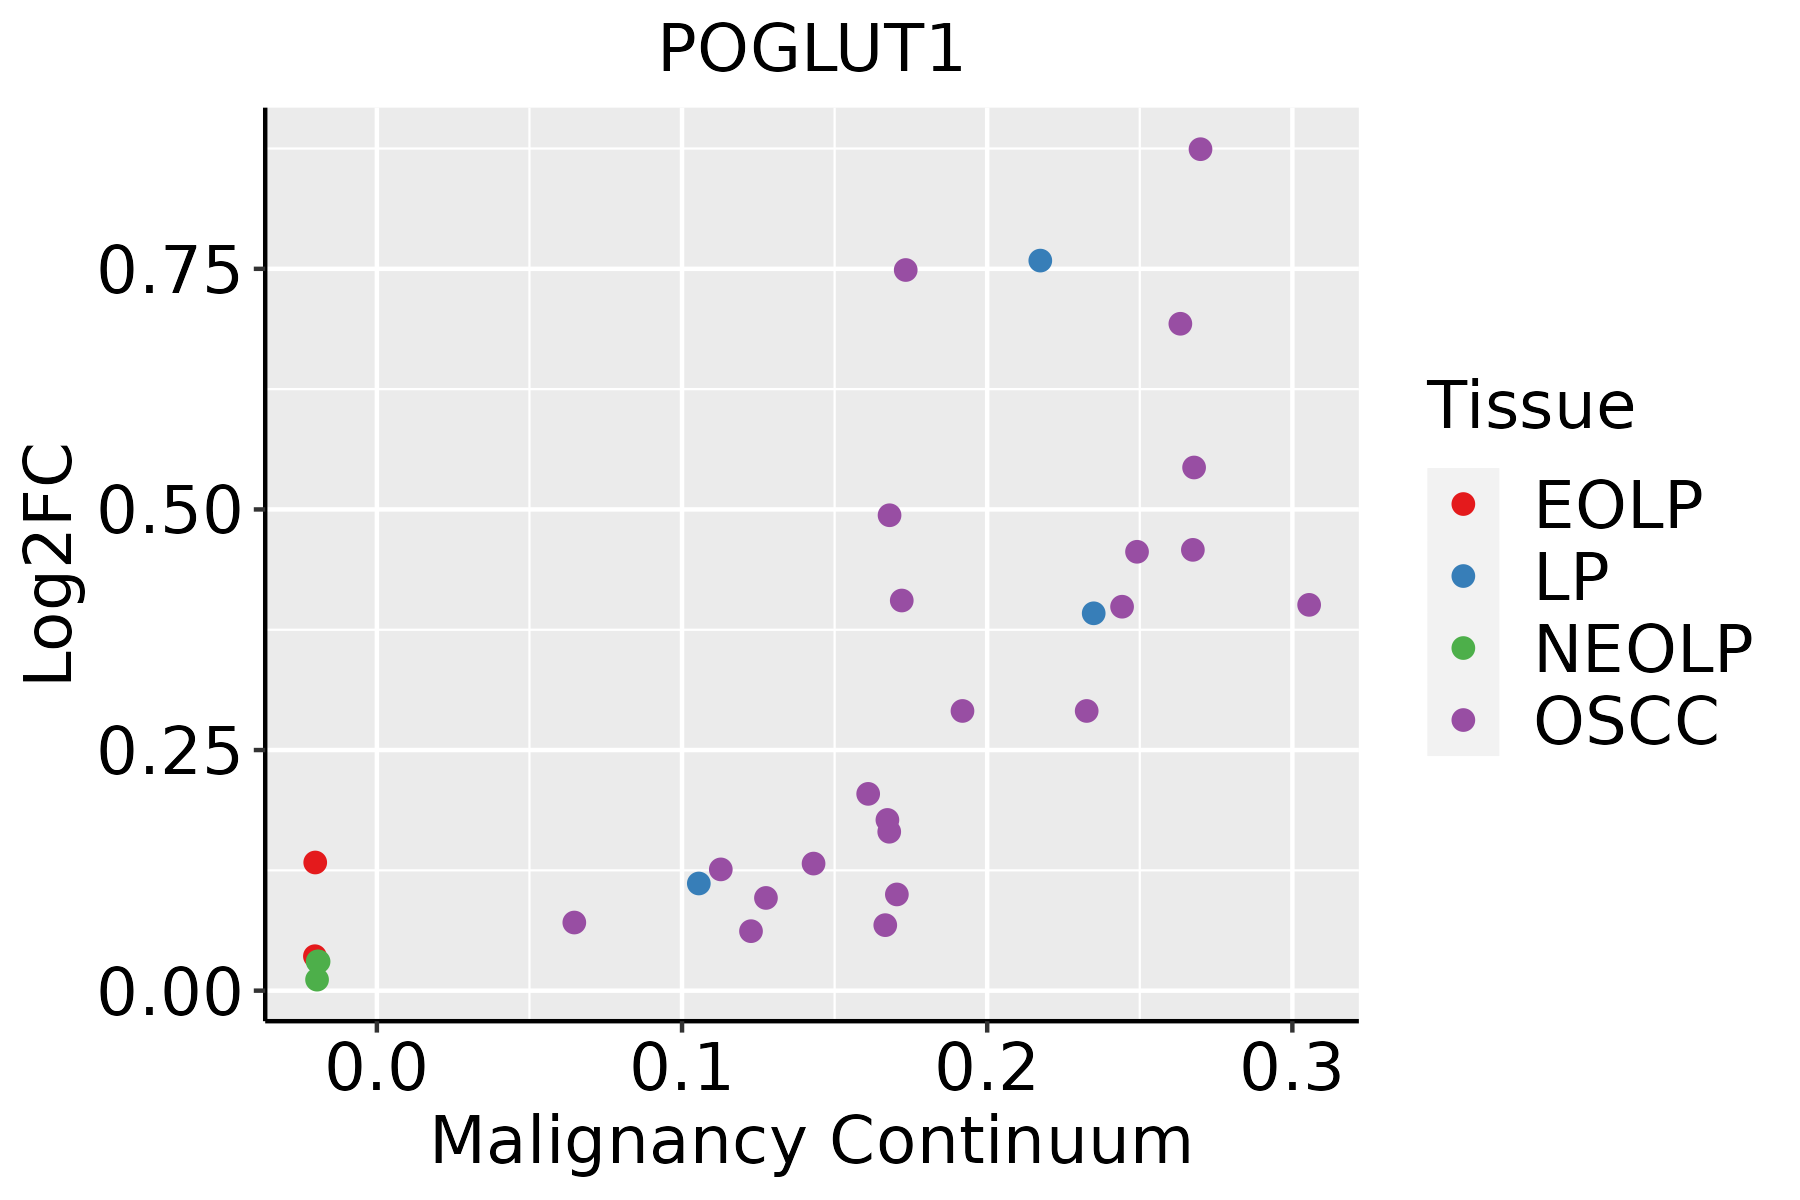 | EOLP: Erosive Oral lichen planus |
| LP: leukoplakia | ||
| NEOLP: Non-erosive oral lichen planus | ||
| OSCC: Oral squamous cell carcinoma |
| ∗log2FC in expression of this searched gene in stem-like cells from each diseased tissue sample relative to stem-like cells in normal samples in each tissue plotted against the malignancy continuum. Samples are colored based on if they are from different disease stage. |
Top |
Malignant transformation related pathway analysis |
| Find out the enriched GO biological processes and KEGG pathways involved in transition from healthy to precancer to cancer |
| Tissue | Disease Stage | Enriched GO biological Processes |
| Colorectum | AD |  |
| Colorectum | SER |  |
| Colorectum | MSS |  |
| Colorectum | MSI-H |  |
| Colorectum | FAP |  |
| ∗Top 15 enriched GO BP terms are showed in the bar plot of each disease state in each tissue. Each row represents a significant GO biological process which is colored according to the -log10(p.adjust). |
| Page: 1 2 3 4 5 6 7 8 9 |
| GO ID | Tissue | Disease Stage | Description | Gene Ratio | Bg Ratio | pvalue | p.adjust | Count |
| GO:00091002 | Esophagus | ESCC | glycoprotein metabolic process | 226/8552 | 387/18723 | 2.64e-07 | 3.94e-06 | 226 |
| GO:00182099 | Esophagus | ESCC | peptidyl-serine modification | 196/8552 | 338/18723 | 3.07e-06 | 3.47e-05 | 196 |
| GO:00073698 | Esophagus | ESCC | gastrulation | 115/8552 | 185/18723 | 4.35e-06 | 4.64e-05 | 115 |
| GO:00700854 | Esophagus | ESCC | glycosylation | 144/8552 | 240/18723 | 5.12e-06 | 5.38e-05 | 144 |
| GO:00064865 | Esophagus | ESCC | protein glycosylation | 135/8552 | 226/18723 | 1.36e-05 | 1.24e-04 | 135 |
| GO:00434135 | Esophagus | ESCC | macromolecule glycosylation | 135/8552 | 226/18723 | 1.36e-05 | 1.24e-04 | 135 |
| GO:00072197 | Esophagus | ESCC | Notch signaling pathway | 106/8552 | 172/18723 | 1.74e-05 | 1.55e-04 | 106 |
| GO:00091012 | Esophagus | ESCC | glycoprotein biosynthetic process | 181/8552 | 317/18723 | 2.54e-05 | 2.15e-04 | 181 |
| GO:00085935 | Esophagus | ESCC | regulation of Notch signaling pathway | 59/8552 | 95/18723 | 9.12e-04 | 4.65e-03 | 59 |
| GO:00604856 | Esophagus | ESCC | mesenchyme development | 156/8552 | 291/18723 | 3.76e-03 | 1.53e-02 | 156 |
| GO:006053716 | Esophagus | ESCC | muscle tissue development | 211/8552 | 403/18723 | 3.84e-03 | 1.56e-02 | 211 |
| GO:00064931 | Esophagus | ESCC | protein O-linked glycosylation | 51/8552 | 86/18723 | 7.54e-03 | 2.70e-02 | 51 |
| GO:0048339 | Esophagus | ESCC | paraxial mesoderm development | 13/8552 | 17/18723 | 1.00e-02 | 3.42e-02 | 13 |
| GO:00182098 | Oral cavity | OSCC | peptidyl-serine modification | 175/7305 | 338/18723 | 1.09e-06 | 1.46e-05 | 175 |
| GO:00072196 | Oral cavity | OSCC | Notch signaling pathway | 92/7305 | 172/18723 | 7.84e-05 | 6.08e-04 | 92 |
| GO:00091001 | Oral cavity | OSCC | glycoprotein metabolic process | 185/7305 | 387/18723 | 2.37e-04 | 1.54e-03 | 185 |
| GO:00073697 | Oral cavity | OSCC | gastrulation | 95/7305 | 185/18723 | 4.17e-04 | 2.54e-03 | 95 |
| GO:00085934 | Oral cavity | OSCC | regulation of Notch signaling pathway | 53/7305 | 95/18723 | 6.64e-04 | 3.72e-03 | 53 |
| GO:00091011 | Oral cavity | OSCC | glycoprotein biosynthetic process | 151/7305 | 317/18723 | 1.01e-03 | 5.26e-03 | 151 |
| GO:00064864 | Oral cavity | OSCC | protein glycosylation | 111/7305 | 226/18723 | 1.22e-03 | 6.10e-03 | 111 |
| Page: 1 2 |
| Pathway ID | Tissue | Disease Stage | Description | Gene Ratio | Bg Ratio | pvalue | p.adjust | qvalue | Count |
| Page: 1 |
Top |
Cell-cell communication analysis |
| Identification of potential cell-cell interactions between two cell types and their ligand-receptor pairs for different disease states |
| Ligand | Receptor | LRpair | Pathway | Tissue | Disease Stage |
| Page: 1 |
Top |
Single-cell gene regulatory network inference analysis |
| Find out the significant the regulons (TFs) and the target genes of each regulon across cell types for different disease states |
| TF | Cell Type | Tissue | Disease Stage | Target Gene | RSS | Regulon Activity |
| ∗The dot plots of a searched regulon are shown for all cell subpopulations in each disease state of each tissue based on the regulon specific score inferred using pySCENIC and by calculating the average expression. |
| Page: 1 |
Top |
Somatic mutation of malignant transformation related genes |
| Annotation of somatic variants for genes involved in malignant transformation |
| Hugo Symbol | Variant Class | Variant Classification | dbSNP RS | HGVSc | HGVSp | HGVSp Short | SWISSPROT | BIOTYPE | SIFT | PolyPhen | Tumor Sample Barcode | Tissue | Histology | Sex | Age | Stage | Therapy Types | Drugs | Outcome |
| POGLUT1 | SNV | Missense_Mutation | novel | c.501G>C | p.Trp167Cys | p.W167C | Q8NBL1 | protein_coding | deleterious(0) | probably_damaging(0.999) | TCGA-AR-A5QQ-01 | Breast | breast invasive carcinoma | Female | >=65 | III/IV | Chemotherapy | carboplatin | PD |
| POGLUT1 | SNV | Missense_Mutation | c.919C>G | p.Pro307Ala | p.P307A | Q8NBL1 | protein_coding | deleterious(0) | probably_damaging(1) | TCGA-E2-A1LH-01 | Breast | breast invasive carcinoma | Female | <65 | I/II | Chemotherapy | adriamycin | SD | |
| POGLUT1 | SNV | Missense_Mutation | c.424G>C | p.Glu142Gln | p.E142Q | Q8NBL1 | protein_coding | tolerated(0.58) | benign(0.013) | TCGA-EK-A2RK-01 | Cervix | cervical & endocervical cancer | Female | >=65 | I/II | Unknown | Unknown | SD | |
| POGLUT1 | SNV | Missense_Mutation | c.731C>T | p.Ser244Phe | p.S244F | Q8NBL1 | protein_coding | deleterious(0.02) | possibly_damaging(0.614) | TCGA-VS-A8QA-01 | Cervix | cervical & endocervical cancer | Female | <65 | I/II | Unknown | Unknown | SD | |
| POGLUT1 | SNV | Missense_Mutation | c.484N>T | p.Pro162Ser | p.P162S | Q8NBL1 | protein_coding | deleterious(0) | probably_damaging(1) | TCGA-AA-A01P-01 | Colorectum | colon adenocarcinoma | Female | >=65 | III/IV | Unknown | Unknown | PD | |
| POGLUT1 | SNV | Missense_Mutation | novel | c.104N>G | p.Phe35Cys | p.F35C | Q8NBL1 | protein_coding | deleterious(0.01) | possibly_damaging(0.784) | TCGA-AZ-4315-01 | Colorectum | colon adenocarcinoma | Male | <65 | I/II | Unknown | Unknown | SD |
| POGLUT1 | SNV | Missense_Mutation | c.872T>C | p.Phe291Ser | p.F291S | Q8NBL1 | protein_coding | deleterious(0) | probably_damaging(0.997) | TCGA-CK-4951-01 | Colorectum | colon adenocarcinoma | Female | >=65 | I/II | Unknown | Unknown | PD | |
| POGLUT1 | SNV | Missense_Mutation | novel | c.653N>A | p.Arg218Gln | p.R218Q | Q8NBL1 | protein_coding | deleterious(0) | probably_damaging(0.984) | TCGA-A5-A0G2-01 | Endometrium | uterine corpus endometrioid carcinoma | Female | <65 | III/IV | Unknown | Unknown | SD |
| POGLUT1 | SNV | Missense_Mutation | novel | c.222G>T | p.Arg74Ser | p.R74S | Q8NBL1 | protein_coding | deleterious(0.03) | benign(0.253) | TCGA-AJ-A3EK-01 | Endometrium | uterine corpus endometrioid carcinoma | Female | <65 | I/II | Chemotherapy | carboplatin | CR |
| POGLUT1 | SNV | Missense_Mutation | novel | c.754C>T | p.Pro252Ser | p.P252S | Q8NBL1 | protein_coding | deleterious(0.04) | possibly_damaging(0.577) | TCGA-AJ-A3EK-01 | Endometrium | uterine corpus endometrioid carcinoma | Female | <65 | I/II | Chemotherapy | carboplatin | CR |
| Page: 1 2 3 4 5 |
Top |
Related drugs of malignant transformation related genes |
| Identification of chemicals and drugs interact with genes involved in malignant transfromation |
| (DGIdb 4.0) |
| Entrez ID | Symbol | Category | Interaction Types | Drug Claim Name | Drug Name | PMIDs |
| Page: 1 |

Copyright 2023-Present -The University of Texas Health Science Center at Houston |