
|
|||||
|
 | |
| |
| |
| |
| |
| |
|
Gene: POFUT2 |
Gene summary for POFUT2 |
| Gene information | Species | Human | Gene symbol | POFUT2 | Gene ID | 23275 |
| Gene name | protein O-fucosyltransferase 2 | |
| Gene Alias | C21orf80 | |
| Cytomap | 21q22.3 | |
| Gene Type | protein-coding | GO ID | GO:0001704 | UniProtAcc | Q9Y2G5 |
Top |
Malignant transformation analysis |
| Identification of the aberrant gene expression in precancerous and cancerous lesions by comparing the gene expression of stem-like cells in diseased tissues with normal stem cells |
| Entrez ID | Symbol | Replicates | Species | Organ | Tissue | Adj P-value | Log2FC | Malignancy |
| 23275 | POFUT2 | P2T-E | Human | Esophagus | ESCC | 7.24e-10 | 1.76e-01 | 0.1177 |
| 23275 | POFUT2 | P4T-E | Human | Esophagus | ESCC | 5.92e-12 | 3.07e-01 | 0.1323 |
| 23275 | POFUT2 | P5T-E | Human | Esophagus | ESCC | 1.67e-10 | 9.46e-02 | 0.1327 |
| 23275 | POFUT2 | P8T-E | Human | Esophagus | ESCC | 4.14e-14 | 1.77e-01 | 0.0889 |
| 23275 | POFUT2 | P10T-E | Human | Esophagus | ESCC | 3.97e-20 | 3.79e-01 | 0.116 |
| 23275 | POFUT2 | P11T-E | Human | Esophagus | ESCC | 3.30e-07 | 3.24e-01 | 0.1426 |
| 23275 | POFUT2 | P12T-E | Human | Esophagus | ESCC | 6.73e-08 | 1.45e-01 | 0.1122 |
| 23275 | POFUT2 | P15T-E | Human | Esophagus | ESCC | 3.31e-06 | 1.81e-01 | 0.1149 |
| 23275 | POFUT2 | P16T-E | Human | Esophagus | ESCC | 4.75e-24 | 4.58e-01 | 0.1153 |
| 23275 | POFUT2 | P17T-E | Human | Esophagus | ESCC | 9.22e-05 | 2.31e-01 | 0.1278 |
| 23275 | POFUT2 | P21T-E | Human | Esophagus | ESCC | 1.70e-16 | 1.78e-01 | 0.1617 |
| 23275 | POFUT2 | P22T-E | Human | Esophagus | ESCC | 1.98e-16 | 1.23e-01 | 0.1236 |
| 23275 | POFUT2 | P23T-E | Human | Esophagus | ESCC | 4.54e-10 | 1.75e-01 | 0.108 |
| 23275 | POFUT2 | P24T-E | Human | Esophagus | ESCC | 1.87e-10 | 1.21e-01 | 0.1287 |
| 23275 | POFUT2 | P26T-E | Human | Esophagus | ESCC | 1.27e-13 | 1.50e-01 | 0.1276 |
| 23275 | POFUT2 | P27T-E | Human | Esophagus | ESCC | 1.50e-12 | 2.19e-01 | 0.1055 |
| 23275 | POFUT2 | P28T-E | Human | Esophagus | ESCC | 5.70e-13 | 2.14e-01 | 0.1149 |
| 23275 | POFUT2 | P30T-E | Human | Esophagus | ESCC | 1.79e-05 | 3.65e-01 | 0.137 |
| 23275 | POFUT2 | P31T-E | Human | Esophagus | ESCC | 2.00e-14 | 1.46e-01 | 0.1251 |
| 23275 | POFUT2 | P32T-E | Human | Esophagus | ESCC | 1.21e-14 | 2.05e-01 | 0.1666 |
| Page: 1 2 3 4 |
| Tissue | Expression Dynamics | Abbreviation |
| Esophagus | 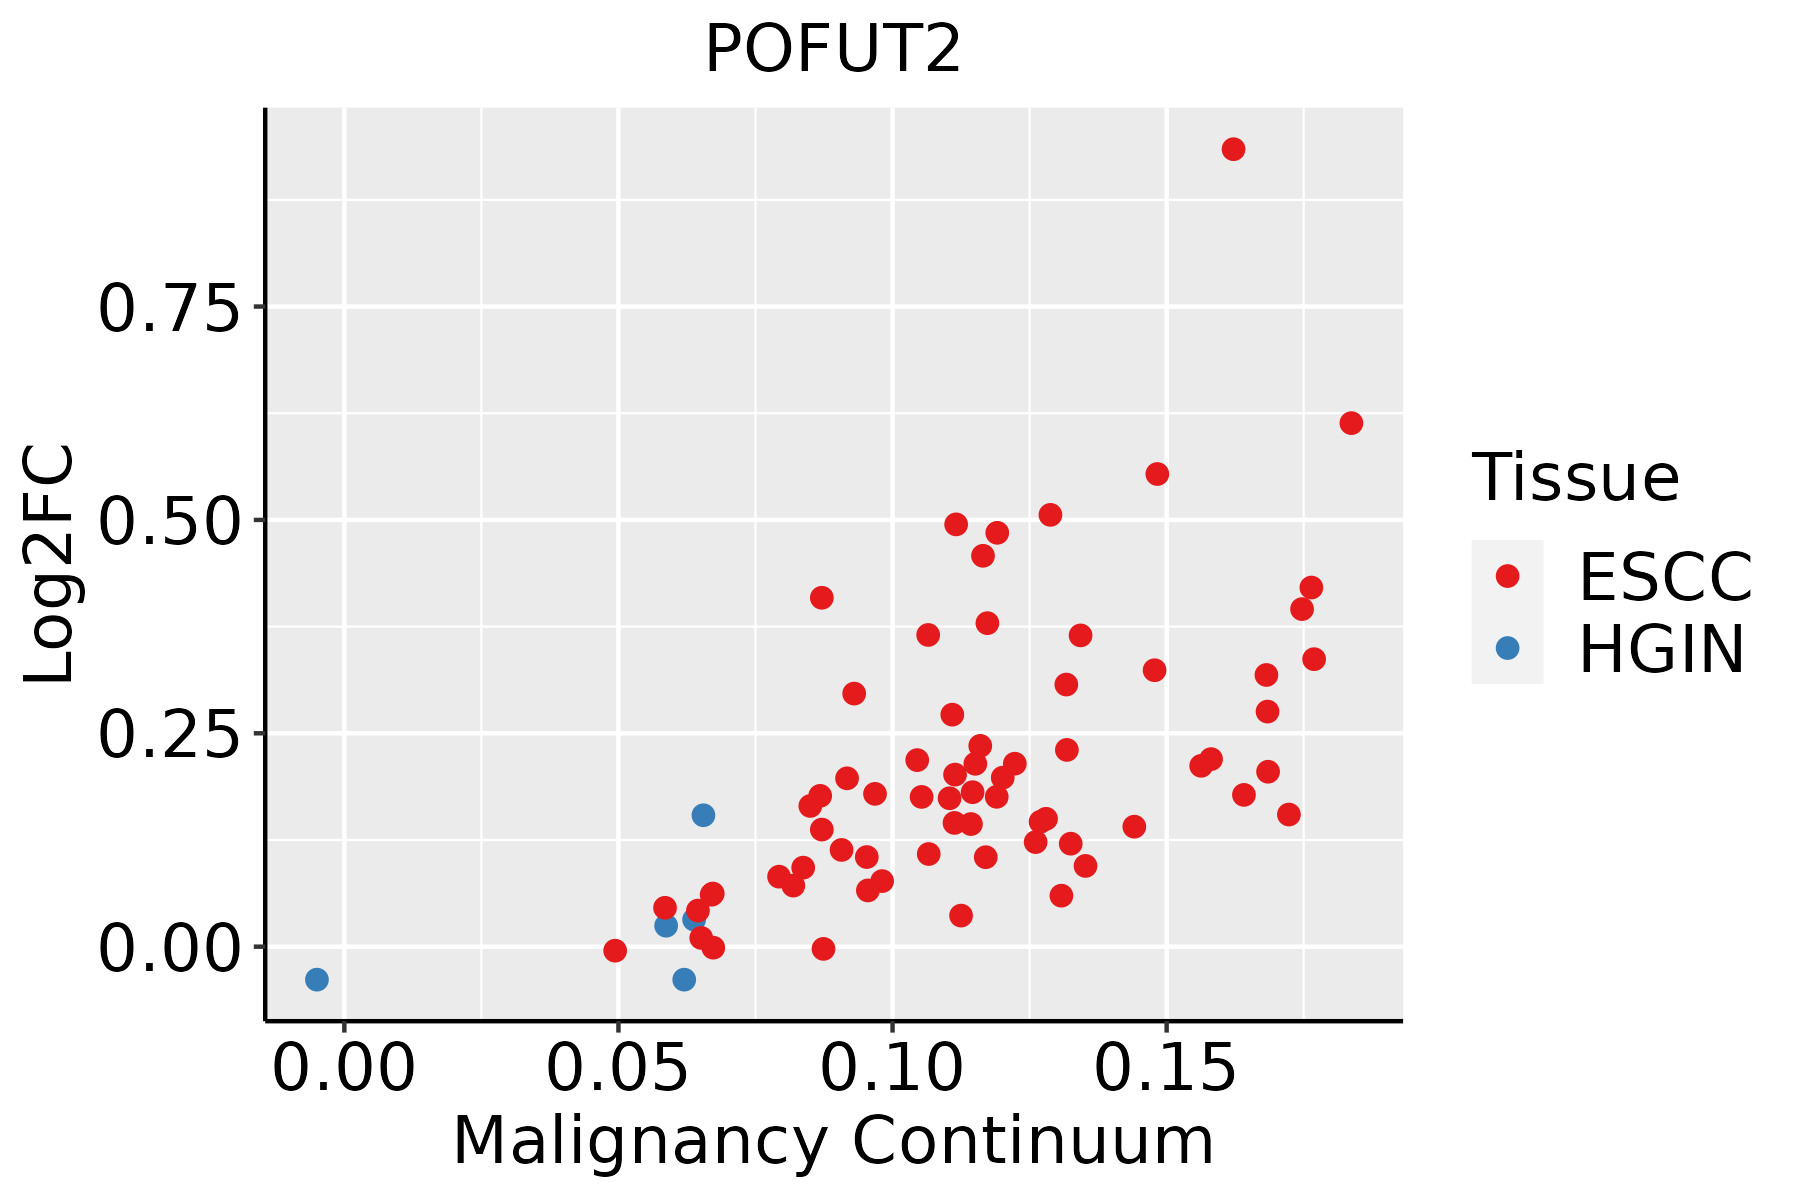 | ESCC: Esophageal squamous cell carcinoma |
| HGIN: High-grade intraepithelial neoplasias | ||
| LGIN: Low-grade intraepithelial neoplasias | ||
| Liver |  | HCC: Hepatocellular carcinoma |
| NAFLD: Non-alcoholic fatty liver disease | ||
| Thyroid |  | ATC: Anaplastic thyroid cancer |
| HT: Hashimoto's thyroiditis | ||
| PTC: Papillary thyroid cancer |
| ∗log2FC in expression of this searched gene in stem-like cells from each diseased tissue sample relative to stem-like cells in normal samples in each tissue plotted against the malignancy continuum. Samples are colored based on if they are from different disease stage. |
Top |
Malignant transformation related pathway analysis |
| Find out the enriched GO biological processes and KEGG pathways involved in transition from healthy to precancer to cancer |
| Tissue | Disease Stage | Enriched GO biological Processes |
| Colorectum | AD |  |
| Colorectum | SER |  |
| Colorectum | MSS |  |
| Colorectum | MSI-H |  |
| Colorectum | FAP |  |
| ∗Top 15 enriched GO BP terms are showed in the bar plot of each disease state in each tissue. Each row represents a significant GO biological process which is colored according to the -log10(p.adjust). |
| Page: 1 2 3 4 5 6 7 8 9 |
| GO ID | Tissue | Disease Stage | Description | Gene Ratio | Bg Ratio | pvalue | p.adjust | Count |
| GO:0006457110 | Esophagus | ESCC | protein folding | 163/8552 | 212/18723 | 1.13e-20 | 1.74e-18 | 163 |
| GO:00059969 | Esophagus | ESCC | monosaccharide metabolic process | 159/8552 | 257/18723 | 1.11e-07 | 1.81e-06 | 159 |
| GO:00193189 | Esophagus | ESCC | hexose metabolic process | 147/8552 | 237/18723 | 2.63e-07 | 3.94e-06 | 147 |
| GO:00091002 | Esophagus | ESCC | glycoprotein metabolic process | 226/8552 | 387/18723 | 2.64e-07 | 3.94e-06 | 226 |
| GO:00073698 | Esophagus | ESCC | gastrulation | 115/8552 | 185/18723 | 4.35e-06 | 4.64e-05 | 115 |
| GO:00700854 | Esophagus | ESCC | glycosylation | 144/8552 | 240/18723 | 5.12e-06 | 5.38e-05 | 144 |
| GO:00064865 | Esophagus | ESCC | protein glycosylation | 135/8552 | 226/18723 | 1.36e-05 | 1.24e-04 | 135 |
| GO:00434135 | Esophagus | ESCC | macromolecule glycosylation | 135/8552 | 226/18723 | 1.36e-05 | 1.24e-04 | 135 |
| GO:00091012 | Esophagus | ESCC | glycoprotein biosynthetic process | 181/8552 | 317/18723 | 2.54e-05 | 2.15e-04 | 181 |
| GO:19033324 | Esophagus | ESCC | regulation of protein folding | 12/8552 | 12/18723 | 8.21e-05 | 6.01e-04 | 12 |
| GO:00018378 | Esophagus | ESCC | epithelial to mesenchymal transition | 95/8552 | 157/18723 | 1.25e-04 | 8.56e-04 | 95 |
| GO:00017044 | Esophagus | ESCC | formation of primary germ layer | 75/8552 | 121/18723 | 2.17e-04 | 1.36e-03 | 75 |
| GO:00487628 | Esophagus | ESCC | mesenchymal cell differentiation | 133/8552 | 236/18723 | 5.94e-04 | 3.22e-03 | 133 |
| GO:00107174 | Esophagus | ESCC | regulation of epithelial to mesenchymal transition | 61/8552 | 99/18723 | 1.01e-03 | 5.09e-03 | 61 |
| GO:00604856 | Esophagus | ESCC | mesenchyme development | 156/8552 | 291/18723 | 3.76e-03 | 1.53e-02 | 156 |
| GO:00064931 | Esophagus | ESCC | protein O-linked glycosylation | 51/8552 | 86/18723 | 7.54e-03 | 2.70e-02 | 51 |
| GO:000645712 | Liver | HCC | protein folding | 160/7958 | 212/18723 | 1.07e-22 | 1.88e-20 | 160 |
| GO:000599621 | Liver | HCC | monosaccharide metabolic process | 167/7958 | 257/18723 | 2.31e-13 | 1.25e-11 | 167 |
| GO:001931821 | Liver | HCC | hexose metabolic process | 155/7958 | 237/18723 | 7.63e-13 | 3.90e-11 | 155 |
| GO:00064862 | Liver | HCC | protein glycosylation | 122/7958 | 226/18723 | 3.11e-04 | 2.21e-03 | 122 |
| Page: 1 2 3 |
| Pathway ID | Tissue | Disease Stage | Description | Gene Ratio | Bg Ratio | pvalue | p.adjust | qvalue | Count |
| Page: 1 |
Top |
Cell-cell communication analysis |
| Identification of potential cell-cell interactions between two cell types and their ligand-receptor pairs for different disease states |
| Ligand | Receptor | LRpair | Pathway | Tissue | Disease Stage |
| Page: 1 |
Top |
Single-cell gene regulatory network inference analysis |
| Find out the significant the regulons (TFs) and the target genes of each regulon across cell types for different disease states |
| TF | Cell Type | Tissue | Disease Stage | Target Gene | RSS | Regulon Activity |
| ∗The dot plots of a searched regulon are shown for all cell subpopulations in each disease state of each tissue based on the regulon specific score inferred using pySCENIC and by calculating the average expression. |
| Page: 1 |
Top |
Somatic mutation of malignant transformation related genes |
| Annotation of somatic variants for genes involved in malignant transformation |
| Hugo Symbol | Variant Class | Variant Classification | dbSNP RS | HGVSc | HGVSp | HGVSp Short | SWISSPROT | BIOTYPE | SIFT | PolyPhen | Tumor Sample Barcode | Tissue | Histology | Sex | Age | Stage | Therapy Types | Drugs | Outcome |
| POFUT2 | SNV | Missense_Mutation | c.389N>C | p.Gly130Ala | p.G130A | Q9Y2G5 | protein_coding | deleterious(0.03) | probably_damaging(0.946) | TCGA-E9-A22E-01 | Breast | breast invasive carcinoma | Female | <65 | III/IV | Chemotherapy | cyclophosphane | SD | |
| POFUT2 | insertion | Frame_Shift_Ins | novel | c.753_754insTCATGCTCCGCCCGCTTCAGCCTCCCAAAGTGCTG | p.Glu252SerfsTer35 | p.E252Sfs*35 | Q9Y2G5 | protein_coding | TCGA-A8-A082-01 | Breast | breast invasive carcinoma | Female | <65 | I/II | Chemotherapy | 5-fluorouracil | CR | ||
| POFUT2 | SNV | Missense_Mutation | c.103A>G | p.Ile35Val | p.I35V | Q9Y2G5 | protein_coding | tolerated(0.69) | benign(0) | TCGA-A6-5661-01 | Colorectum | colon adenocarcinoma | Female | >=65 | I/II | Unknown | Unknown | SD | |
| POFUT2 | SNV | Missense_Mutation | rs748785565 | c.568G>A | p.Val190Ile | p.V190I | Q9Y2G5 | protein_coding | tolerated(0.16) | benign(0.278) | TCGA-A6-6781-01 | Colorectum | colon adenocarcinoma | Male | <65 | III/IV | Chemotherapy | oxaliplatin | SD |
| POFUT2 | SNV | Missense_Mutation | c.1068G>T | p.Trp356Cys | p.W356C | Q9Y2G5 | protein_coding | tolerated(0.06) | possibly_damaging(0.756) | TCGA-AA-3966-01 | Colorectum | colon adenocarcinoma | Female | >=65 | I/II | Unknown | Unknown | SD | |
| POFUT2 | SNV | Missense_Mutation | rs145949373 | c.227N>T | p.Thr76Met | p.T76M | Q9Y2G5 | protein_coding | tolerated(0.1) | benign(0.015) | TCGA-AD-6964-01 | Colorectum | colon adenocarcinoma | Male | <65 | III/IV | Chemotherapy | folfox | PD |
| POFUT2 | SNV | Missense_Mutation | rs773256059 | c.1175N>A | p.Arg392Gln | p.R392Q | Q9Y2G5 | protein_coding | deleterious(0) | probably_damaging(1) | TCGA-AZ-4313-01 | Colorectum | colon adenocarcinoma | Female | <65 | I/II | Unknown | Unknown | SD |
| POFUT2 | SNV | Missense_Mutation | c.1174N>T | p.Arg392Trp | p.R392W | Q9Y2G5 | protein_coding | deleterious(0) | probably_damaging(1) | TCGA-F4-6806-01 | Colorectum | colon adenocarcinoma | Female | <65 | I/II | Chemotherapy | irinotecan | PD | |
| POFUT2 | SNV | Missense_Mutation | rs766610099 | c.853N>A | p.Gly285Arg | p.G285R | Q9Y2G5 | protein_coding | deleterious(0) | probably_damaging(1) | TCGA-G4-6588-01 | Colorectum | colon adenocarcinoma | Female | <65 | I/II | Unknown | Unknown | SD |
| POFUT2 | deletion | Frame_Shift_Del | c.857delG | p.Gly286AlafsTer8 | p.G286Afs*8 | Q9Y2G5 | protein_coding | TCGA-F4-6856-01 | Colorectum | colon adenocarcinoma | Male | <65 | I/II | Ancillary | leucovorin | CR |
| Page: 1 2 3 4 5 |
Top |
Related drugs of malignant transformation related genes |
| Identification of chemicals and drugs interact with genes involved in malignant transfromation |
| (DGIdb 4.0) |
| Entrez ID | Symbol | Category | Interaction Types | Drug Claim Name | Drug Name | PMIDs |
| Page: 1 |

Copyright 2023-Present -The University of Texas Health Science Center at Houston |