
|
|||||
|
 | |
| |
| |
| |
| |
| |
|
Gene: POF1B |
Gene summary for POF1B |
| Gene information | Species | Human | Gene symbol | POF1B | Gene ID | 79983 |
| Gene name | POF1B actin binding protein | |
| Gene Alias | POF | |
| Cytomap | Xq21.1 | |
| Gene Type | protein-coding | GO ID | GO:0000902 | UniProtAcc | Q8WVV4 |
Top |
Malignant transformation analysis |
| Identification of the aberrant gene expression in precancerous and cancerous lesions by comparing the gene expression of stem-like cells in diseased tissues with normal stem cells |
| Entrez ID | Symbol | Replicates | Species | Organ | Tissue | Adj P-value | Log2FC | Malignancy |
| 79983 | POF1B | HTA11_3410_2000001011 | Human | Colorectum | AD | 3.63e-17 | -5.59e-01 | 0.0155 |
| 79983 | POF1B | HTA11_2951_2000001011 | Human | Colorectum | AD | 1.39e-03 | -5.58e-01 | 0.0216 |
| 79983 | POF1B | HTA11_1938_2000001011 | Human | Colorectum | AD | 2.94e-04 | 5.92e-01 | -0.0811 |
| 79983 | POF1B | HTA11_347_2000001011 | Human | Colorectum | AD | 1.76e-14 | 7.09e-01 | -0.1954 |
| 79983 | POF1B | HTA11_3361_2000001011 | Human | Colorectum | AD | 1.13e-06 | -5.21e-01 | -0.1207 |
| 79983 | POF1B | HTA11_866_3004761011 | Human | Colorectum | AD | 4.44e-11 | -5.84e-01 | 0.096 |
| 79983 | POF1B | HTA11_7696_3000711011 | Human | Colorectum | AD | 3.43e-04 | -3.41e-01 | 0.0674 |
| 79983 | POF1B | HTA11_6818_2000001021 | Human | Colorectum | AD | 1.29e-07 | -5.64e-01 | 0.0588 |
| 79983 | POF1B | HTA11_99999970781_79442 | Human | Colorectum | MSS | 5.35e-05 | -4.60e-01 | 0.294 |
| 79983 | POF1B | HTA11_99999965104_69814 | Human | Colorectum | MSS | 9.92e-05 | 6.24e-01 | 0.281 |
| 79983 | POF1B | HTA11_99999971662_82457 | Human | Colorectum | MSS | 1.23e-09 | -5.05e-01 | 0.3859 |
| 79983 | POF1B | HTA11_99999974143_84620 | Human | Colorectum | MSS | 1.87e-17 | -5.61e-01 | 0.3005 |
| 79983 | POF1B | F007 | Human | Colorectum | FAP | 2.49e-11 | 5.22e-01 | 0.1176 |
| 79983 | POF1B | A002-C-010 | Human | Colorectum | FAP | 1.36e-22 | 5.23e-01 | 0.242 |
| 79983 | POF1B | A015-C-203 | Human | Colorectum | FAP | 2.21e-27 | 1.58e-01 | -0.1294 |
| 79983 | POF1B | A015-C-204 | Human | Colorectum | FAP | 8.73e-08 | 2.44e-01 | -0.0228 |
| 79983 | POF1B | A014-C-040 | Human | Colorectum | FAP | 3.58e-11 | 5.12e-01 | -0.1184 |
| 79983 | POF1B | A002-C-201 | Human | Colorectum | FAP | 1.20e-16 | 3.27e-01 | 0.0324 |
| 79983 | POF1B | A002-C-203 | Human | Colorectum | FAP | 4.83e-16 | 5.26e-01 | 0.2786 |
| 79983 | POF1B | A001-C-119 | Human | Colorectum | FAP | 1.41e-02 | -6.65e-02 | -0.1557 |
| Page: 1 2 3 4 5 |
| Tissue | Expression Dynamics | Abbreviation |
| Colorectum (GSE201348) |  | FAP: Familial adenomatous polyposis |
| CRC: Colorectal cancer | ||
| Colorectum (HTA11) |  | AD: Adenomas |
| SER: Sessile serrated lesions | ||
| MSI-H: Microsatellite-high colorectal cancer | ||
| MSS: Microsatellite stable colorectal cancer | ||
| Esophagus |  | ESCC: Esophageal squamous cell carcinoma |
| HGIN: High-grade intraepithelial neoplasias | ||
| LGIN: Low-grade intraepithelial neoplasias | ||
| Liver | 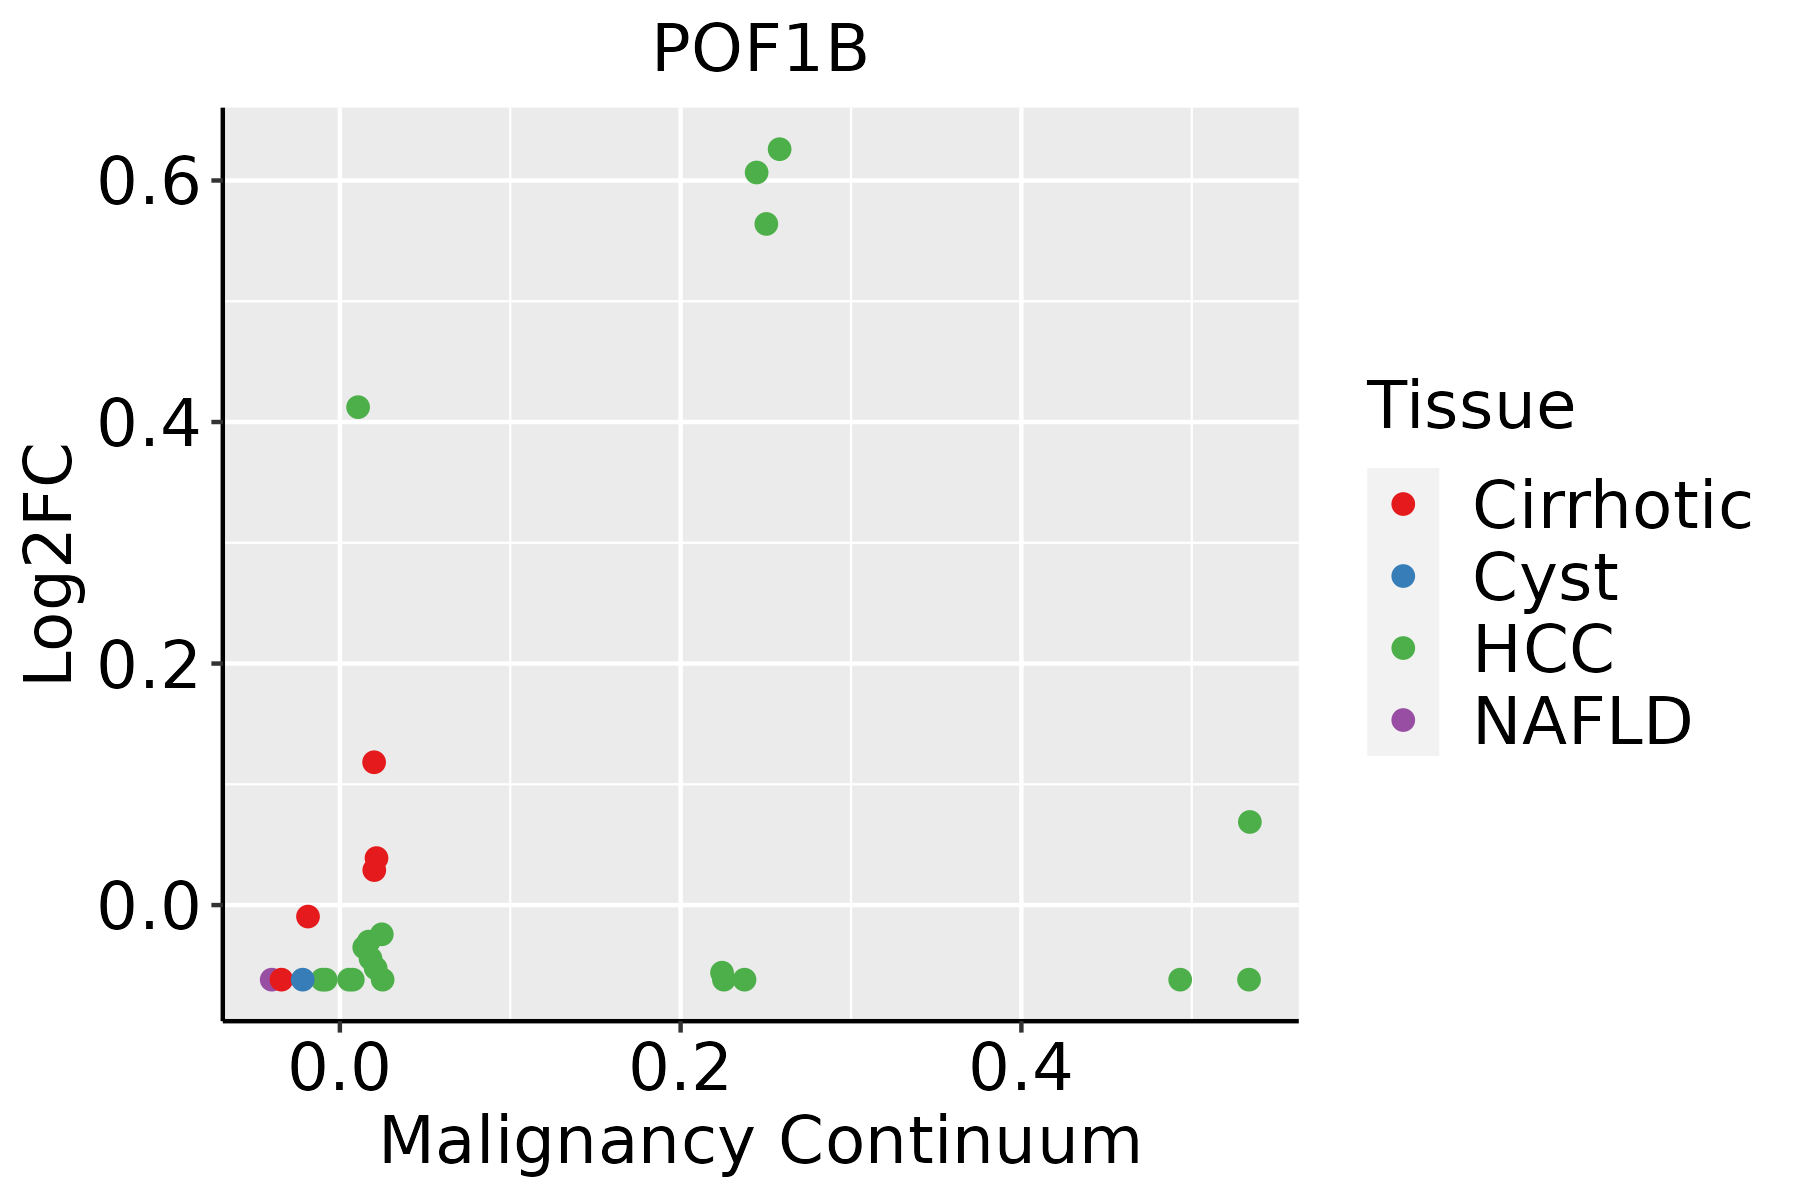 | HCC: Hepatocellular carcinoma |
| NAFLD: Non-alcoholic fatty liver disease |
| ∗log2FC in expression of this searched gene in stem-like cells from each diseased tissue sample relative to stem-like cells in normal samples in each tissue plotted against the malignancy continuum. Samples are colored based on if they are from different disease stage. |
Top |
Malignant transformation related pathway analysis |
| Find out the enriched GO biological processes and KEGG pathways involved in transition from healthy to precancer to cancer |
| Tissue | Disease Stage | Enriched GO biological Processes |
| Colorectum | AD |  |
| Colorectum | SER |  |
| Colorectum | MSS |  |
| Colorectum | MSI-H |  |
| Colorectum | FAP |  |
| ∗Top 15 enriched GO BP terms are showed in the bar plot of each disease state in each tissue. Each row represents a significant GO biological process which is colored according to the -log10(p.adjust). |
| Page: 1 2 3 4 5 6 7 8 9 |
| GO ID | Tissue | Disease Stage | Description | Gene Ratio | Bg Ratio | pvalue | p.adjust | Count |
| GO:0007015 | Colorectum | AD | actin filament organization | 167/3918 | 442/18723 | 1.65e-16 | 7.94e-14 | 167 |
| GO:0002064 | Colorectum | AD | epithelial cell development | 89/3918 | 220/18723 | 2.98e-11 | 3.52e-09 | 89 |
| GO:0045216 | Colorectum | AD | cell-cell junction organization | 80/3918 | 200/18723 | 5.57e-10 | 4.58e-08 | 80 |
| GO:0034329 | Colorectum | AD | cell junction assembly | 136/3918 | 420/18723 | 2.02e-08 | 1.15e-06 | 136 |
| GO:0007043 | Colorectum | AD | cell-cell junction assembly | 57/3918 | 146/18723 | 4.18e-07 | 1.61e-05 | 57 |
| GO:0043297 | Colorectum | AD | apical junction assembly | 34/3918 | 78/18723 | 5.31e-06 | 1.37e-04 | 34 |
| GO:0120193 | Colorectum | AD | tight junction organization | 33/3918 | 80/18723 | 2.93e-05 | 5.42e-04 | 33 |
| GO:0120192 | Colorectum | AD | tight junction assembly | 31/3918 | 74/18723 | 3.53e-05 | 6.43e-04 | 31 |
| GO:0070830 | Colorectum | AD | bicellular tight junction assembly | 28/3918 | 70/18723 | 2.15e-04 | 2.83e-03 | 28 |
| GO:00070152 | Colorectum | MSS | actin filament organization | 146/3467 | 442/18723 | 1.16e-13 | 2.67e-11 | 146 |
| GO:00020642 | Colorectum | MSS | epithelial cell development | 81/3467 | 220/18723 | 1.02e-10 | 1.06e-08 | 81 |
| GO:00452162 | Colorectum | MSS | cell-cell junction organization | 69/3467 | 200/18723 | 5.07e-08 | 2.70e-06 | 69 |
| GO:00343292 | Colorectum | MSS | cell junction assembly | 120/3467 | 420/18723 | 2.51e-07 | 1.07e-05 | 120 |
| GO:00070432 | Colorectum | MSS | cell-cell junction assembly | 50/3467 | 146/18723 | 4.24e-06 | 1.21e-04 | 50 |
| GO:00432972 | Colorectum | MSS | apical junction assembly | 28/3467 | 78/18723 | 2.12e-04 | 2.95e-03 | 28 |
| GO:01201932 | Colorectum | MSS | tight junction organization | 27/3467 | 80/18723 | 8.31e-04 | 8.68e-03 | 27 |
| GO:01201922 | Colorectum | MSS | tight junction assembly | 25/3467 | 74/18723 | 1.25e-03 | 1.20e-02 | 25 |
| GO:00708302 | Colorectum | MSS | bicellular tight junction assembly | 22/3467 | 70/18723 | 6.42e-03 | 4.27e-02 | 22 |
| GO:00070154 | Colorectum | FAP | actin filament organization | 125/2622 | 442/18723 | 1.97e-15 | 3.03e-12 | 125 |
| GO:00343293 | Colorectum | FAP | cell junction assembly | 105/2622 | 420/18723 | 1.03e-09 | 2.18e-07 | 105 |
| Page: 1 2 3 |
| Pathway ID | Tissue | Disease Stage | Description | Gene Ratio | Bg Ratio | pvalue | p.adjust | qvalue | Count |
| Page: 1 |
Top |
Cell-cell communication analysis |
| Identification of potential cell-cell interactions between two cell types and their ligand-receptor pairs for different disease states |
| Ligand | Receptor | LRpair | Pathway | Tissue | Disease Stage |
| Page: 1 |
Top |
Single-cell gene regulatory network inference analysis |
| Find out the significant the regulons (TFs) and the target genes of each regulon across cell types for different disease states |
| TF | Cell Type | Tissue | Disease Stage | Target Gene | RSS | Regulon Activity |
| ∗The dot plots of a searched regulon are shown for all cell subpopulations in each disease state of each tissue based on the regulon specific score inferred using pySCENIC and by calculating the average expression. |
| Page: 1 |
Top |
Somatic mutation of malignant transformation related genes |
| Annotation of somatic variants for genes involved in malignant transformation |
| Hugo Symbol | Variant Class | Variant Classification | dbSNP RS | HGVSc | HGVSp | HGVSp Short | SWISSPROT | BIOTYPE | SIFT | PolyPhen | Tumor Sample Barcode | Tissue | Histology | Sex | Age | Stage | Therapy Types | Drugs | Outcome |
| POF1B | SNV | Missense_Mutation | novel | c.1469N>T | p.Ser490Leu | p.S490L | Q8WVV4 | protein_coding | deleterious(0) | probably_damaging(0.985) | TCGA-A8-A081-01 | Breast | breast invasive carcinoma | Female | >=65 | I/II | Unknown | Unknown | SD |
| POF1B | SNV | Missense_Mutation | c.169N>T | p.Gly57Trp | p.G57W | Q8WVV4 | protein_coding | deleterious_low_confidence(0) | probably_damaging(1) | TCGA-A8-A09Z-01 | Breast | breast invasive carcinoma | Female | >=65 | I/II | Unknown | Unknown | SD | |
| POF1B | SNV | Missense_Mutation | c.553C>G | p.Gln185Glu | p.Q185E | Q8WVV4 | protein_coding | tolerated_low_confidence(0.09) | benign(0.037) | TCGA-AC-A23C-01 | Breast | breast invasive carcinoma | Female | <65 | I/II | Chemotherapy | chemo | CR | |
| POF1B | SNV | Missense_Mutation | novel | c.842G>T | p.Arg281Ile | p.R281I | Q8WVV4 | protein_coding | deleterious(0) | possibly_damaging(0.653) | TCGA-AN-A046-01 | Breast | breast invasive carcinoma | Female | >=65 | I/II | Unknown | Unknown | SD |
| POF1B | SNV | Missense_Mutation | c.394N>A | p.Pro132Thr | p.P132T | Q8WVV4 | protein_coding | tolerated_low_confidence(0.1) | probably_damaging(0.998) | TCGA-EW-A3U0-01 | Breast | breast invasive carcinoma | Female | <65 | III/IV | Chemotherapy | cisplatin | CR | |
| POF1B | deletion | Frame_Shift_Del | novel | c.1744delA | p.Thr582GlnfsTer8 | p.T582Qfs*8 | Q8WVV4 | protein_coding | TCGA-D8-A27V-01 | Breast | breast invasive carcinoma | Female | <65 | I/II | Hormone Therapy | tamoxiphen | SD | ||
| POF1B | SNV | Missense_Mutation | novel | c.1144N>T | p.Ala382Ser | p.A382S | Q8WVV4 | protein_coding | deleterious(0.02) | benign(0.092) | TCGA-2W-A8YY-01 | Cervix | cervical & endocervical cancer | Female | <65 | I/II | Chemotherapy | cisplatin | CR |
| POF1B | SNV | Missense_Mutation | rs769700681 | c.797N>A | p.Arg266His | p.R266H | Q8WVV4 | protein_coding | deleterious(0.05) | probably_damaging(0.997) | TCGA-2W-A8YY-01 | Cervix | cervical & endocervical cancer | Female | <65 | I/II | Chemotherapy | cisplatin | CR |
| POF1B | SNV | Missense_Mutation | novel | c.368N>T | p.Ser123Phe | p.S123F | Q8WVV4 | protein_coding | tolerated_low_confidence(0.08) | probably_damaging(0.994) | TCGA-2W-A8YY-01 | Cervix | cervical & endocervical cancer | Female | <65 | I/II | Chemotherapy | cisplatin | CR |
| POF1B | SNV | Missense_Mutation | novel | c.922G>A | p.Glu308Lys | p.E308K | Q8WVV4 | protein_coding | deleterious(0) | benign(0.269) | TCGA-EX-A1H6-01 | Cervix | cervical & endocervical cancer | Female | <65 | I/II | Unknown | Unknown | SD |
| Page: 1 2 3 4 5 6 7 8 9 10 |
Top |
Related drugs of malignant transformation related genes |
| Identification of chemicals and drugs interact with genes involved in malignant transfromation |
| (DGIdb 4.0) |
| Entrez ID | Symbol | Category | Interaction Types | Drug Claim Name | Drug Name | PMIDs |
| Page: 1 |

Copyright 2023-Present -The University of Texas Health Science Center at Houston |