
|
|||||
|
 | |
| |
| |
| |
| |
| |
|
Gene: PODXL |
Gene summary for PODXL |
| Gene information | Species | Human | Gene symbol | PODXL | Gene ID | 5420 |
| Gene name | podocalyxin like | |
| Gene Alias | Gp200 | |
| Cytomap | 7q32.3 | |
| Gene Type | protein-coding | GO ID | GO:0001655 | UniProtAcc | O00592 |
Top |
Malignant transformation analysis |
| Identification of the aberrant gene expression in precancerous and cancerous lesions by comparing the gene expression of stem-like cells in diseased tissues with normal stem cells |
| Entrez ID | Symbol | Replicates | Species | Organ | Tissue | Adj P-value | Log2FC | Malignancy |
| 5420 | PODXL | P2T-E | Human | Esophagus | ESCC | 1.04e-08 | 1.11e-01 | 0.1177 |
| 5420 | PODXL | P8T-E | Human | Esophagus | ESCC | 2.05e-15 | 3.83e-01 | 0.0889 |
| 5420 | PODXL | P12T-E | Human | Esophagus | ESCC | 2.22e-09 | 2.07e-01 | 0.1122 |
| 5420 | PODXL | P19T-E | Human | Esophagus | ESCC | 2.54e-02 | 3.78e-01 | 0.1662 |
| 5420 | PODXL | P24T-E | Human | Esophagus | ESCC | 1.53e-03 | 1.57e-01 | 0.1287 |
| 5420 | PODXL | P28T-E | Human | Esophagus | ESCC | 9.47e-04 | 9.11e-02 | 0.1149 |
| 5420 | PODXL | P31T-E | Human | Esophagus | ESCC | 6.21e-05 | 1.18e-01 | 0.1251 |
| 5420 | PODXL | P36T-E | Human | Esophagus | ESCC | 1.68e-04 | 5.10e-01 | 0.1187 |
| 5420 | PODXL | P52T-E | Human | Esophagus | ESCC | 1.24e-09 | 2.68e-01 | 0.1555 |
| 5420 | PODXL | P57T-E | Human | Esophagus | ESCC | 2.43e-08 | 1.83e-01 | 0.0926 |
| 5420 | PODXL | P74T-E | Human | Esophagus | ESCC | 4.17e-06 | 2.10e-01 | 0.1479 |
| 5420 | PODXL | P75T-E | Human | Esophagus | ESCC | 3.25e-21 | 4.18e-01 | 0.1125 |
| 5420 | PODXL | P82T-E | Human | Esophagus | ESCC | 2.03e-05 | 6.21e-01 | 0.1072 |
| 5420 | PODXL | P128T-E | Human | Esophagus | ESCC | 1.40e-06 | 3.74e-01 | 0.1241 |
| 5420 | PODXL | P130T-E | Human | Esophagus | ESCC | 8.33e-11 | 2.64e-01 | 0.1676 |
| 5420 | PODXL | HCC2_Meng | Human | Liver | HCC | 7.63e-05 | 5.18e-02 | 0.0107 |
| 5420 | PODXL | HCC2 | Human | Liver | HCC | 9.38e-05 | 1.79e+00 | 0.5341 |
| 5420 | PODXL | S015 | Human | Liver | HCC | 3.26e-11 | 5.69e-01 | 0.2375 |
| 5420 | PODXL | S016 | Human | Liver | HCC | 4.05e-05 | 2.99e-01 | 0.2243 |
| 5420 | PODXL | S027 | Human | Liver | HCC | 2.37e-06 | 4.28e-01 | 0.2446 |
| Page: 1 2 |
| Tissue | Expression Dynamics | Abbreviation |
| Esophagus |  | ESCC: Esophageal squamous cell carcinoma |
| HGIN: High-grade intraepithelial neoplasias | ||
| LGIN: Low-grade intraepithelial neoplasias | ||
| Liver |  | HCC: Hepatocellular carcinoma |
| NAFLD: Non-alcoholic fatty liver disease | ||
| Thyroid | 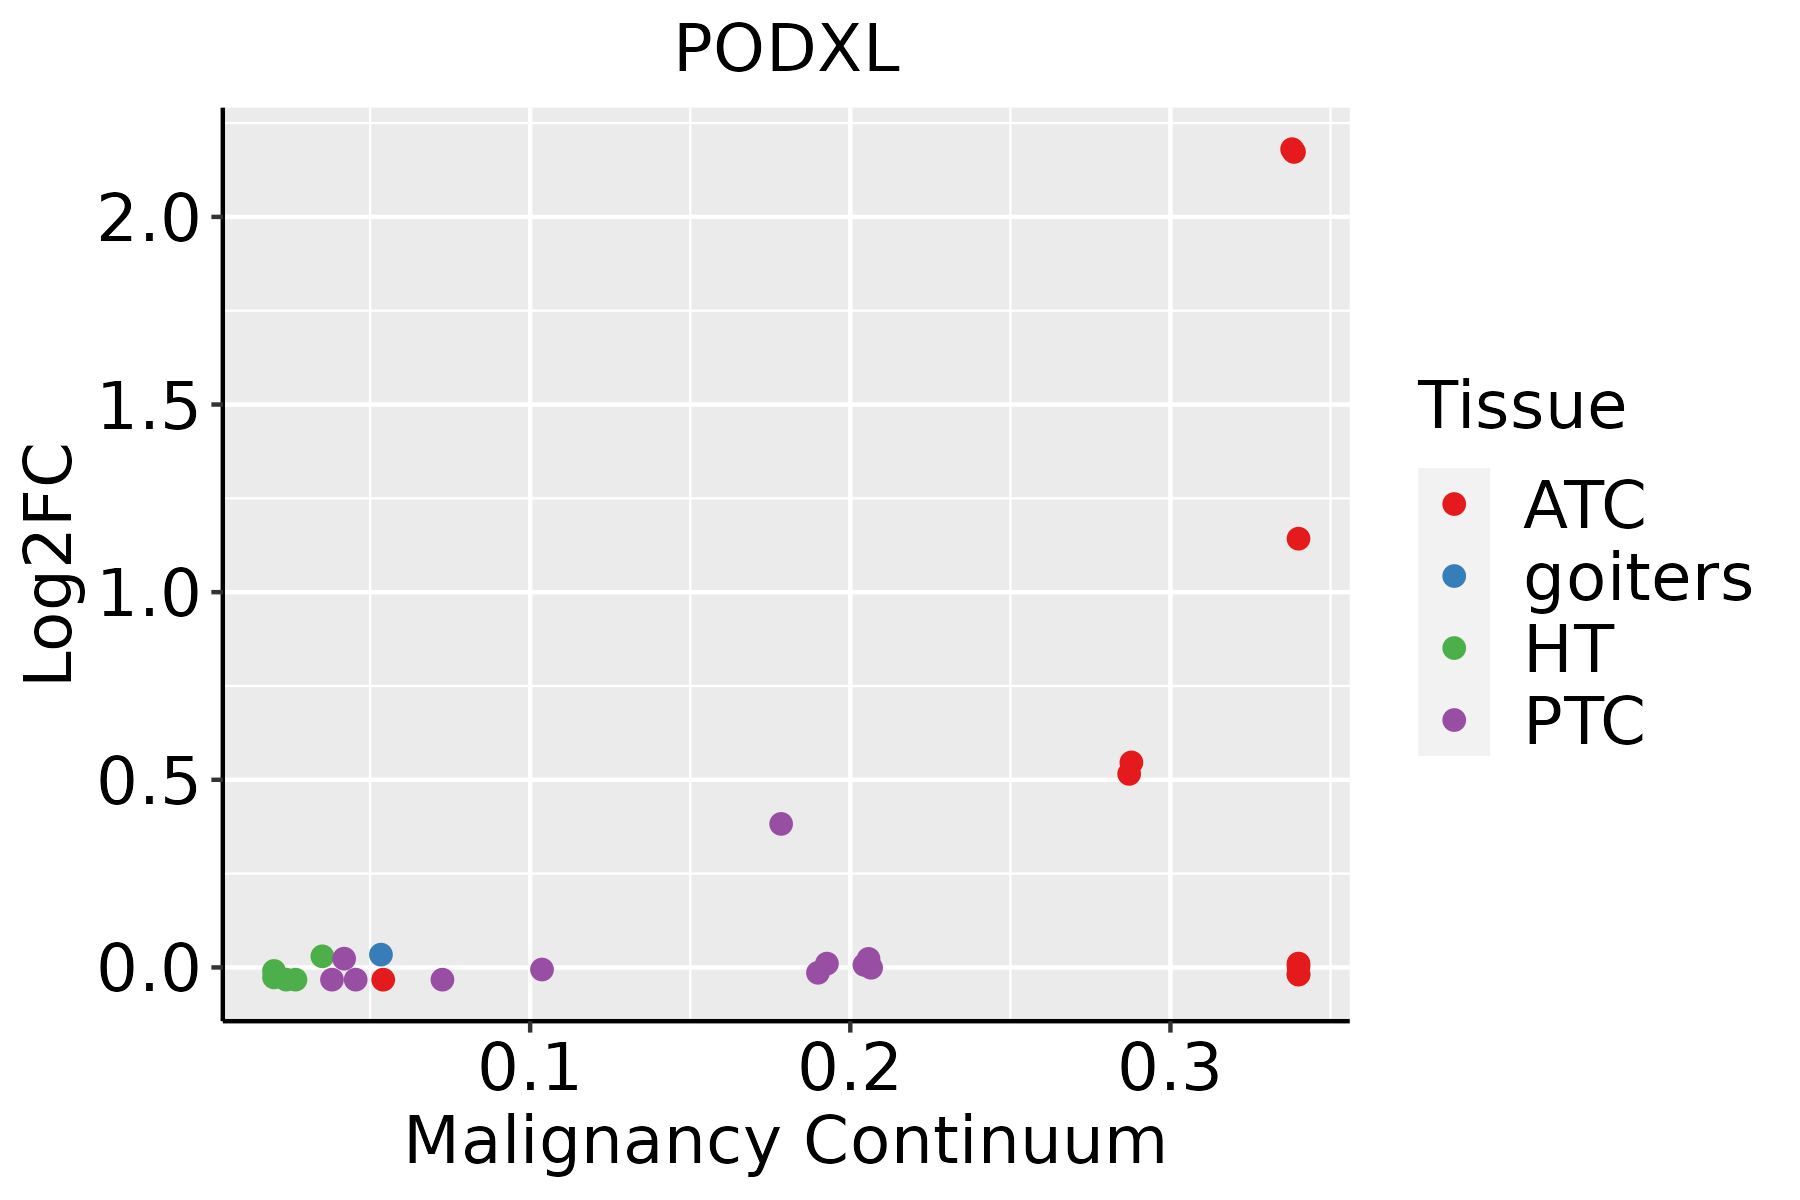 | ATC: Anaplastic thyroid cancer |
| HT: Hashimoto's thyroiditis | ||
| PTC: Papillary thyroid cancer |
| ∗log2FC in expression of this searched gene in stem-like cells from each diseased tissue sample relative to stem-like cells in normal samples in each tissue plotted against the malignancy continuum. Samples are colored based on if they are from different disease stage. |
Top |
Malignant transformation related pathway analysis |
| Find out the enriched GO biological processes and KEGG pathways involved in transition from healthy to precancer to cancer |
| Tissue | Disease Stage | Enriched GO biological Processes |
| Colorectum | AD |  |
| Colorectum | SER |  |
| Colorectum | MSS |  |
| Colorectum | MSI-H |  |
| Colorectum | FAP |  |
| ∗Top 15 enriched GO BP terms are showed in the bar plot of each disease state in each tissue. Each row represents a significant GO biological process which is colored according to the -log10(p.adjust). |
| Page: 1 2 3 4 5 6 7 8 9 |
| GO ID | Tissue | Disease Stage | Description | Gene Ratio | Bg Ratio | pvalue | p.adjust | Count |
| GO:004578527 | Esophagus | ESCC | positive regulation of cell adhesion | 255/8552 | 437/18723 | 5.07e-08 | 9.11e-07 | 255 |
| GO:000206420 | Esophagus | ESCC | epithelial cell development | 136/8552 | 220/18723 | 9.50e-07 | 1.21e-05 | 136 |
| GO:003514815 | Esophagus | ESCC | tube formation | 96/8552 | 148/18723 | 1.86e-06 | 2.16e-05 | 96 |
| GO:00721759 | Esophagus | ESCC | epithelial tube formation | 86/8552 | 132/18723 | 4.81e-06 | 5.10e-05 | 86 |
| GO:006056210 | Esophagus | ESCC | epithelial tube morphogenesis | 187/8552 | 325/18723 | 9.95e-06 | 9.44e-05 | 187 |
| GO:006049118 | Esophagus | ESCC | regulation of cell projection assembly | 110/8552 | 188/18723 | 2.60e-04 | 1.58e-03 | 110 |
| GO:012003218 | Esophagus | ESCC | regulation of plasma membrane bounded cell projection assembly | 108/8552 | 186/18723 | 4.37e-04 | 2.46e-03 | 108 |
| GO:002240720 | Esophagus | ESCC | regulation of cell-cell adhesion | 239/8552 | 448/18723 | 5.88e-04 | 3.19e-03 | 239 |
| GO:002240919 | Esophagus | ESCC | positive regulation of cell-cell adhesion | 155/8552 | 284/18723 | 1.50e-03 | 7.06e-03 | 155 |
| GO:00336275 | Esophagus | ESCC | cell adhesion mediated by integrin | 45/8552 | 72/18723 | 2.97e-03 | 1.24e-02 | 45 |
| GO:00300339 | Esophagus | ESCC | microvillus assembly | 13/8552 | 16/18723 | 4.05e-03 | 1.62e-02 | 13 |
| GO:00336281 | Esophagus | ESCC | regulation of cell adhesion mediated by integrin | 31/8552 | 48/18723 | 6.41e-03 | 2.35e-02 | 31 |
| GO:00016559 | Esophagus | ESCC | urogenital system development | 177/8552 | 338/18723 | 7.51e-03 | 2.69e-02 | 177 |
| GO:000715918 | Esophagus | ESCC | leukocyte cell-cell adhesion | 192/8552 | 371/18723 | 1.03e-02 | 3.51e-02 | 192 |
| GO:00325307 | Liver | HCC | regulation of microvillus organization | 12/7958 | 13/18723 | 2.73e-04 | 1.98e-03 | 12 |
| GO:006049112 | Liver | HCC | regulation of cell projection assembly | 101/7958 | 188/18723 | 1.20e-03 | 6.69e-03 | 101 |
| GO:012003212 | Liver | HCC | regulation of plasma membrane bounded cell projection assembly | 100/7958 | 186/18723 | 1.23e-03 | 6.81e-03 | 100 |
| GO:00325286 | Liver | HCC | microvillus organization | 18/7958 | 24/18723 | 1.27e-03 | 6.92e-03 | 18 |
| GO:00016553 | Liver | HCC | urogenital system development | 170/7958 | 338/18723 | 2.15e-03 | 1.08e-02 | 170 |
| GO:00723101 | Liver | HCC | glomerular epithelial cell development | 11/7958 | 13/18723 | 2.38e-03 | 1.16e-02 | 11 |
| Page: 1 2 3 |
| Pathway ID | Tissue | Disease Stage | Description | Gene Ratio | Bg Ratio | pvalue | p.adjust | qvalue | Count |
| hsa05132211 | Esophagus | ESCC | Salmonella infection | 191/4205 | 249/8465 | 6.51e-19 | 5.45e-17 | 2.79e-17 | 191 |
| hsa05132310 | Esophagus | ESCC | Salmonella infection | 191/4205 | 249/8465 | 6.51e-19 | 5.45e-17 | 2.79e-17 | 191 |
| hsa0513242 | Liver | HCC | Salmonella infection | 178/4020 | 249/8465 | 5.90e-15 | 1.98e-13 | 1.10e-13 | 178 |
| hsa0513252 | Liver | HCC | Salmonella infection | 178/4020 | 249/8465 | 5.90e-15 | 1.98e-13 | 1.10e-13 | 178 |
| Page: 1 |
Top |
Cell-cell communication analysis |
| Identification of potential cell-cell interactions between two cell types and their ligand-receptor pairs for different disease states |
| Ligand | Receptor | LRpair | Pathway | Tissue | Disease Stage |
| SELL | PODXL | SELL_PODXL | SELL | Breast | DCIS |
| SELL | PODXL | SELL_PODXL | SELL | Breast | Healthy |
| SELL | PODXL | SELL_PODXL | SELL | Breast | IDC |
| SELL | PODXL | SELL_PODXL | SELL | Cervix | ADJ |
| SELL | PODXL | SELL_PODXL | SELL | Cervix | CC |
| SELL | PODXL | SELL_PODXL | SELL | Cervix | Healthy |
| SELL | PODXL | SELL_PODXL | SELL | Cervix | Precancer |
| SELL | PODXL | SELL_PODXL | SELL | CRC | MSI-H |
| SELL | PODXL | SELL_PODXL | SELL | Endometrium | ADJ |
| SELL | PODXL | SELL_PODXL | SELL | Endometrium | AEH |
| SELL | PODXL | SELL_PODXL | SELL | Endometrium | EEC |
| SELL | PODXL | SELL_PODXL | SELL | Endometrium | Healthy |
| SELL | PODXL | SELL_PODXL | SELL | Esophagus | ESCC |
| SELL | PODXL | SELL_PODXL | SELL | GC | ADJ |
| SELL | PODXL | SELL_PODXL | SELL | GC | GC |
| SELL | PODXL | SELL_PODXL | SELL | HNSCC | ADJ |
| SELL | PODXL | SELL_PODXL | SELL | HNSCC | Healthy |
| SELL | PODXL | SELL_PODXL | SELL | HNSCC | OSCC |
| SELL | PODXL | SELL_PODXL | SELL | HNSCC | Precancer |
| SELL | PODXL | SELL_PODXL | SELL | Liver | HCC |
| Page: 1 |
Top |
Single-cell gene regulatory network inference analysis |
| Find out the significant the regulons (TFs) and the target genes of each regulon across cell types for different disease states |
| TF | Cell Type | Tissue | Disease Stage | Target Gene | RSS | Regulon Activity |
| ∗The dot plots of a searched regulon are shown for all cell subpopulations in each disease state of each tissue based on the regulon specific score inferred using pySCENIC and by calculating the average expression. |
| Page: 1 |
Top |
Somatic mutation of malignant transformation related genes |
| Annotation of somatic variants for genes involved in malignant transformation |
| Hugo Symbol | Variant Class | Variant Classification | dbSNP RS | HGVSc | HGVSp | HGVSp Short | SWISSPROT | BIOTYPE | SIFT | PolyPhen | Tumor Sample Barcode | Tissue | Histology | Sex | Age | Stage | Therapy Types | Drugs | Outcome |
| PODXL | SNV | Missense_Mutation | rs749475917 | c.947N>G | p.Ser316Cys | p.S316C | O00592 | protein_coding | deleterious(0) | possibly_damaging(0.839) | TCGA-D8-A73U-01 | Breast | breast invasive carcinoma | Female | >=65 | I/II | Hormone Therapy | tamoxiphen | SD |
| PODXL | SNV | Missense_Mutation | rs199529657 | c.1280G>A | p.Arg427Gln | p.R427Q | O00592 | protein_coding | tolerated(0.43) | benign(0.014) | TCGA-XX-A899-01 | Breast | breast invasive carcinoma | Female | <65 | III/IV | Chemotherapy | cytoxan | CR |
| PODXL | insertion | Nonsense_Mutation | novel | c.910_911insTGATTCCCTGAGACCCAGTATGAAAGAGCAGTGGCTGCAGGAGAGGC | p.Ala304ValfsTer4 | p.A304Vfs*4 | O00592 | protein_coding | TCGA-A2-A0EX-01 | Breast | breast invasive carcinoma | Female | <65 | I/II | Hormone Therapy | tamoxiphen | SD | ||
| PODXL | SNV | Missense_Mutation | novel | c.23N>T | p.Ser8Leu | p.S8L | O00592 | protein_coding | deleterious_low_confidence(0) | possibly_damaging(0.716) | TCGA-VS-A953-01 | Cervix | cervical & endocervical cancer | Female | <65 | I/II | Unknown | Unknown | PD |
| PODXL | SNV | Missense_Mutation | c.1360G>A | p.Ala454Thr | p.A454T | O00592 | protein_coding | tolerated(1) | benign(0.031) | TCGA-AA-3492-01 | Colorectum | colon adenocarcinoma | Female | >=65 | I/II | Unknown | Unknown | SD | |
| PODXL | SNV | Missense_Mutation | c.481N>G | p.Lys161Glu | p.K161E | O00592 | protein_coding | tolerated(0.31) | benign(0.017) | TCGA-AA-3672-01 | Colorectum | colon adenocarcinoma | Female | >=65 | III/IV | Unknown | Unknown | SD | |
| PODXL | SNV | Missense_Mutation | c.158N>C | p.Val53Ala | p.V53A | O00592 | protein_coding | tolerated_low_confidence(0.14) | benign(0.015) | TCGA-AA-3811-01 | Colorectum | colon adenocarcinoma | Female | >=65 | III/IV | Unknown | Unknown | PD | |
| PODXL | SNV | Missense_Mutation | rs371046754 | c.1430C>T | p.Ala477Val | p.A477V | O00592 | protein_coding | deleterious(0) | probably_damaging(1) | TCGA-AA-3977-01 | Colorectum | colon adenocarcinoma | Male | >=65 | I/II | Unknown | Unknown | SD |
| PODXL | SNV | Missense_Mutation | rs760418646 | c.1370N>A | p.Arg457His | p.R457H | O00592 | protein_coding | deleterious(0.02) | possibly_damaging(0.659) | TCGA-AD-6895-01 | Colorectum | colon adenocarcinoma | Male | >=65 | III/IV | Unknown | Unknown | SD |
| PODXL | SNV | Missense_Mutation | rs869312172 | c.977N>A | p.Arg326Gln | p.R326Q | O00592 | protein_coding | tolerated(0.81) | benign(0) | TCGA-AZ-4315-01 | Colorectum | colon adenocarcinoma | Male | <65 | I/II | Unknown | Unknown | SD |
| Page: 1 2 3 4 5 6 |
Top |
Related drugs of malignant transformation related genes |
| Identification of chemicals and drugs interact with genes involved in malignant transfromation |
| (DGIdb 4.0) |
| Entrez ID | Symbol | Category | Interaction Types | Drug Claim Name | Drug Name | PMIDs |
| Page: 1 |

Copyright 2023-Present -The University of Texas Health Science Center at Houston |