
|
|||||
|
 | |
| |
| |
| |
| |
| |
|
Gene: POC1A |
Gene summary for POC1A |
| Gene information | Species | Human | Gene symbol | POC1A | Gene ID | 25886 |
| Gene name | POC1 centriolar protein A | |
| Gene Alias | PIX2 | |
| Cytomap | 3p21.2 | |
| Gene Type | protein-coding | GO ID | GO:0008150 | UniProtAcc | Q8NBT0 |
Top |
Malignant transformation analysis |
| Identification of the aberrant gene expression in precancerous and cancerous lesions by comparing the gene expression of stem-like cells in diseased tissues with normal stem cells |
| Entrez ID | Symbol | Replicates | Species | Organ | Tissue | Adj P-value | Log2FC | Malignancy |
| 25886 | POC1A | HCC1_Meng | Human | Liver | HCC | 1.40e-12 | 6.59e-02 | 0.0246 |
| 25886 | POC1A | HCC2 | Human | Liver | HCC | 1.32e-03 | 1.93e+00 | 0.5341 |
| 25886 | POC1A | S014 | Human | Liver | HCC | 3.28e-08 | 3.22e-01 | 0.2254 |
| 25886 | POC1A | S015 | Human | Liver | HCC | 2.71e-07 | 3.22e-01 | 0.2375 |
| 25886 | POC1A | S016 | Human | Liver | HCC | 4.70e-07 | 2.14e-01 | 0.2243 |
| 25886 | POC1A | S027 | Human | Liver | HCC | 2.57e-02 | 1.82e-01 | 0.2446 |
| 25886 | POC1A | S028 | Human | Liver | HCC | 7.94e-11 | 5.12e-01 | 0.2503 |
| 25886 | POC1A | S029 | Human | Liver | HCC | 3.09e-09 | 5.03e-01 | 0.2581 |
| 25886 | POC1A | ATC2 | Human | Thyroid | ATC | 3.71e-05 | 6.60e-01 | 0.34 |
| 25886 | POC1A | ATC4 | Human | Thyroid | ATC | 3.17e-02 | 1.09e-01 | 0.34 |
| 25886 | POC1A | ATC5 | Human | Thyroid | ATC | 4.82e-02 | 1.24e-01 | 0.34 |
| Page: 1 |
| Tissue | Expression Dynamics | Abbreviation |
| Liver |  | HCC: Hepatocellular carcinoma |
| NAFLD: Non-alcoholic fatty liver disease | ||
| Thyroid | 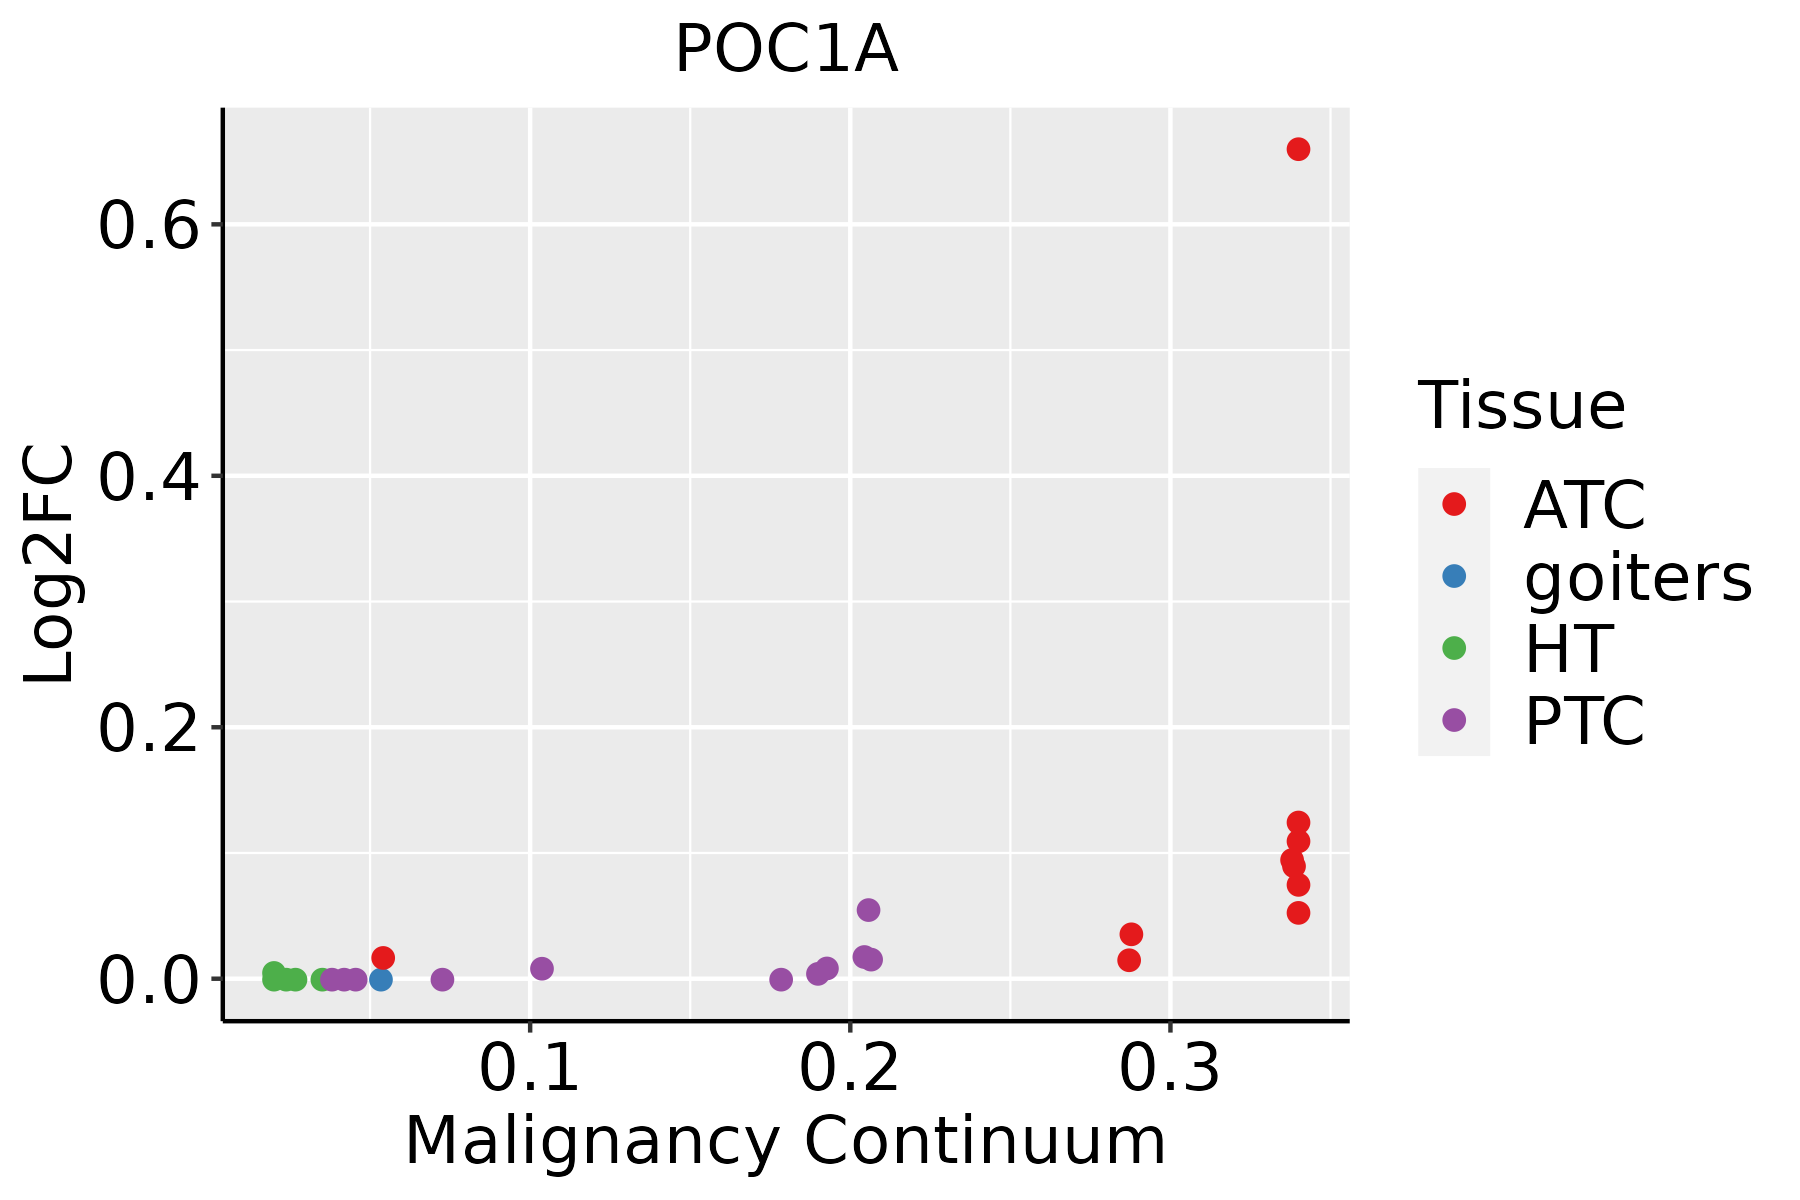 | ATC: Anaplastic thyroid cancer |
| HT: Hashimoto's thyroiditis | ||
| PTC: Papillary thyroid cancer |
| ∗log2FC in expression of this searched gene in stem-like cells from each diseased tissue sample relative to stem-like cells in normal samples in each tissue plotted against the malignancy continuum. Samples are colored based on if they are from different disease stage. |
Top |
Malignant transformation related pathway analysis |
| Find out the enriched GO biological processes and KEGG pathways involved in transition from healthy to precancer to cancer |
| Tissue | Disease Stage | Enriched GO biological Processes |
| Colorectum | AD |  |
| Colorectum | SER |  |
| Colorectum | MSS |  |
| Colorectum | MSI-H |  |
| Colorectum | FAP |  |
| ∗Top 15 enriched GO BP terms are showed in the bar plot of each disease state in each tissue. Each row represents a significant GO biological process which is colored according to the -log10(p.adjust). |
| Page: 1 2 3 4 5 6 7 8 9 |
| GO ID | Tissue | Disease Stage | Description | Gene Ratio | Bg Ratio | pvalue | p.adjust | Count |
| Page: 1 |
| Pathway ID | Tissue | Disease Stage | Description | Gene Ratio | Bg Ratio | pvalue | p.adjust | qvalue | Count |
| Page: 1 |
Top |
Cell-cell communication analysis |
| Identification of potential cell-cell interactions between two cell types and their ligand-receptor pairs for different disease states |
| Ligand | Receptor | LRpair | Pathway | Tissue | Disease Stage |
| Page: 1 |
Top |
Single-cell gene regulatory network inference analysis |
| Find out the significant the regulons (TFs) and the target genes of each regulon across cell types for different disease states |
| TF | Cell Type | Tissue | Disease Stage | Target Gene | RSS | Regulon Activity |
| ∗The dot plots of a searched regulon are shown for all cell subpopulations in each disease state of each tissue based on the regulon specific score inferred using pySCENIC and by calculating the average expression. |
| Page: 1 |
Top |
Somatic mutation of malignant transformation related genes |
| Annotation of somatic variants for genes involved in malignant transformation |
| Hugo Symbol | Variant Class | Variant Classification | dbSNP RS | HGVSc | HGVSp | HGVSp Short | SWISSPROT | BIOTYPE | SIFT | PolyPhen | Tumor Sample Barcode | Tissue | Histology | Sex | Age | Stage | Therapy Types | Drugs | Outcome |
| POC1A | SNV | Missense_Mutation | novel | c.1178A>C | p.Gln393Pro | p.Q393P | Q8NBT0 | protein_coding | deleterious(0) | benign(0.184) | TCGA-D8-A1X5-01 | Breast | breast invasive carcinoma | Female | >=65 | III/IV | Hormone Therapy | tamoxiphen | SD |
| POC1A | SNV | Missense_Mutation | novel | c.481G>A | p.Val161Met | p.V161M | Q8NBT0 | protein_coding | deleterious(0) | probably_damaging(0.99) | TCGA-2W-A8YY-01 | Cervix | cervical & endocervical cancer | Female | <65 | I/II | Chemotherapy | cisplatin | CR |
| POC1A | SNV | Missense_Mutation | c.850N>A | p.Glu284Lys | p.E284K | Q8NBT0 | protein_coding | deleterious(0.03) | benign(0.124) | TCGA-C5-A1BQ-01 | Cervix | cervical & endocervical cancer | Female | >=65 | III/IV | Chemotherapy | cisplatin | CR | |
| POC1A | SNV | Missense_Mutation | novel | c.1214N>A | p.Ala405Glu | p.A405E | Q8NBT0 | protein_coding | tolerated(0.44) | benign(0.015) | TCGA-C5-A905-01 | Cervix | cervical & endocervical cancer | Female | <65 | I/II | Unknown | Unknown | SD |
| POC1A | SNV | Missense_Mutation | novel | c.565N>G | p.Phe189Val | p.F189V | Q8NBT0 | protein_coding | tolerated(0.07) | benign(0.389) | TCGA-AA-3947-01 | Colorectum | colon adenocarcinoma | Female | <65 | I/II | Unknown | Unknown | SD |
| POC1A | SNV | Missense_Mutation | rs539829904 | c.980T>G | p.Leu327Arg | p.L327R | Q8NBT0 | protein_coding | tolerated(0.25) | benign(0.037) | TCGA-AA-A010-01 | Colorectum | colon adenocarcinoma | Female | <65 | I/II | Chemotherapy | folinic | CR |
| POC1A | SNV | Missense_Mutation | c.526N>T | p.Ser176Cys | p.S176C | Q8NBT0 | protein_coding | deleterious(0) | probably_damaging(0.935) | TCGA-AZ-6598-01 | Colorectum | colon adenocarcinoma | Female | >=65 | I/II | Unknown | Unknown | SD | |
| POC1A | SNV | Missense_Mutation | c.190N>A | p.Val64Ile | p.V64I | Q8NBT0 | protein_coding | tolerated(0.26) | benign(0.081) | TCGA-G4-6304-01 | Colorectum | colon adenocarcinoma | Female | >=65 | I/II | Chemotherapy | fluorouracil | PD | |
| POC1A | SNV | Missense_Mutation | c.50N>A | p.Gly17Asp | p.G17D | Q8NBT0 | protein_coding | deleterious(0.05) | probably_damaging(1) | TCGA-G4-6588-01 | Colorectum | colon adenocarcinoma | Female | <65 | I/II | Unknown | Unknown | SD | |
| POC1A | deletion | Frame_Shift_Del | rs770990008 | c.850delN | p.Glu284SerfsTer12 | p.E284Sfs*12 | Q8NBT0 | protein_coding | TCGA-AA-3864-01 | Colorectum | colon adenocarcinoma | Male | >=65 | I/II | Unknown | Unknown | SD |
| Page: 1 2 3 |
Top |
Related drugs of malignant transformation related genes |
| Identification of chemicals and drugs interact with genes involved in malignant transfromation |
| (DGIdb 4.0) |
| Entrez ID | Symbol | Category | Interaction Types | Drug Claim Name | Drug Name | PMIDs |
| Page: 1 |

Copyright 2023-Present -The University of Texas Health Science Center at Houston |