
|
|||||
|
 | |
| |
| |
| |
| |
| |
|
Gene: PNPT1 |
Gene summary for PNPT1 |
| Gene information | Species | Human | Gene symbol | PNPT1 | Gene ID | 87178 |
| Gene name | polyribonucleotide nucleotidyltransferase 1 | |
| Gene Alias | COXPD13 | |
| Cytomap | 2p16.1 | |
| Gene Type | protein-coding | GO ID | GO:0000957 | UniProtAcc | Q8TCS8 |
Top |
Malignant transformation analysis |
| Identification of the aberrant gene expression in precancerous and cancerous lesions by comparing the gene expression of stem-like cells in diseased tissues with normal stem cells |
| Entrez ID | Symbol | Replicates | Species | Organ | Tissue | Adj P-value | Log2FC | Malignancy |
| 87178 | PNPT1 | LZE2T | Human | Esophagus | ESCC | 1.87e-03 | 4.84e-01 | 0.082 |
| 87178 | PNPT1 | LZE4T | Human | Esophagus | ESCC | 2.90e-05 | 2.30e-01 | 0.0811 |
| 87178 | PNPT1 | LZE7T | Human | Esophagus | ESCC | 5.70e-06 | 5.14e-01 | 0.0667 |
| 87178 | PNPT1 | LZE8T | Human | Esophagus | ESCC | 1.15e-04 | 1.23e-01 | 0.067 |
| 87178 | PNPT1 | LZE22T | Human | Esophagus | ESCC | 3.27e-02 | 3.88e-01 | 0.068 |
| 87178 | PNPT1 | LZE24T | Human | Esophagus | ESCC | 6.83e-18 | 4.34e-01 | 0.0596 |
| 87178 | PNPT1 | LZE21T | Human | Esophagus | ESCC | 3.13e-04 | 2.66e-01 | 0.0655 |
| 87178 | PNPT1 | P1T-E | Human | Esophagus | ESCC | 1.94e-09 | 4.78e-01 | 0.0875 |
| 87178 | PNPT1 | P2T-E | Human | Esophagus | ESCC | 3.45e-43 | 8.73e-01 | 0.1177 |
| 87178 | PNPT1 | P4T-E | Human | Esophagus | ESCC | 3.59e-21 | 5.12e-01 | 0.1323 |
| 87178 | PNPT1 | P5T-E | Human | Esophagus | ESCC | 3.99e-15 | 3.81e-01 | 0.1327 |
| 87178 | PNPT1 | P8T-E | Human | Esophagus | ESCC | 1.63e-12 | 2.35e-01 | 0.0889 |
| 87178 | PNPT1 | P9T-E | Human | Esophagus | ESCC | 6.25e-11 | 3.35e-01 | 0.1131 |
| 87178 | PNPT1 | P10T-E | Human | Esophagus | ESCC | 1.77e-24 | 3.94e-01 | 0.116 |
| 87178 | PNPT1 | P11T-E | Human | Esophagus | ESCC | 1.35e-11 | 6.28e-01 | 0.1426 |
| 87178 | PNPT1 | P12T-E | Human | Esophagus | ESCC | 1.01e-27 | 5.62e-01 | 0.1122 |
| 87178 | PNPT1 | P15T-E | Human | Esophagus | ESCC | 1.55e-26 | 5.84e-01 | 0.1149 |
| 87178 | PNPT1 | P16T-E | Human | Esophagus | ESCC | 2.22e-33 | 5.51e-01 | 0.1153 |
| 87178 | PNPT1 | P17T-E | Human | Esophagus | ESCC | 2.17e-05 | 3.65e-01 | 0.1278 |
| 87178 | PNPT1 | P19T-E | Human | Esophagus | ESCC | 1.74e-04 | 4.94e-01 | 0.1662 |
| Page: 1 2 3 4 5 6 |
| Tissue | Expression Dynamics | Abbreviation |
| Esophagus | 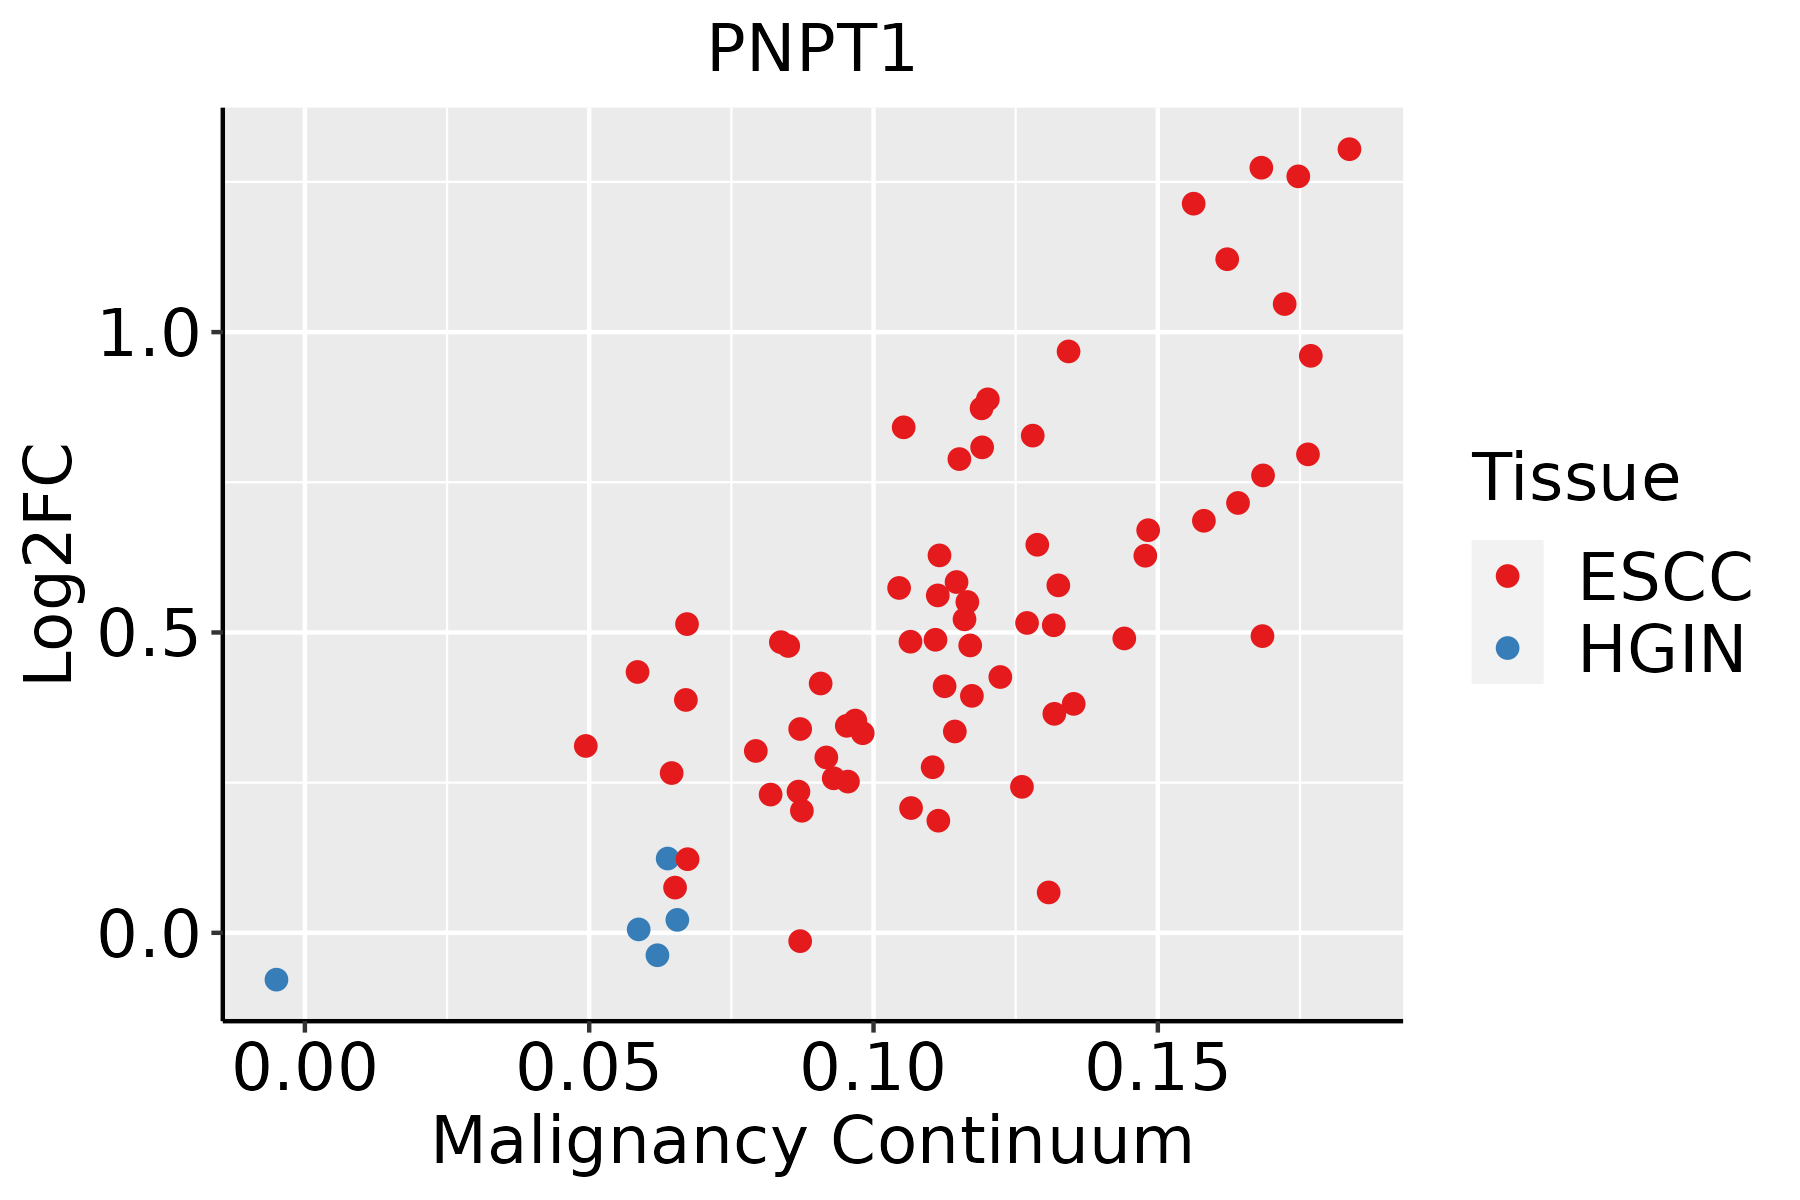 | ESCC: Esophageal squamous cell carcinoma |
| HGIN: High-grade intraepithelial neoplasias | ||
| LGIN: Low-grade intraepithelial neoplasias | ||
| Liver |  | HCC: Hepatocellular carcinoma |
| NAFLD: Non-alcoholic fatty liver disease | ||
| Oral Cavity |  | EOLP: Erosive Oral lichen planus |
| LP: leukoplakia | ||
| NEOLP: Non-erosive oral lichen planus | ||
| OSCC: Oral squamous cell carcinoma | ||
| Skin | 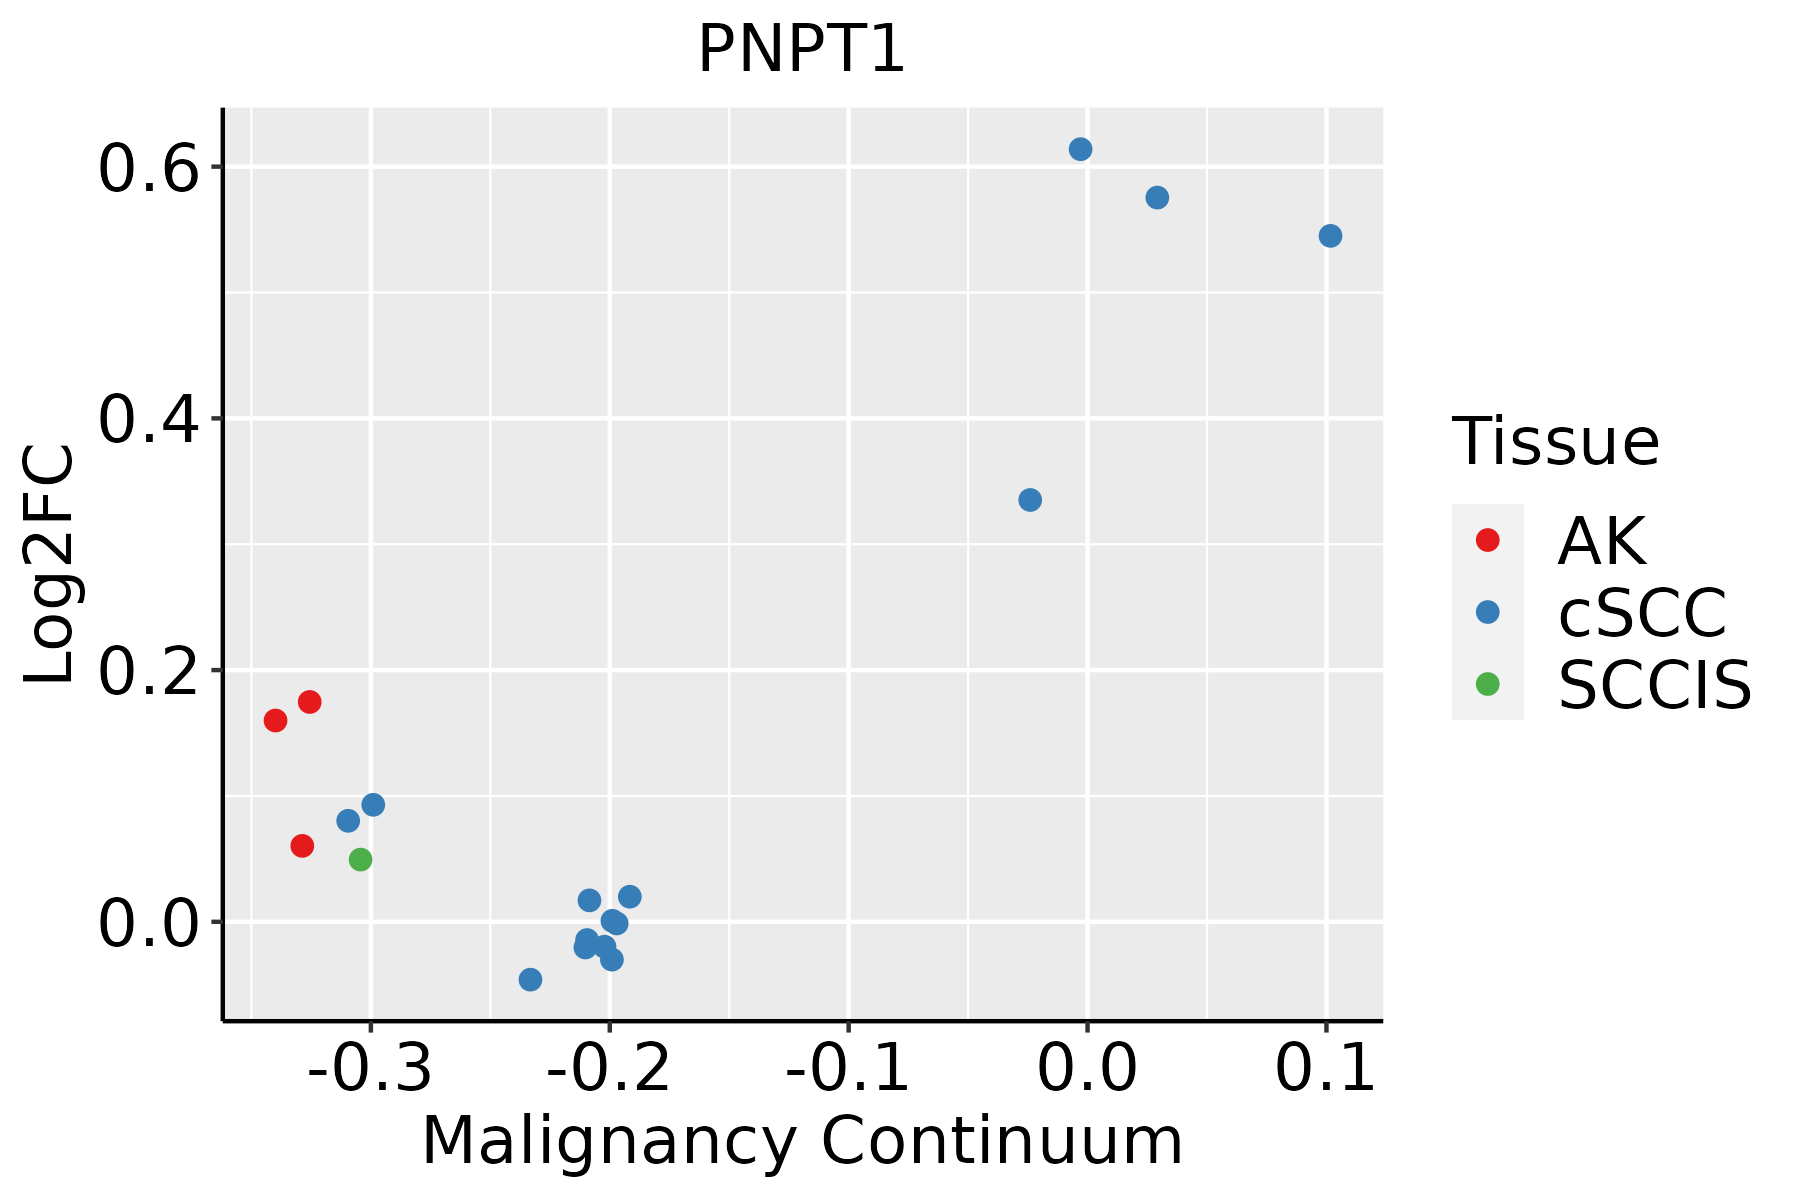 | AK: Actinic keratosis |
| cSCC: Cutaneous squamous cell carcinoma | ||
| SCCIS:squamous cell carcinoma in situ | ||
| Thyroid | 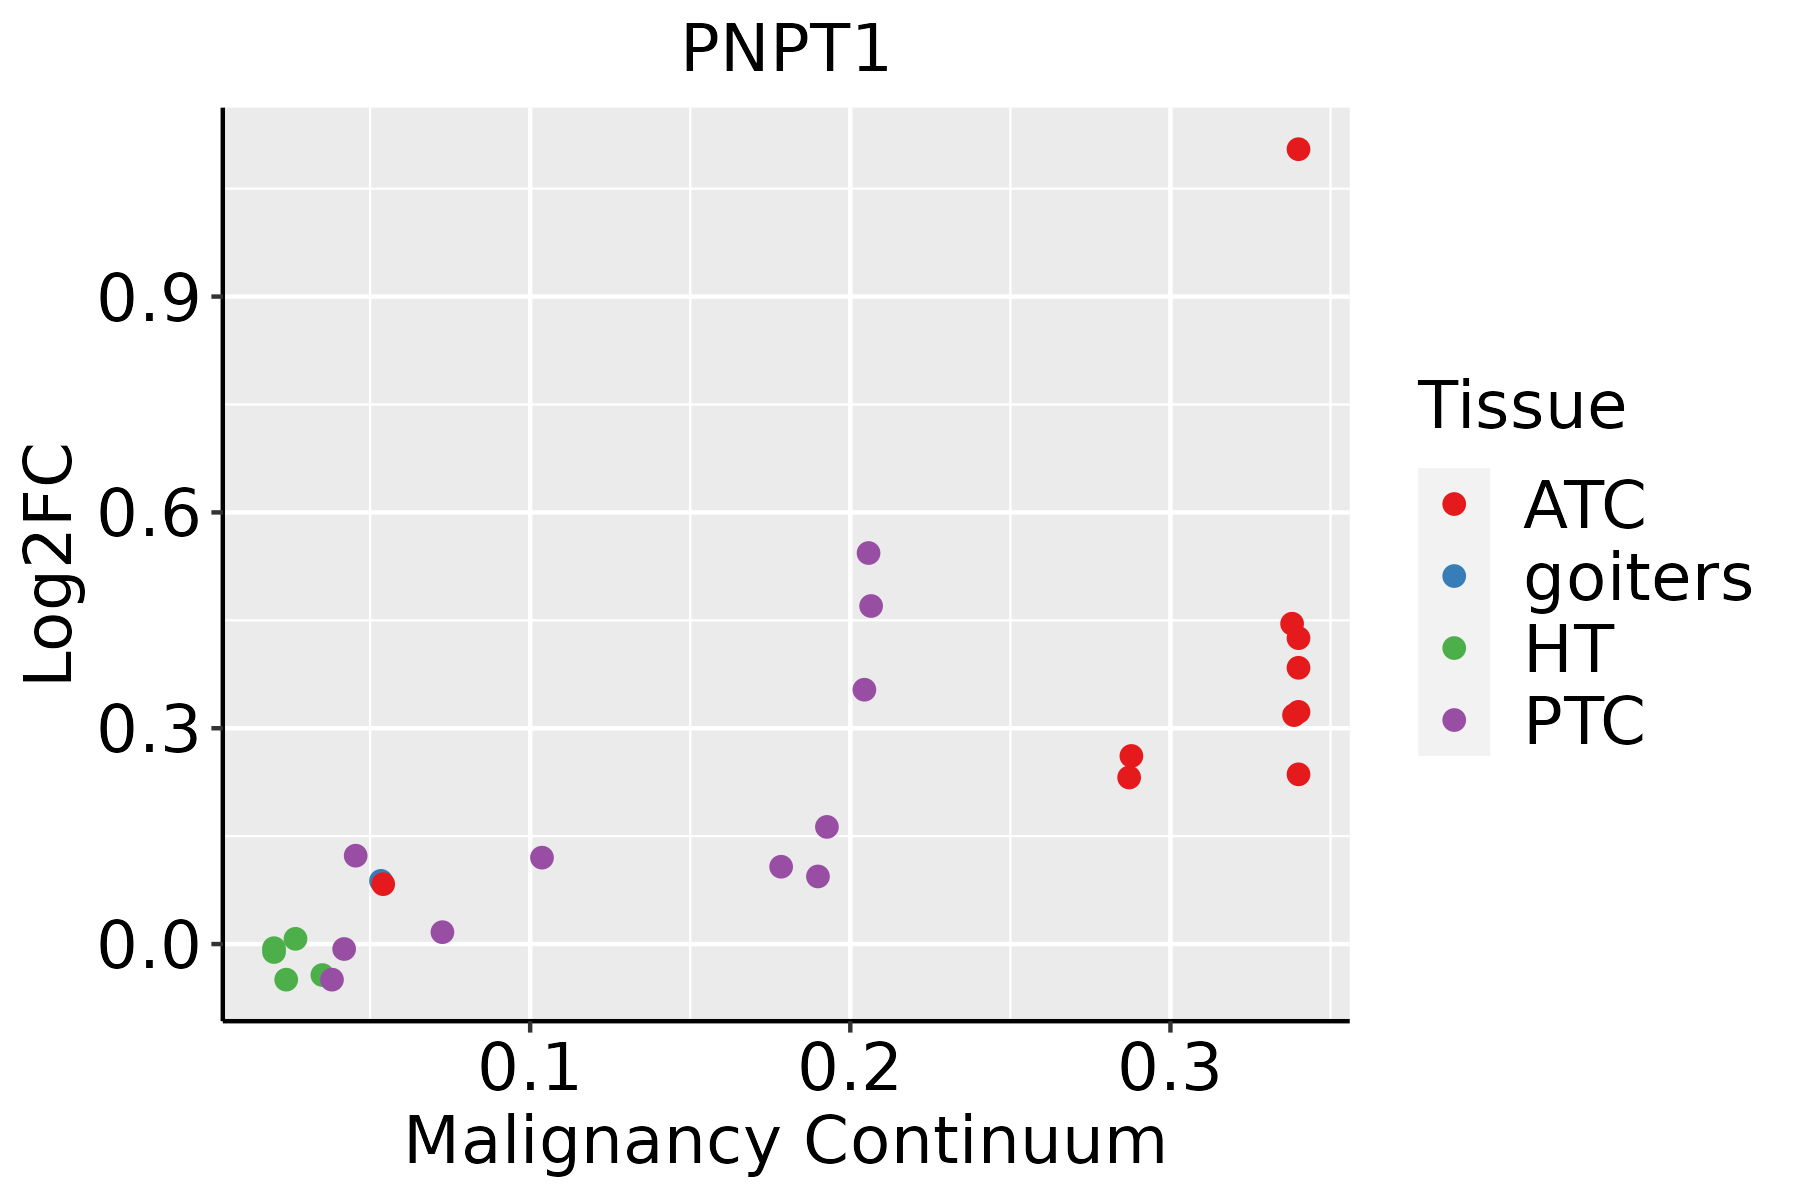 | ATC: Anaplastic thyroid cancer |
| HT: Hashimoto's thyroiditis | ||
| PTC: Papillary thyroid cancer |
| ∗log2FC in expression of this searched gene in stem-like cells from each diseased tissue sample relative to stem-like cells in normal samples in each tissue plotted against the malignancy continuum. Samples are colored based on if they are from different disease stage. |
Top |
Malignant transformation related pathway analysis |
| Find out the enriched GO biological processes and KEGG pathways involved in transition from healthy to precancer to cancer |
| Tissue | Disease Stage | Enriched GO biological Processes |
| Colorectum | AD |  |
| Colorectum | SER |  |
| Colorectum | MSS |  |
| Colorectum | MSI-H |  |
| Colorectum | FAP |  |
| ∗Top 15 enriched GO BP terms are showed in the bar plot of each disease state in each tissue. Each row represents a significant GO biological process which is colored according to the -log10(p.adjust). |
| Page: 1 2 3 4 5 6 7 8 9 |
| GO ID | Tissue | Disease Stage | Description | Gene Ratio | Bg Ratio | pvalue | p.adjust | Count |
| GO:003466012 | Esophagus | ESCC | ncRNA metabolic process | 346/8552 | 485/18723 | 4.35e-31 | 2.51e-28 | 346 |
| GO:0006403110 | Esophagus | ESCC | RNA localization | 166/8552 | 201/18723 | 1.95e-27 | 6.18e-25 | 166 |
| GO:0006091110 | Esophagus | ESCC | generation of precursor metabolites and energy | 331/8552 | 490/18723 | 3.86e-23 | 8.45e-21 | 331 |
| GO:0009896111 | Esophagus | ESCC | positive regulation of catabolic process | 332/8552 | 492/18723 | 4.36e-23 | 9.22e-21 | 332 |
| GO:0006979111 | Esophagus | ESCC | response to oxidative stress | 303/8552 | 446/18723 | 7.15e-22 | 1.30e-19 | 303 |
| GO:0031331111 | Esophagus | ESCC | positive regulation of cellular catabolic process | 292/8552 | 427/18723 | 8.67e-22 | 1.53e-19 | 292 |
| GO:1903311110 | Esophagus | ESCC | regulation of mRNA metabolic process | 210/8552 | 288/18723 | 3.25e-21 | 5.56e-19 | 210 |
| GO:0006401110 | Esophagus | ESCC | RNA catabolic process | 204/8552 | 278/18723 | 3.39e-21 | 5.66e-19 | 204 |
| GO:005123617 | Esophagus | ESCC | establishment of RNA localization | 134/8552 | 166/18723 | 1.23e-20 | 1.81e-18 | 134 |
| GO:0045333110 | Esophagus | ESCC | cellular respiration | 173/8552 | 230/18723 | 4.53e-20 | 5.99e-18 | 173 |
| GO:005065717 | Esophagus | ESCC | nucleic acid transport | 131/8552 | 163/18723 | 6.94e-20 | 8.46e-18 | 131 |
| GO:005065817 | Esophagus | ESCC | RNA transport | 131/8552 | 163/18723 | 6.94e-20 | 8.46e-18 | 131 |
| GO:0006839110 | Esophagus | ESCC | mitochondrial transport | 187/8552 | 254/18723 | 8.35e-20 | 9.81e-18 | 187 |
| GO:0062197111 | Esophagus | ESCC | cellular response to chemical stress | 234/8552 | 337/18723 | 5.37e-19 | 5.97e-17 | 234 |
| GO:014005313 | Esophagus | ESCC | mitochondrial gene expression | 93/8552 | 108/18723 | 1.96e-18 | 2.03e-16 | 93 |
| GO:0034655110 | Esophagus | ESCC | nucleobase-containing compound catabolic process | 272/8552 | 407/18723 | 2.92e-18 | 2.90e-16 | 272 |
| GO:0006402110 | Esophagus | ESCC | mRNA catabolic process | 170/8552 | 232/18723 | 8.70e-18 | 8.00e-16 | 170 |
| GO:0015980110 | Esophagus | ESCC | energy derivation by oxidation of organic compounds | 220/8552 | 318/18723 | 1.20e-17 | 1.09e-15 | 220 |
| GO:0006417111 | Esophagus | ESCC | regulation of translation | 304/8552 | 468/18723 | 1.53e-17 | 1.33e-15 | 304 |
| GO:001593117 | Esophagus | ESCC | nucleobase-containing compound transport | 162/8552 | 222/18723 | 9.87e-17 | 7.93e-15 | 162 |
| Page: 1 2 3 4 5 6 7 8 9 10 11 12 13 14 15 16 17 18 19 20 21 22 |
| Pathway ID | Tissue | Disease Stage | Description | Gene Ratio | Bg Ratio | pvalue | p.adjust | qvalue | Count |
| hsa0301824 | Esophagus | ESCC | RNA degradation | 62/4205 | 79/8465 | 1.18e-07 | 9.39e-07 | 4.81e-07 | 62 |
| hsa0301834 | Esophagus | ESCC | RNA degradation | 62/4205 | 79/8465 | 1.18e-07 | 9.39e-07 | 4.81e-07 | 62 |
| hsa030182 | Liver | HCC | RNA degradation | 58/4020 | 79/8465 | 2.29e-06 | 2.19e-05 | 1.22e-05 | 58 |
| hsa030183 | Liver | HCC | RNA degradation | 58/4020 | 79/8465 | 2.29e-06 | 2.19e-05 | 1.22e-05 | 58 |
| hsa030189 | Oral cavity | OSCC | RNA degradation | 59/3704 | 79/8465 | 2.05e-08 | 1.91e-07 | 9.70e-08 | 59 |
| hsa0301814 | Oral cavity | OSCC | RNA degradation | 59/3704 | 79/8465 | 2.05e-08 | 1.91e-07 | 9.70e-08 | 59 |
| hsa0301823 | Oral cavity | LP | RNA degradation | 39/2418 | 79/8465 | 6.98e-05 | 4.38e-04 | 2.83e-04 | 39 |
| hsa0301833 | Oral cavity | LP | RNA degradation | 39/2418 | 79/8465 | 6.98e-05 | 4.38e-04 | 2.83e-04 | 39 |
| Page: 1 |
Top |
Cell-cell communication analysis |
| Identification of potential cell-cell interactions between two cell types and their ligand-receptor pairs for different disease states |
| Ligand | Receptor | LRpair | Pathway | Tissue | Disease Stage |
| Page: 1 |
Top |
Single-cell gene regulatory network inference analysis |
| Find out the significant the regulons (TFs) and the target genes of each regulon across cell types for different disease states |
| TF | Cell Type | Tissue | Disease Stage | Target Gene | RSS | Regulon Activity |
| ∗The dot plots of a searched regulon are shown for all cell subpopulations in each disease state of each tissue based on the regulon specific score inferred using pySCENIC and by calculating the average expression. |
| Page: 1 |
Top |
Somatic mutation of malignant transformation related genes |
| Annotation of somatic variants for genes involved in malignant transformation |
| Hugo Symbol | Variant Class | Variant Classification | dbSNP RS | HGVSc | HGVSp | HGVSp Short | SWISSPROT | BIOTYPE | SIFT | PolyPhen | Tumor Sample Barcode | Tissue | Histology | Sex | Age | Stage | Therapy Types | Drugs | Outcome |
| PNPT1 | SNV | Missense_Mutation | rs765249456 | c.2144G>A | p.Arg715Gln | p.R715Q | Q8TCS8 | protein_coding | deleterious(0.04) | possibly_damaging(0.783) | TCGA-A8-A08J-01 | Breast | breast invasive carcinoma | Female | <65 | III/IV | Unknown | Unknown | PD |
| PNPT1 | SNV | Missense_Mutation | c.675N>C | p.Gln225His | p.Q225H | Q8TCS8 | protein_coding | tolerated(0.14) | benign(0.02) | TCGA-AC-A23H-01 | Breast | breast invasive carcinoma | Female | >=65 | I/II | Unknown | Unknown | PD | |
| PNPT1 | SNV | Missense_Mutation | novel | c.16N>G | p.Tyr6Asp | p.Y6D | Q8TCS8 | protein_coding | tolerated_low_confidence(0.2) | benign(0.003) | TCGA-AR-A24H-01 | Breast | breast invasive carcinoma | Female | >=65 | I/II | Hormone Therapy | tamoxiphen | SD |
| PNPT1 | SNV | Missense_Mutation | rs757766273 | c.1148N>T | p.Ser383Leu | p.S383L | Q8TCS8 | protein_coding | deleterious(0) | probably_damaging(0.974) | TCGA-AR-A24S-01 | Breast | breast invasive carcinoma | Female | <65 | I/II | Hormone Therapy | anastrozole | SD |
| PNPT1 | SNV | Missense_Mutation | c.235N>A | p.Ala79Thr | p.A79T | Q8TCS8 | protein_coding | tolerated(0.14) | benign(0.249) | TCGA-BH-A0HF-01 | Breast | breast invasive carcinoma | Female | >=65 | I/II | Hormone Therapy | arimidex | SD | |
| PNPT1 | SNV | Missense_Mutation | c.1945N>A | p.Val649Ile | p.V649I | Q8TCS8 | protein_coding | tolerated(0.64) | benign(0.005) | TCGA-BH-A203-01 | Breast | breast invasive carcinoma | Female | >=65 | I/II | Unknown | Unknown | PD | |
| PNPT1 | SNV | Missense_Mutation | rs143022417 | c.839C>T | p.Ser280Leu | p.S280L | Q8TCS8 | protein_coding | tolerated(0.31) | benign(0.005) | TCGA-D8-A27G-01 | Breast | breast invasive carcinoma | Female | >=65 | I/II | Unknown | Unknown | SD |
| PNPT1 | SNV | Missense_Mutation | novel | c.596A>G | p.Glu199Gly | p.E199G | Q8TCS8 | protein_coding | deleterious(0.05) | benign(0.119) | TCGA-2W-A8YY-01 | Cervix | cervical & endocervical cancer | Female | <65 | I/II | Chemotherapy | cisplatin | CR |
| PNPT1 | SNV | Missense_Mutation | novel | c.2036N>C | p.Gly679Ala | p.G679A | Q8TCS8 | protein_coding | deleterious(0.01) | probably_damaging(1) | TCGA-C5-A2LX-01 | Cervix | cervical & endocervical cancer | Female | <65 | I/II | Chemotherapy | cisplatin | SD |
| PNPT1 | SNV | Missense_Mutation | novel | c.1535G>C | p.Gly512Ala | p.G512A | Q8TCS8 | protein_coding | deleterious(0) | probably_damaging(0.995) | TCGA-VS-A9UH-01 | Cervix | cervical & endocervical cancer | Female | <65 | I/II | Chemotherapy | cisplatin | CR |
| Page: 1 2 3 4 5 6 7 |
Top |
Related drugs of malignant transformation related genes |
| Identification of chemicals and drugs interact with genes involved in malignant transfromation |
| (DGIdb 4.0) |
| Entrez ID | Symbol | Category | Interaction Types | Drug Claim Name | Drug Name | PMIDs |
| Page: 1 |

Copyright 2023-Present -The University of Texas Health Science Center at Houston |