
|
|||||
|
 | |
| |
| |
| |
| |
| |
|
Gene: PNPO |
Gene summary for PNPO |
| Gene information | Species | Human | Gene symbol | PNPO | Gene ID | 55163 |
| Gene name | pyridoxamine 5'-phosphate oxidase | |
| Gene Alias | HEL-S-302 | |
| Cytomap | 17q21.32 | |
| Gene Type | protein-coding | GO ID | GO:0006081 | UniProtAcc | Q9NVS9 |
Top |
Malignant transformation analysis |
| Identification of the aberrant gene expression in precancerous and cancerous lesions by comparing the gene expression of stem-like cells in diseased tissues with normal stem cells |
| Entrez ID | Symbol | Replicates | Species | Organ | Tissue | Adj P-value | Log2FC | Malignancy |
| 55163 | PNPO | LZE4T | Human | Esophagus | ESCC | 5.59e-04 | 1.50e-01 | 0.0811 |
| 55163 | PNPO | LZE24T | Human | Esophagus | ESCC | 3.57e-08 | 2.92e-01 | 0.0596 |
| 55163 | PNPO | P2T-E | Human | Esophagus | ESCC | 2.96e-05 | 1.00e-01 | 0.1177 |
| 55163 | PNPO | P4T-E | Human | Esophagus | ESCC | 7.73e-06 | 1.71e-01 | 0.1323 |
| 55163 | PNPO | P5T-E | Human | Esophagus | ESCC | 2.91e-10 | 1.91e-01 | 0.1327 |
| 55163 | PNPO | P8T-E | Human | Esophagus | ESCC | 3.89e-06 | 1.43e-01 | 0.0889 |
| 55163 | PNPO | P10T-E | Human | Esophagus | ESCC | 5.47e-03 | 8.82e-02 | 0.116 |
| 55163 | PNPO | P11T-E | Human | Esophagus | ESCC | 2.40e-03 | 1.96e-01 | 0.1426 |
| 55163 | PNPO | P16T-E | Human | Esophagus | ESCC | 1.50e-11 | 2.01e-01 | 0.1153 |
| 55163 | PNPO | P17T-E | Human | Esophagus | ESCC | 7.35e-03 | 1.94e-01 | 0.1278 |
| 55163 | PNPO | P20T-E | Human | Esophagus | ESCC | 2.98e-03 | 1.47e-01 | 0.1124 |
| 55163 | PNPO | P21T-E | Human | Esophagus | ESCC | 2.31e-14 | 2.85e-01 | 0.1617 |
| 55163 | PNPO | P22T-E | Human | Esophagus | ESCC | 6.12e-11 | 2.41e-01 | 0.1236 |
| 55163 | PNPO | P23T-E | Human | Esophagus | ESCC | 9.63e-12 | 3.38e-01 | 0.108 |
| 55163 | PNPO | P24T-E | Human | Esophagus | ESCC | 1.20e-09 | 3.00e-01 | 0.1287 |
| 55163 | PNPO | P26T-E | Human | Esophagus | ESCC | 5.12e-09 | 2.21e-01 | 0.1276 |
| 55163 | PNPO | P27T-E | Human | Esophagus | ESCC | 6.74e-11 | 3.06e-01 | 0.1055 |
| 55163 | PNPO | P28T-E | Human | Esophagus | ESCC | 1.86e-05 | 1.20e-01 | 0.1149 |
| 55163 | PNPO | P30T-E | Human | Esophagus | ESCC | 2.52e-09 | 3.44e-01 | 0.137 |
| 55163 | PNPO | P31T-E | Human | Esophagus | ESCC | 1.75e-08 | 1.63e-01 | 0.1251 |
| Page: 1 2 3 |
| Tissue | Expression Dynamics | Abbreviation |
| Esophagus | 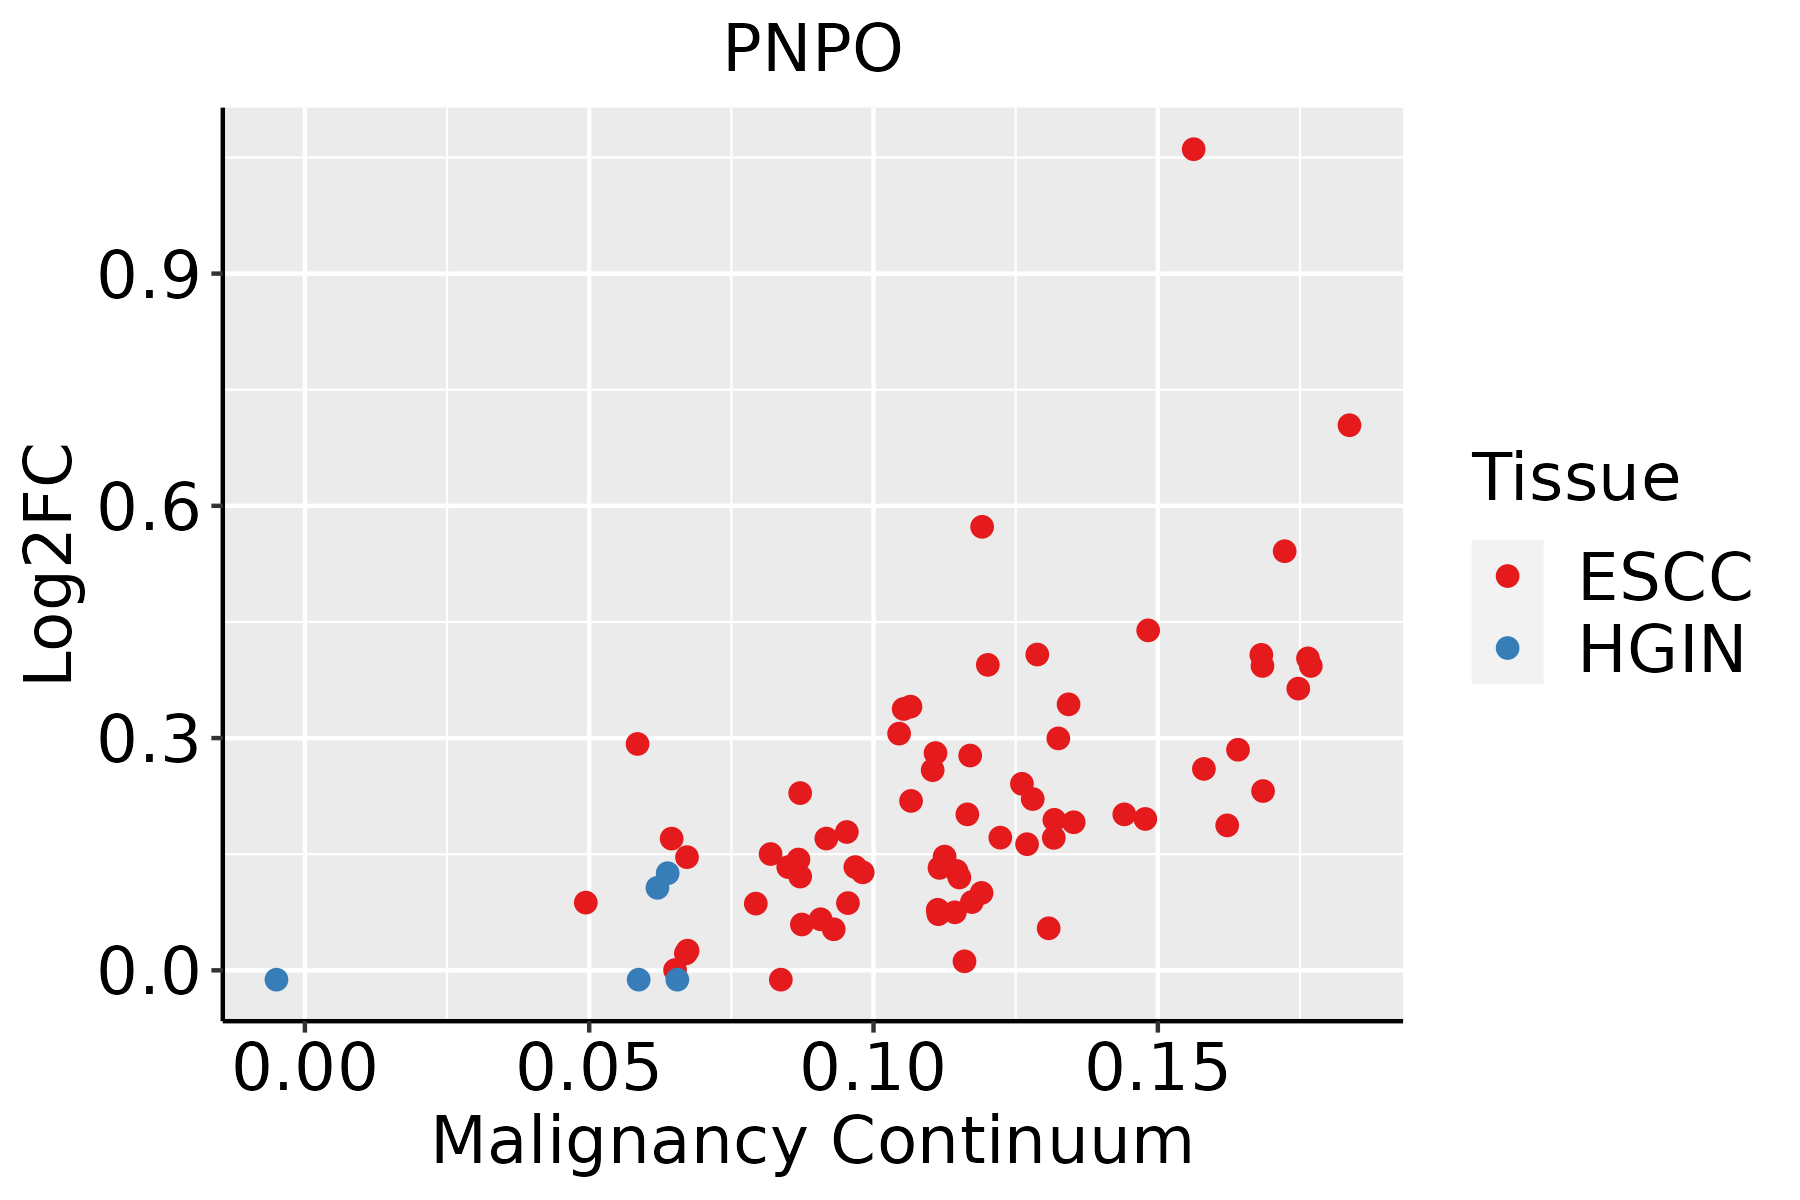 | ESCC: Esophageal squamous cell carcinoma |
| HGIN: High-grade intraepithelial neoplasias | ||
| LGIN: Low-grade intraepithelial neoplasias | ||
| Liver | 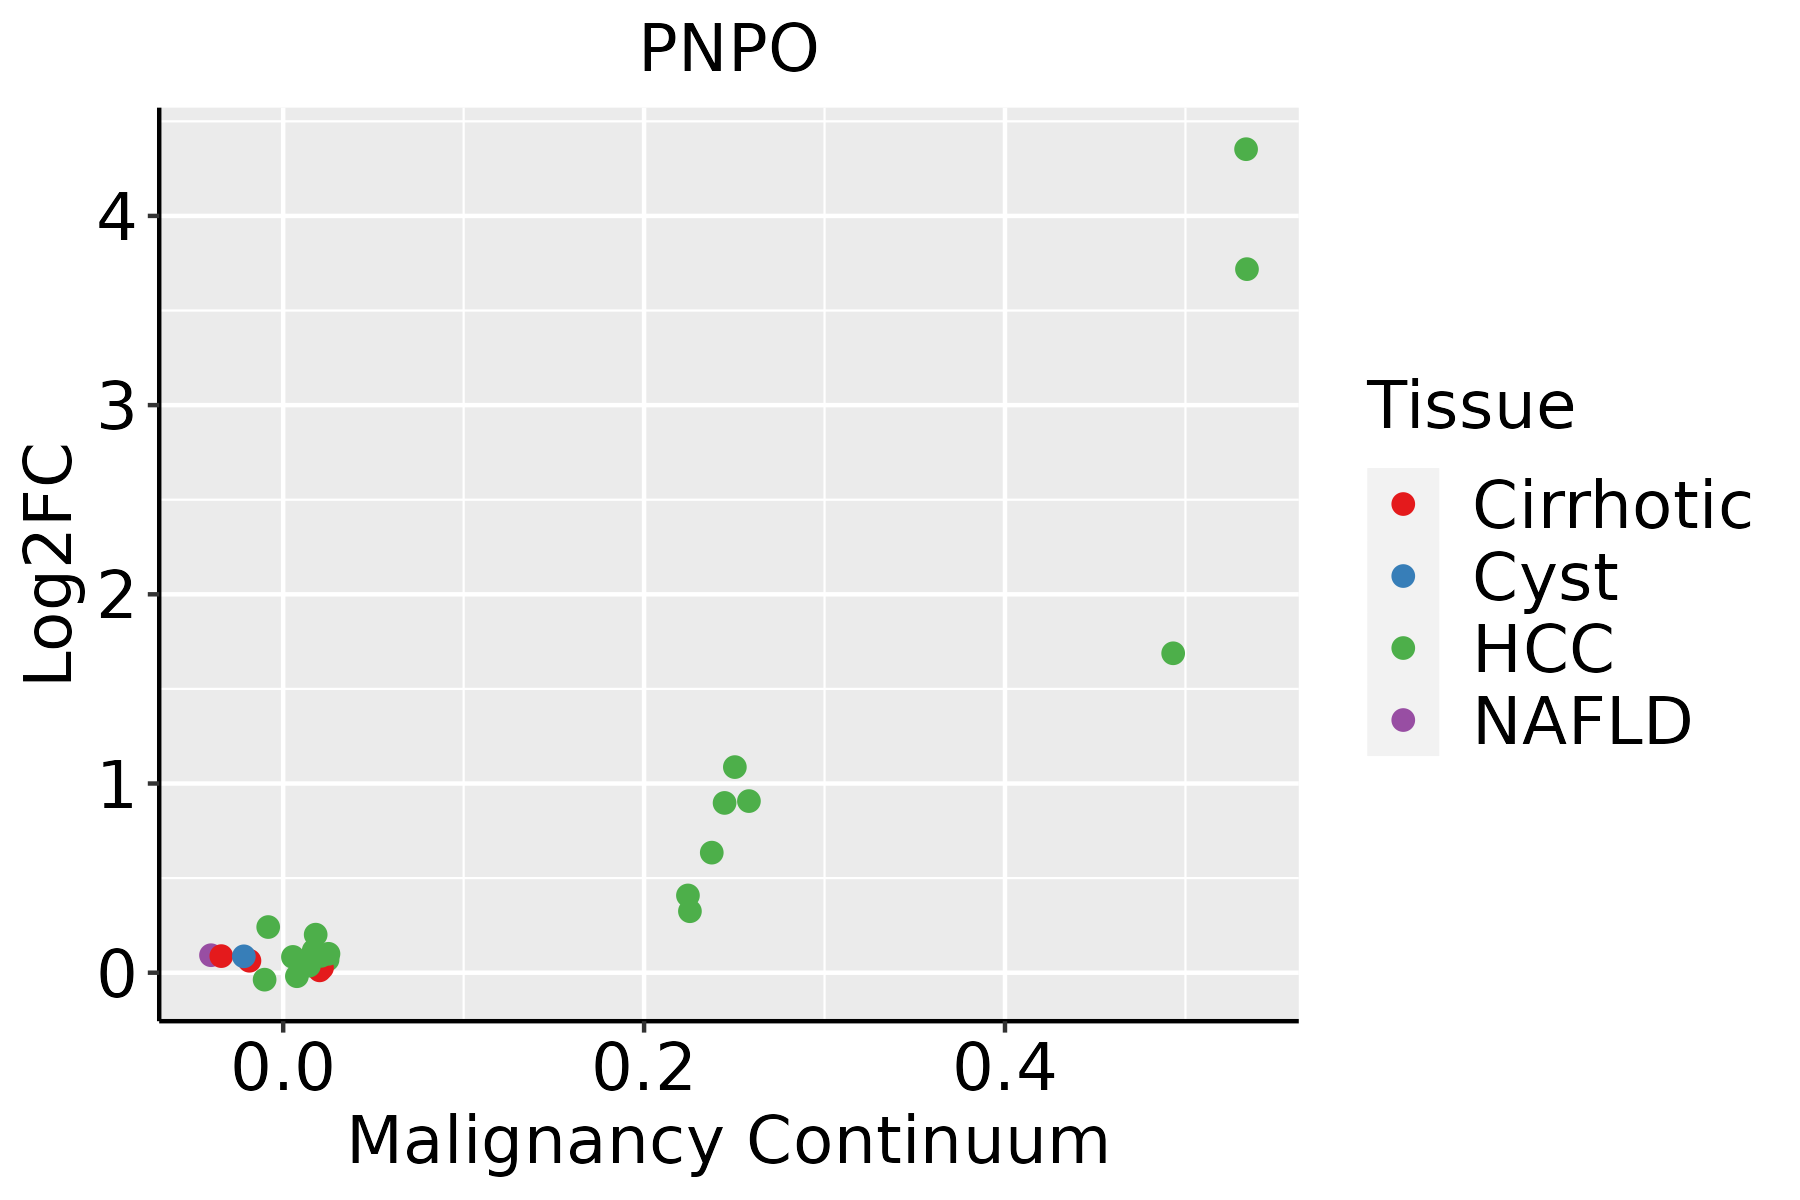 | HCC: Hepatocellular carcinoma |
| NAFLD: Non-alcoholic fatty liver disease |
| ∗log2FC in expression of this searched gene in stem-like cells from each diseased tissue sample relative to stem-like cells in normal samples in each tissue plotted against the malignancy continuum. Samples are colored based on if they are from different disease stage. |
Top |
Malignant transformation related pathway analysis |
| Find out the enriched GO biological processes and KEGG pathways involved in transition from healthy to precancer to cancer |
| Tissue | Disease Stage | Enriched GO biological Processes |
| Colorectum | AD |  |
| Colorectum | SER |  |
| Colorectum | MSS |  |
| Colorectum | MSI-H |  |
| Colorectum | FAP |  |
| ∗Top 15 enriched GO BP terms are showed in the bar plot of each disease state in each tissue. Each row represents a significant GO biological process which is colored according to the -log10(p.adjust). |
| Page: 1 2 3 4 5 6 7 8 9 |
| GO ID | Tissue | Disease Stage | Description | Gene Ratio | Bg Ratio | pvalue | p.adjust | Count |
| GO:00067671 | Esophagus | ESCC | water-soluble vitamin metabolic process | 41/8552 | 59/18723 | 1.84e-04 | 1.17e-03 | 41 |
| GO:00067661 | Esophagus | ESCC | vitamin metabolic process | 67/8552 | 106/18723 | 2.03e-04 | 1.28e-03 | 67 |
| GO:00060818 | Esophagus | ESCC | cellular aldehyde metabolic process | 40/8552 | 60/18723 | 8.30e-04 | 4.28e-03 | 40 |
| GO:19016174 | Esophagus | ESCC | organic hydroxy compound biosynthetic process | 128/8552 | 237/18723 | 5.86e-03 | 2.16e-02 | 128 |
| GO:0009110 | Esophagus | ESCC | vitamin biosynthetic process | 15/8552 | 20/18723 | 7.60e-03 | 2.71e-02 | 15 |
| GO:19016172 | Liver | HCC | organic hydroxy compound biosynthetic process | 129/7958 | 237/18723 | 1.32e-04 | 1.08e-03 | 129 |
| GO:0006767 | Liver | HCC | water-soluble vitamin metabolic process | 39/7958 | 59/18723 | 2.14e-04 | 1.63e-03 | 39 |
| GO:000608112 | Liver | HCC | cellular aldehyde metabolic process | 39/7958 | 60/18723 | 3.61e-04 | 2.50e-03 | 39 |
| GO:0072525 | Liver | HCC | pyridine-containing compound biosynthetic process | 22/7958 | 32/18723 | 2.43e-03 | 1.18e-02 | 22 |
| GO:0072524 | Liver | HCC | pyridine-containing compound metabolic process | 25/7958 | 38/18723 | 3.18e-03 | 1.47e-02 | 25 |
| GO:0006766 | Liver | HCC | vitamin metabolic process | 57/7958 | 106/18723 | 1.25e-02 | 4.53e-02 | 57 |
| Page: 1 |
| Pathway ID | Tissue | Disease Stage | Description | Gene Ratio | Bg Ratio | pvalue | p.adjust | qvalue | Count |
| hsa012405 | Esophagus | ESCC | Biosynthesis of cofactors | 97/4205 | 153/8465 | 3.88e-04 | 1.35e-03 | 6.94e-04 | 97 |
| hsa0124012 | Esophagus | ESCC | Biosynthesis of cofactors | 97/4205 | 153/8465 | 3.88e-04 | 1.35e-03 | 6.94e-04 | 97 |
| hsa012402 | Liver | HCC | Biosynthesis of cofactors | 103/4020 | 153/8465 | 4.67e-07 | 5.05e-06 | 2.81e-06 | 103 |
| hsa012403 | Liver | HCC | Biosynthesis of cofactors | 103/4020 | 153/8465 | 4.67e-07 | 5.05e-06 | 2.81e-06 | 103 |
| Page: 1 |
Top |
Cell-cell communication analysis |
| Identification of potential cell-cell interactions between two cell types and their ligand-receptor pairs for different disease states |
| Ligand | Receptor | LRpair | Pathway | Tissue | Disease Stage |
| Page: 1 |
Top |
Single-cell gene regulatory network inference analysis |
| Find out the significant the regulons (TFs) and the target genes of each regulon across cell types for different disease states |
| TF | Cell Type | Tissue | Disease Stage | Target Gene | RSS | Regulon Activity |
| ∗The dot plots of a searched regulon are shown for all cell subpopulations in each disease state of each tissue based on the regulon specific score inferred using pySCENIC and by calculating the average expression. |
| Page: 1 |
Top |
Somatic mutation of malignant transformation related genes |
| Annotation of somatic variants for genes involved in malignant transformation |
| Hugo Symbol | Variant Class | Variant Classification | dbSNP RS | HGVSc | HGVSp | HGVSp Short | SWISSPROT | BIOTYPE | SIFT | PolyPhen | Tumor Sample Barcode | Tissue | Histology | Sex | Age | Stage | Therapy Types | Drugs | Outcome |
| PNPO | SNV | Missense_Mutation | novel | c.17N>C | p.Arg6Pro | p.R6P | Q9NVS9 | protein_coding | deleterious_low_confidence(0.03) | benign(0.174) | TCGA-3C-AALI-01 | Breast | breast invasive carcinoma | Female | <65 | I/II | Unspecific | Poly E | Complete Response |
| PNPO | SNV | Missense_Mutation | c.288G>T | p.Met96Ile | p.M96I | Q9NVS9 | protein_coding | tolerated(0.08) | benign(0.048) | TCGA-A8-A08F-01 | Breast | breast invasive carcinoma | Female | <65 | III/IV | Chemotherapy | 5-fluorouracil | CR | |
| PNPO | SNV | Missense_Mutation | c.202N>A | p.Glu68Lys | p.E68K | Q9NVS9 | protein_coding | tolerated(0.09) | possibly_damaging(0.525) | TCGA-AC-A23H-01 | Breast | breast invasive carcinoma | Female | >=65 | I/II | Unknown | Unknown | PD | |
| PNPO | insertion | Frame_Shift_Ins | novel | c.586_587insTCTTCTACTGGGAGCCACTTAACCGTCAGGTG | p.Gln196LeufsTer31 | p.Q196Lfs*31 | Q9NVS9 | protein_coding | TCGA-A8-A07J-01 | Breast | breast invasive carcinoma | Female | <65 | I/II | Chemotherapy | 5-fluorouracil | CR | ||
| PNPO | SNV | Missense_Mutation | c.49G>A | p.Glu17Lys | p.E17K | Q9NVS9 | protein_coding | tolerated_low_confidence(0.95) | benign(0) | TCGA-EA-A3HQ-01 | Cervix | cervical & endocervical cancer | Female | <65 | I/II | Unknown | Unknown | SD | |
| PNPO | SNV | Missense_Mutation | novel | c.746G>A | p.Arg249His | p.R249H | Q9NVS9 | protein_coding | tolerated(0.24) | benign(0.001) | TCGA-5M-AAT6-01 | Colorectum | colon adenocarcinoma | Female | <65 | III/IV | Unknown | Unknown | PD |
| PNPO | SNV | Missense_Mutation | rs777671908 | c.745N>T | p.Arg249Cys | p.R249C | Q9NVS9 | protein_coding | tolerated(0.06) | benign(0.009) | TCGA-AA-3980-01 | Colorectum | colon adenocarcinoma | Female | >=65 | I/II | Unknown | Unknown | SD |
| PNPO | SNV | Missense_Mutation | c.623N>A | p.Gly208Asp | p.G208D | Q9NVS9 | protein_coding | deleterious(0) | probably_damaging(1) | TCGA-G4-6628-01 | Colorectum | colon adenocarcinoma | Male | >=65 | I/II | Unknown | Unknown | SD | |
| PNPO | deletion | Frame_Shift_Del | novel | c.526_527delNN | p.Ser176CysfsTer4 | p.S176Cfs*4 | Q9NVS9 | protein_coding | TCGA-WS-AB45-01 | Colorectum | colon adenocarcinoma | Female | <65 | I/II | Unknown | Unknown | SD | ||
| PNPO | SNV | Missense_Mutation | rs754757019 | c.580N>T | p.Leu194Phe | p.L194F | Q9NVS9 | protein_coding | deleterious(0.04) | benign(0.19) | TCGA-A5-A0G2-01 | Endometrium | uterine corpus endometrioid carcinoma | Female | <65 | III/IV | Unknown | Unknown | SD |
| Page: 1 2 |
Top |
Related drugs of malignant transformation related genes |
| Identification of chemicals and drugs interact with genes involved in malignant transfromation |
| (DGIdb 4.0) |
| Entrez ID | Symbol | Category | Interaction Types | Drug Claim Name | Drug Name | PMIDs |
| Page: 1 |

Copyright 2023-Present -The University of Texas Health Science Center at Houston |