
|
|||||
|
 | |
| |
| |
| |
| |
| |
|
Gene: PNPLA6 |
Gene summary for PNPLA6 |
| Gene information | Species | Human | Gene symbol | PNPLA6 | Gene ID | 10908 |
| Gene name | patatin like phospholipase domain containing 6 | |
| Gene Alias | BNHS | |
| Cytomap | 19p13.2 | |
| Gene Type | protein-coding | GO ID | GO:0006629 | UniProtAcc | Q8IY17 |
Top |
Malignant transformation analysis |
| Identification of the aberrant gene expression in precancerous and cancerous lesions by comparing the gene expression of stem-like cells in diseased tissues with normal stem cells |
| Entrez ID | Symbol | Replicates | Species | Organ | Tissue | Adj P-value | Log2FC | Malignancy |
| 10908 | PNPLA6 | C04 | Human | Oral cavity | OSCC | 4.61e-07 | 3.54e-01 | 0.2633 |
| 10908 | PNPLA6 | C21 | Human | Oral cavity | OSCC | 1.63e-22 | 5.45e-01 | 0.2678 |
| 10908 | PNPLA6 | C30 | Human | Oral cavity | OSCC | 7.64e-16 | 6.71e-01 | 0.3055 |
| 10908 | PNPLA6 | C38 | Human | Oral cavity | OSCC | 6.05e-10 | 6.37e-01 | 0.172 |
| 10908 | PNPLA6 | C43 | Human | Oral cavity | OSCC | 1.04e-08 | 2.27e-01 | 0.1704 |
| 10908 | PNPLA6 | C46 | Human | Oral cavity | OSCC | 3.25e-07 | 2.22e-01 | 0.1673 |
| 10908 | PNPLA6 | C51 | Human | Oral cavity | OSCC | 2.21e-07 | 4.30e-01 | 0.2674 |
| 10908 | PNPLA6 | C57 | Human | Oral cavity | OSCC | 3.98e-05 | 1.56e-01 | 0.1679 |
| 10908 | PNPLA6 | C08 | Human | Oral cavity | OSCC | 1.61e-06 | 1.46e-01 | 0.1919 |
| 10908 | PNPLA6 | C09 | Human | Oral cavity | OSCC | 2.40e-04 | 1.54e-01 | 0.1431 |
| 10908 | PNPLA6 | LN46 | Human | Oral cavity | OSCC | 3.79e-02 | 2.03e-01 | 0.1666 |
| 10908 | PNPLA6 | LP17 | Human | Oral cavity | LP | 7.78e-04 | 4.22e-01 | 0.2349 |
| 10908 | PNPLA6 | SYSMH1 | Human | Oral cavity | OSCC | 6.61e-07 | 1.63e-01 | 0.1127 |
| 10908 | PNPLA6 | SYSMH2 | Human | Oral cavity | OSCC | 4.43e-03 | 1.18e-01 | 0.2326 |
| 10908 | PNPLA6 | SYSMH3 | Human | Oral cavity | OSCC | 4.20e-20 | 4.76e-01 | 0.2442 |
| 10908 | PNPLA6 | SYSMH5 | Human | Oral cavity | OSCC | 2.45e-04 | 1.49e-01 | 0.0647 |
| 10908 | PNPLA6 | male-WTA | Human | Thyroid | PTC | 2.31e-12 | 1.55e-01 | 0.1037 |
| 10908 | PNPLA6 | PTC01 | Human | Thyroid | PTC | 5.85e-06 | 1.25e-01 | 0.1899 |
| 10908 | PNPLA6 | PTC04 | Human | Thyroid | PTC | 2.23e-08 | 1.24e-01 | 0.1927 |
| 10908 | PNPLA6 | PTC05 | Human | Thyroid | PTC | 4.28e-13 | 3.57e-01 | 0.2065 |
| Page: 1 2 |
| Tissue | Expression Dynamics | Abbreviation |
| Oral Cavity | 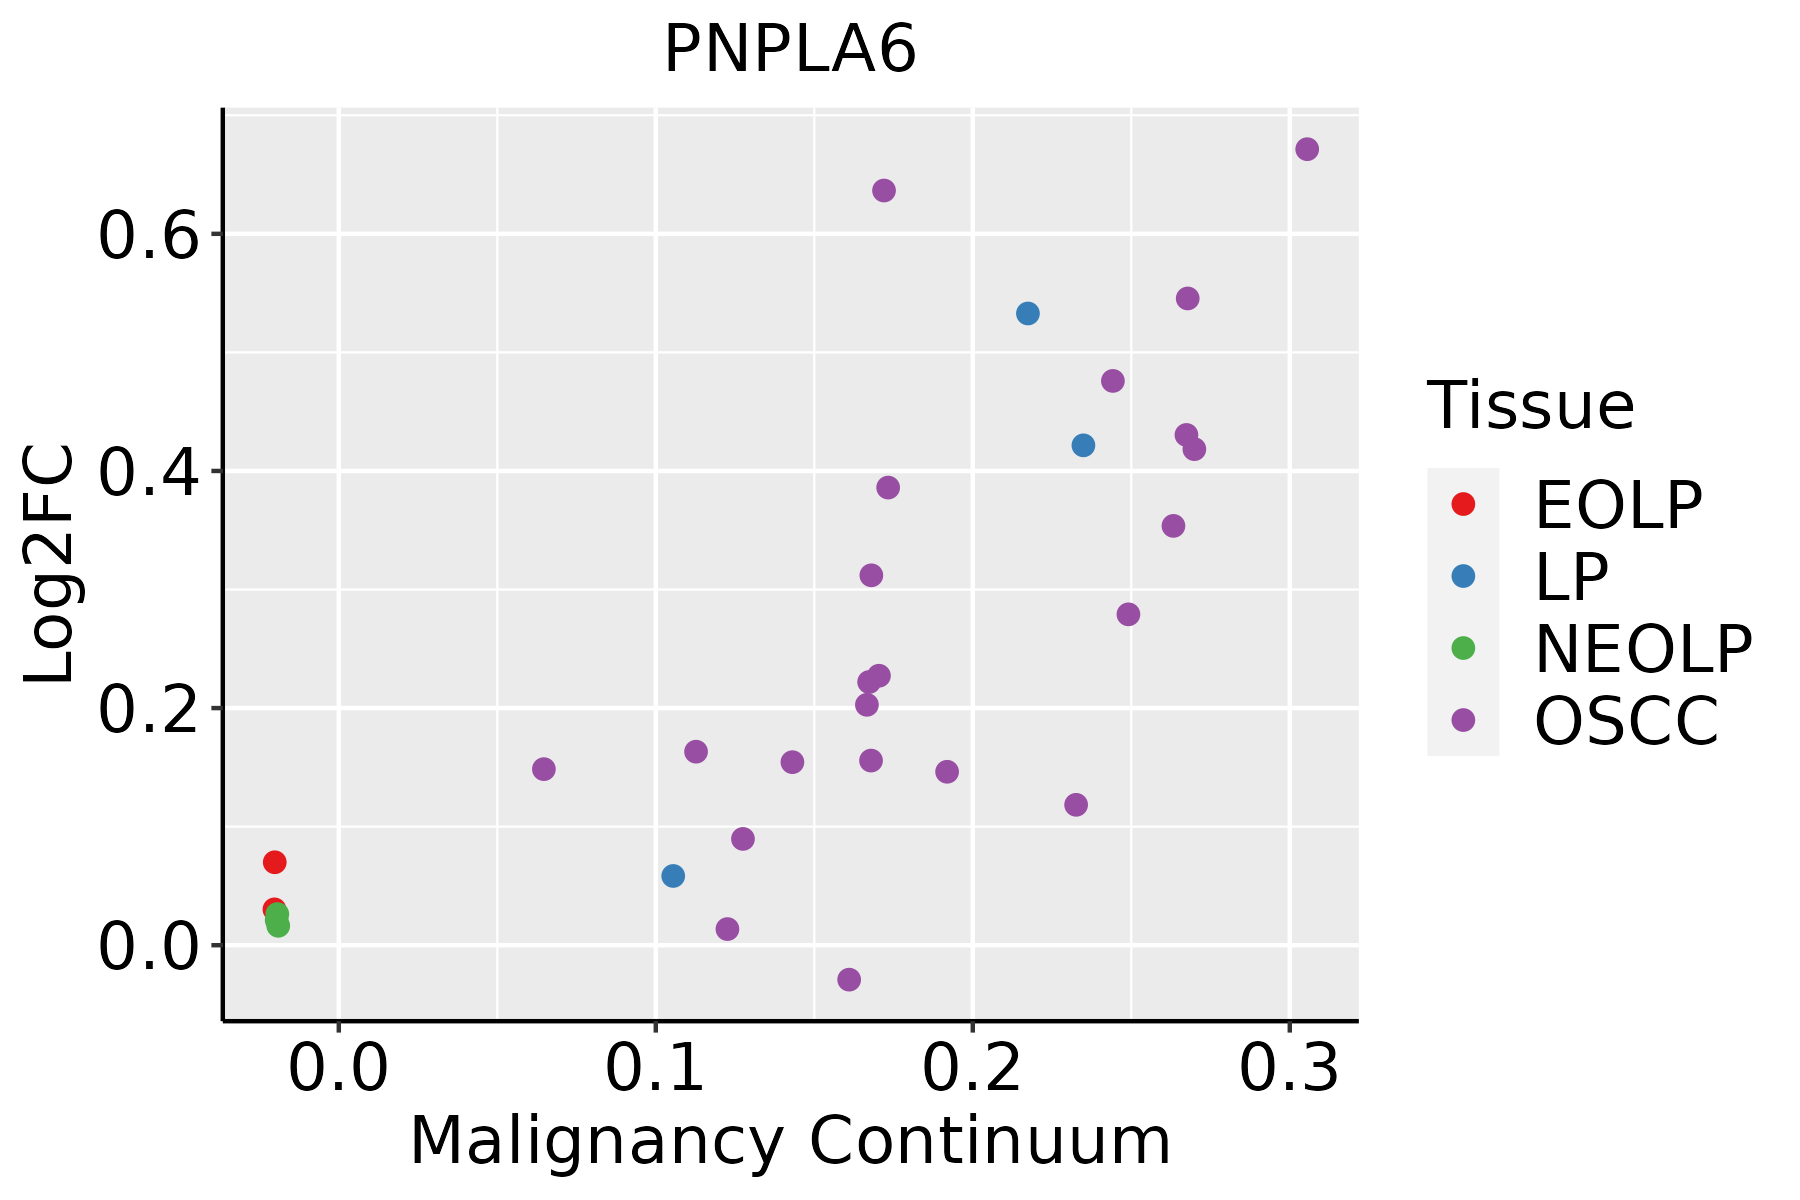 | EOLP: Erosive Oral lichen planus |
| LP: leukoplakia | ||
| NEOLP: Non-erosive oral lichen planus | ||
| OSCC: Oral squamous cell carcinoma | ||
| Thyroid | 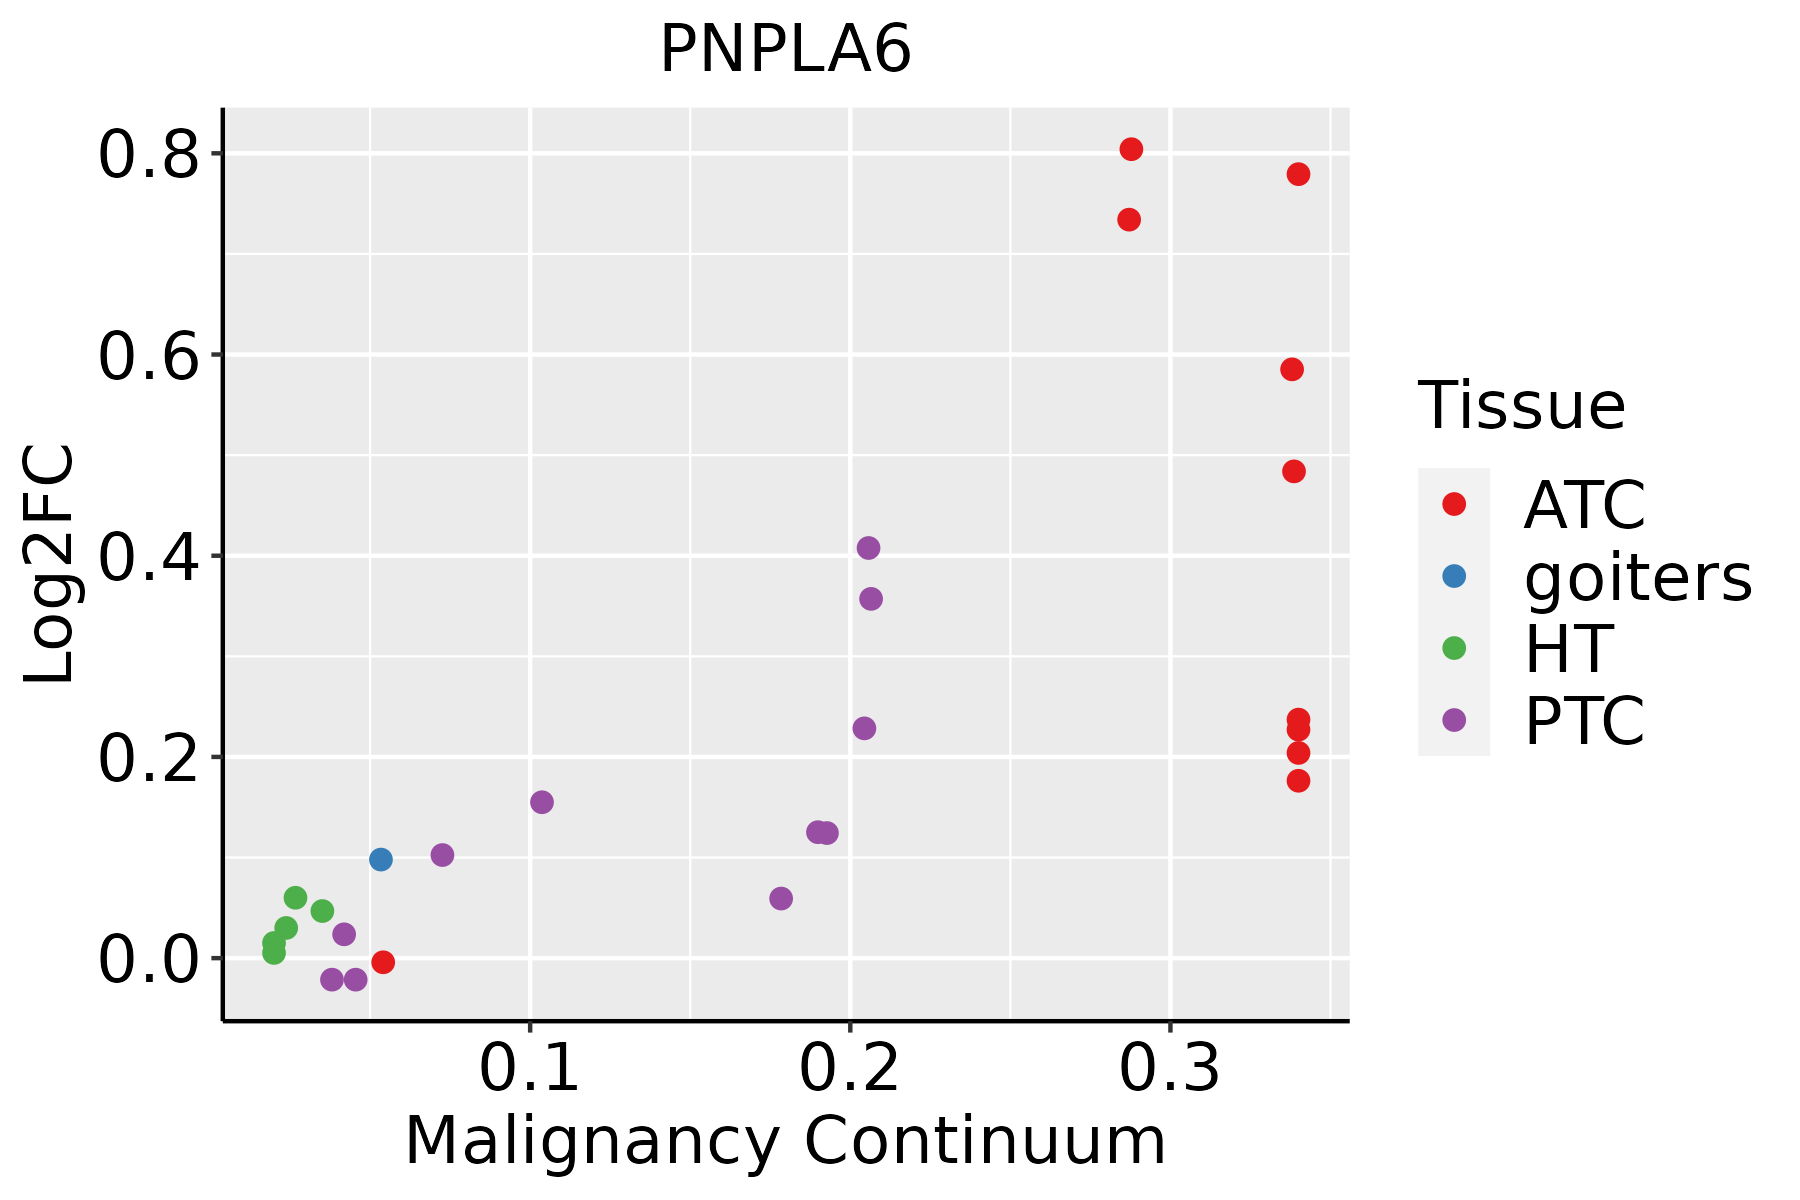 | ATC: Anaplastic thyroid cancer |
| HT: Hashimoto's thyroiditis | ||
| PTC: Papillary thyroid cancer |
| ∗log2FC in expression of this searched gene in stem-like cells from each diseased tissue sample relative to stem-like cells in normal samples in each tissue plotted against the malignancy continuum. Samples are colored based on if they are from different disease stage. |
Top |
Malignant transformation related pathway analysis |
| Find out the enriched GO biological processes and KEGG pathways involved in transition from healthy to precancer to cancer |
| Tissue | Disease Stage | Enriched GO biological Processes |
| Colorectum | AD |  |
| Colorectum | SER |  |
| Colorectum | MSS |  |
| Colorectum | MSI-H |  |
| Colorectum | FAP |  |
| ∗Top 15 enriched GO BP terms are showed in the bar plot of each disease state in each tissue. Each row represents a significant GO biological process which is colored according to the -log10(p.adjust). |
| Page: 1 2 3 4 5 6 7 8 9 |
| GO ID | Tissue | Disease Stage | Description | Gene Ratio | Bg Ratio | pvalue | p.adjust | Count |
| GO:00442426 | Oral cavity | OSCC | cellular lipid catabolic process | 104/7305 | 214/18723 | 2.61e-03 | 1.15e-02 | 104 |
| GO:00066445 | Oral cavity | OSCC | phospholipid metabolic process | 175/7305 | 383/18723 | 4.21e-03 | 1.71e-02 | 175 |
| GO:004424213 | Oral cavity | LP | cellular lipid catabolic process | 70/4623 | 214/18723 | 4.82e-03 | 3.05e-02 | 70 |
| Page: 1 |
| Pathway ID | Tissue | Disease Stage | Description | Gene Ratio | Bg Ratio | pvalue | p.adjust | qvalue | Count |
| Page: 1 |
Top |
Cell-cell communication analysis |
| Identification of potential cell-cell interactions between two cell types and their ligand-receptor pairs for different disease states |
| Ligand | Receptor | LRpair | Pathway | Tissue | Disease Stage |
| Page: 1 |
Top |
Single-cell gene regulatory network inference analysis |
| Find out the significant the regulons (TFs) and the target genes of each regulon across cell types for different disease states |
| TF | Cell Type | Tissue | Disease Stage | Target Gene | RSS | Regulon Activity |
| ∗The dot plots of a searched regulon are shown for all cell subpopulations in each disease state of each tissue based on the regulon specific score inferred using pySCENIC and by calculating the average expression. |
| Page: 1 |
Top |
Somatic mutation of malignant transformation related genes |
| Annotation of somatic variants for genes involved in malignant transformation |
| Hugo Symbol | Variant Class | Variant Classification | dbSNP RS | HGVSc | HGVSp | HGVSp Short | SWISSPROT | BIOTYPE | SIFT | PolyPhen | Tumor Sample Barcode | Tissue | Histology | Sex | Age | Stage | Therapy Types | Drugs | Outcome |
| PNPLA6 | SNV | Missense_Mutation | novel | c.1522N>T | p.Ala508Ser | p.A508S | Q8IY17 | protein_coding | deleterious(0.05) | probably_damaging(0.994) | TCGA-3C-AALI-01 | Breast | breast invasive carcinoma | Female | <65 | I/II | Unspecific | Poly E | Complete Response |
| PNPLA6 | SNV | Missense_Mutation | novel | c.2750G>A | p.Arg917His | p.R917H | Q8IY17 | protein_coding | tolerated(0.07) | probably_damaging(0.996) | TCGA-AC-A2FM-01 | Breast | breast invasive carcinoma | Female | >=65 | I/II | Unknown | Unknown | PD |
| PNPLA6 | SNV | Missense_Mutation | c.356C>T | p.Thr119Ile | p.T119I | Q8IY17 | protein_coding | tolerated(0.12) | probably_damaging(0.996) | TCGA-C8-A131-01 | Breast | breast invasive carcinoma | Female | >=65 | III/IV | Chemotherapy | 5-fluorouracil | CR | |
| PNPLA6 | SNV | Missense_Mutation | novel | c.3287C>T | p.Ser1096Leu | p.S1096L | Q8IY17 | protein_coding | deleterious(0) | possibly_damaging(0.674) | TCGA-E2-A574-01 | Breast | breast invasive carcinoma | Female | <65 | I/II | Chemotherapy | adriamycin | SD |
| PNPLA6 | SNV | Missense_Mutation | novel | c.860C>T | p.Ala287Val | p.A287V | Q8IY17 | protein_coding | deleterious(0.01) | probably_damaging(0.987) | TCGA-EW-A423-01 | Breast | breast invasive carcinoma | Female | >=65 | I/II | Hormone Therapy | anastrozole | SD |
| PNPLA6 | SNV | Missense_Mutation | rs769165609 | c.1712N>A | p.Cys571Tyr | p.C571Y | Q8IY17 | protein_coding | tolerated(0.29) | benign(0.116) | TCGA-2W-A8YY-01 | Cervix | cervical & endocervical cancer | Female | <65 | I/II | Chemotherapy | cisplatin | CR |
| PNPLA6 | SNV | Missense_Mutation | c.2092N>A | p.Gly698Ser | p.G698S | Q8IY17 | protein_coding | deleterious(0) | probably_damaging(0.96) | TCGA-2W-A8YY-01 | Cervix | cervical & endocervical cancer | Female | <65 | I/II | Chemotherapy | cisplatin | CR | |
| PNPLA6 | SNV | Missense_Mutation | rs144558473 | c.3991N>A | p.Asp1331Asn | p.D1331N | Q8IY17 | protein_coding | tolerated(0.08) | benign(0.052) | TCGA-DS-A0VL-01 | Cervix | cervical & endocervical cancer | Female | <65 | I/II | Unknown | Unknown | SD |
| PNPLA6 | SNV | Missense_Mutation | novel | c.2036N>T | p.Gln679Leu | p.Q679L | Q8IY17 | protein_coding | tolerated(0.35) | benign(0.116) | TCGA-DS-A1OB-01 | Cervix | cervical & endocervical cancer | Female | <65 | I/II | Chemotherapy | carboplatin | PD |
| PNPLA6 | SNV | Missense_Mutation | novel | c.2783G>A | p.Cys928Tyr | p.C928Y | Q8IY17 | protein_coding | deleterious(0.01) | possibly_damaging(0.804) | TCGA-EA-A3HU-01 | Cervix | cervical & endocervical cancer | Female | <65 | I/II | Unknown | Unknown | SD |
| Page: 1 2 3 4 5 6 7 8 9 10 11 12 13 |
Top |
Related drugs of malignant transformation related genes |
| Identification of chemicals and drugs interact with genes involved in malignant transfromation |
| (DGIdb 4.0) |
| Entrez ID | Symbol | Category | Interaction Types | Drug Claim Name | Drug Name | PMIDs |
| Page: 1 |

Copyright 2023-Present -The University of Texas Health Science Center at Houston |